| Param | Original file | Final file |
|---|---|---|
| Filename | modeM0/AS1A04_037T01_9000002312_15604cztM0_level2.evt | modeM0/AS1A04_037T01_9000002312_15604cztM0_level2_quad_clean.evt |
| Size (bytes) | 436,086,720 | 83,036,160 |
| Size | 415.9 MB | 79.2 MB |
| Events in quadrant A | 3,303,172 | 530,957 |
| Events in quadrant B | 3,360,812 | 539,741 |
| Events in quadrant C | 3,097,673 | 513,144 |
| Events in quadrant D | 3,034,977 | 509,018 |
| Mode SS | |||
|---|---|---|---|
| Quadrant | BADHDUFLAG | Total packets | Discarded packets |
| A | 0 | 124 | 0 |
| B | 0 | 124 | 0 |
| C | 0 | 124 | 0 |
| D | 0 | 124 | 0 |
| Mode M0 | |||
|---|---|---|---|
| Quadrant | BADHDUFLAG | Total packets | Discarded packets |
| A | 0 | 13245 | 2 |
| B | 0 | 13455 | 1 |
| C | 0 | 12602 | 1 |
| D | 0 | 12636 | 1 |
| Mode M9 | |||
|---|---|---|---|
| Quadrant | BADHDUFLAG | Total packets | Discarded packets |
| A | 0 | 13 | 0 |
| B | 0 | 13 | 0 |
| C | 0 | 13 | 0 |
| D | 0 | 13 | 0 |
| Quadrant | Total seconds | Saturated seconds | Saturation percentage |
|---|---|---|---|
| A | 6034 | 72 | 1.193238% |
| B | 6034 | 74 | 1.226384% |
| C | 6034 | 76 | 1.259529% |
| D | 6034 | 43 | 0.712628% |
Noise dominated data is calculated using 1-second bins in cleaned event files. If a bin has >2000 counts, and if more than 50% of those come from <1% of pixels, then it is considered to be noise-dominated and hence unusable.
| Quadrant | # 1 sec bins | Bins with >0 counts | Bins with >2000 counts | High rate bins dominated by noise | Noise dominated (total time) | Noise dominated (detector-on time) | Marked lightcurve |
|---|---|---|---|---|---|---|---|
| A | 7350 | 6036 | 19 | 19 | 0.26% | 0.31% | 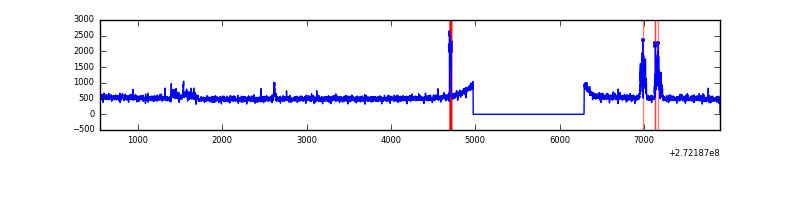 |
| B | 7350 | 6035 | 4 | 4 | 0.05% | 0.07% | 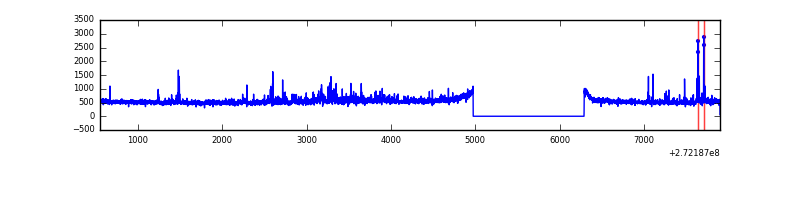 |
| C | 7350 | 6036 | 0 | 0 | 0.00% | 0.00% | 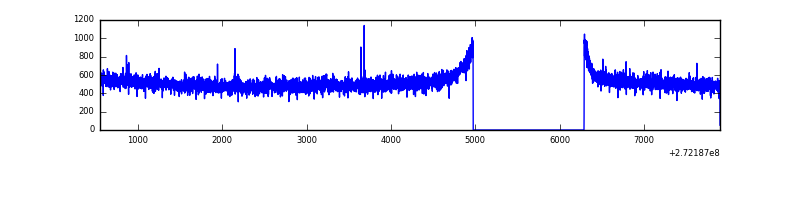 |
| D | 7350 | 6036 | 6 | 6 | 0.08% | 0.10% | 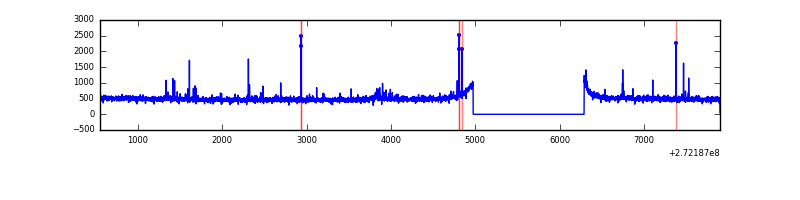 |
Top three noisy pixels from each quadrant. If the there are fewer than three noisy pixels in the level2.evt file, extra rows are filled as -1
| Pixel properties | Quadrant properties | ||||||
|---|---|---|---|---|---|---|---|
| Quadrant | DetID | PixID | Counts | Sigma | Mean | Median | Sigma |
| A | 0 | 253 | 241543 | 1518.95 | 794 | 777 | 158.5 |
| A | 0 | 226 | 7452 | 42.11 | 794 | 777 | 158.5 |
| A | 12 | 194 | 5939 | 32.57 | 794 | 777 | 158.5 |
| B | 4 | 251 | 216653 | 1459.23 | 781 | 762 | 147.9 |
| B | 15 | 201 | 31541 | 208.04 | 781 | 762 | 147.9 |
| B | 4 | 173 | 27025 | 177.51 | 781 | 762 | 147.9 |
| C | 14 | 238 | 116170 | 663.55 | 753 | 760 | 173.9 |
| C | 3 | 233 | 27180 | 151.9 | 753 | 760 | 173.9 |
| C | 7 | 247 | 7486 | 38.67 | 753 | 760 | 173.9 |
| D | 5 | 51 | 27701 | 142.26 | 779 | 758 | 189.4 |
| D | 2 | 234 | 26347 | 135.11 | 779 | 758 | 189.4 |
| D | 10 | 70 | 19021 | 96.43 | 779 | 758 | 189.4 |
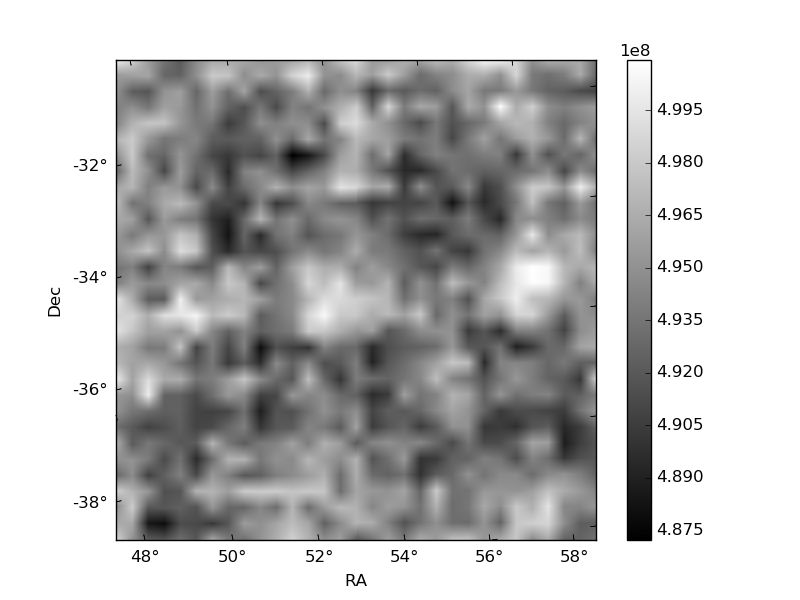
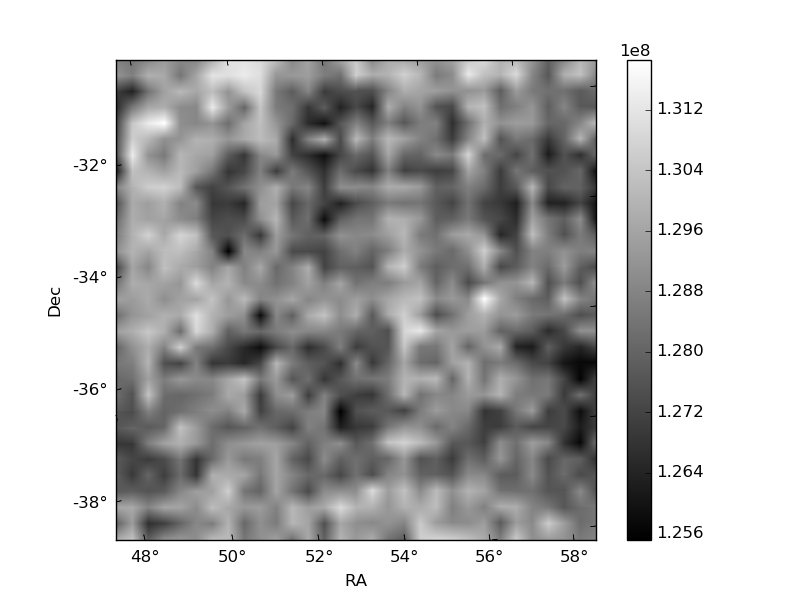
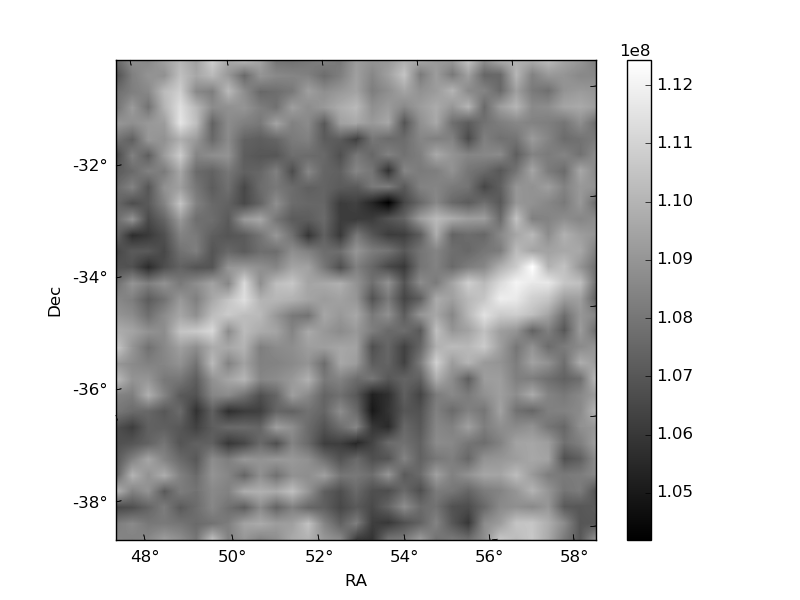
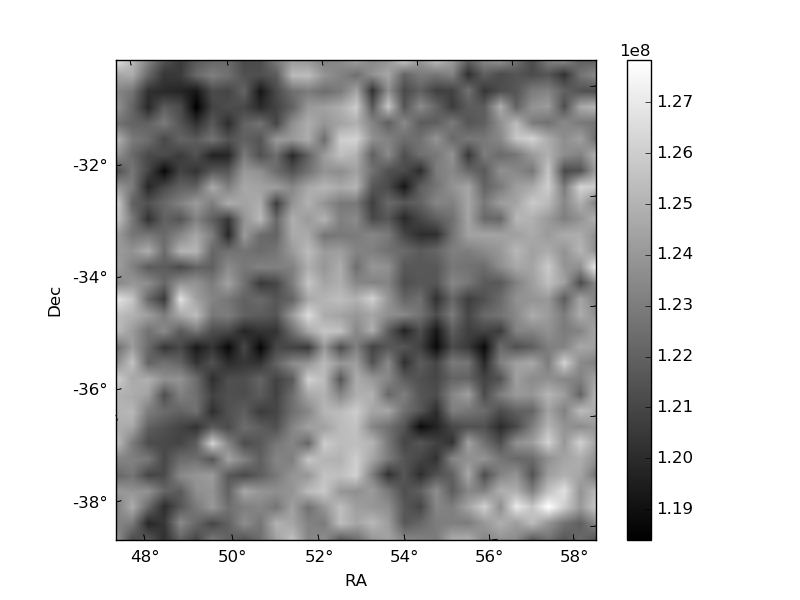
Histogram calculated using DETX and DETY for each event in the final _common_clean file
| Quadrant A | 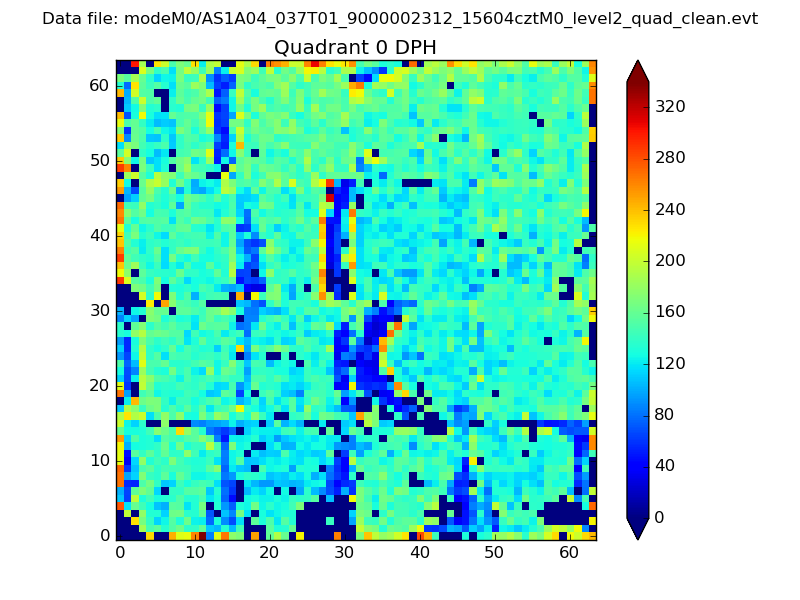 |
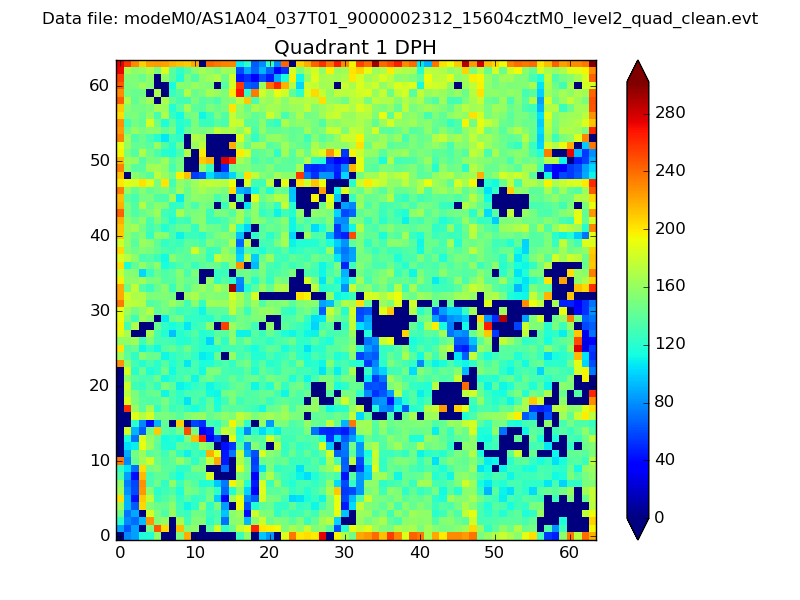 |
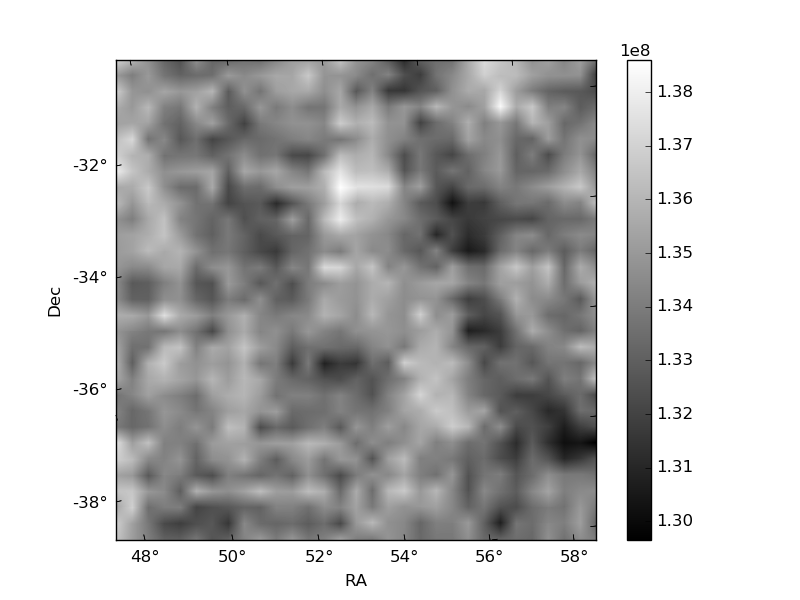
Quadrant B |
|---|---|---|---|
| Quadrant D | 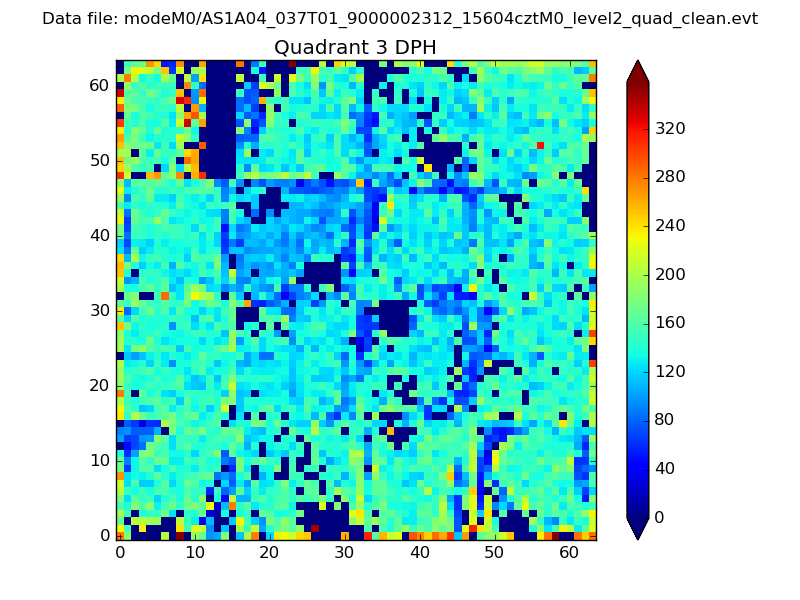 |
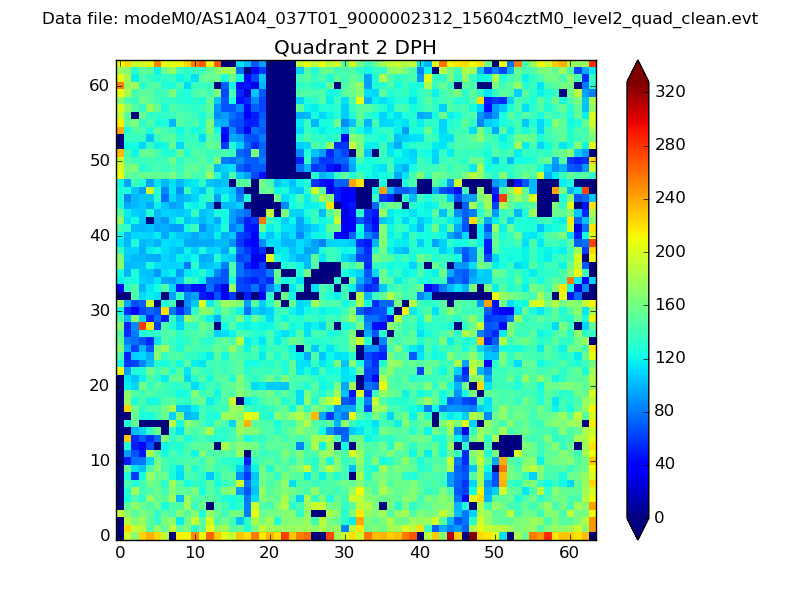 |
Quadrant C |
| Plot type | Count rate plots | Images |
|---|---|---|
| Comparison with Poisson distribution Blue bars denote a histogram of data divided into 1 sec bins. Red curve is a Poisson curve with rate = median count rate of data. |
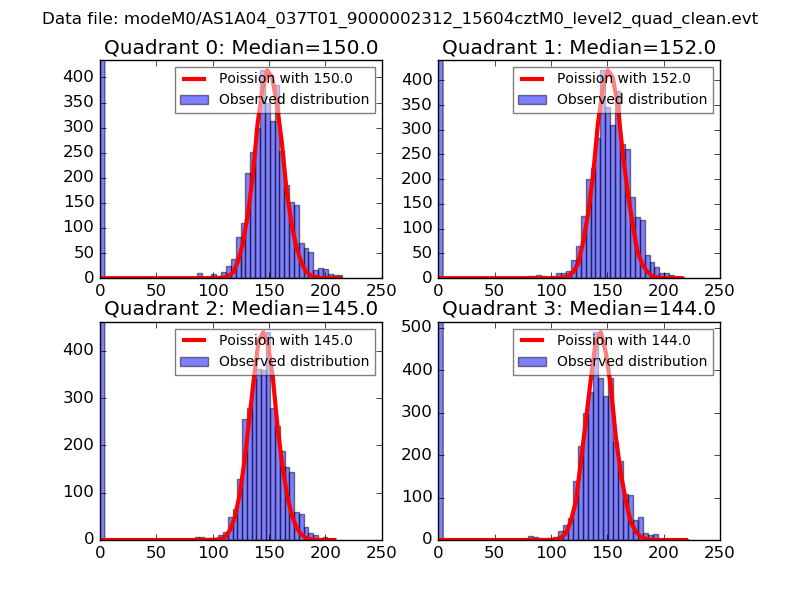 |
 |
| Quadrant-wise count rates Data is divided into 100 sec bins |
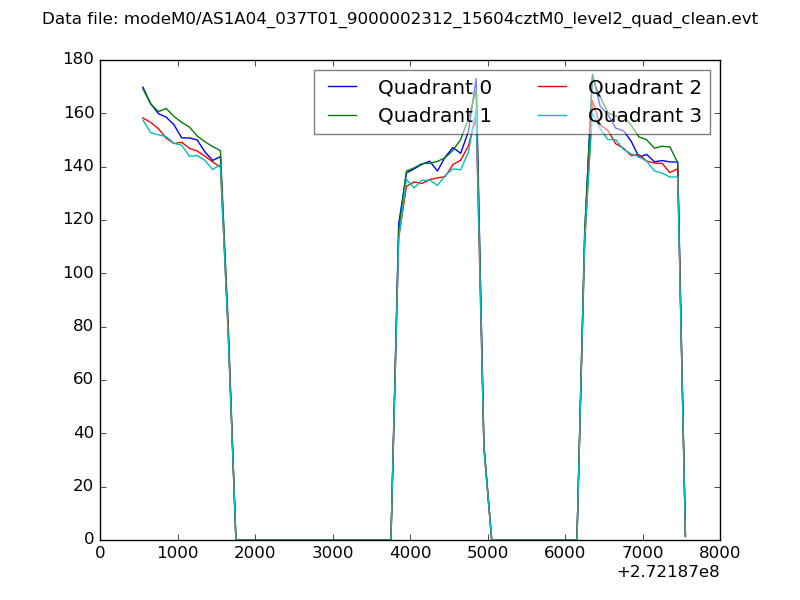 |
|
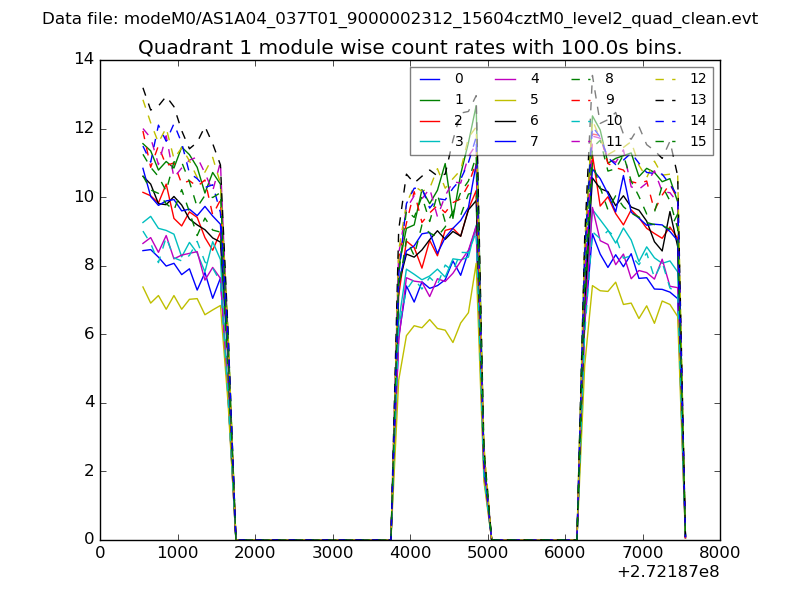
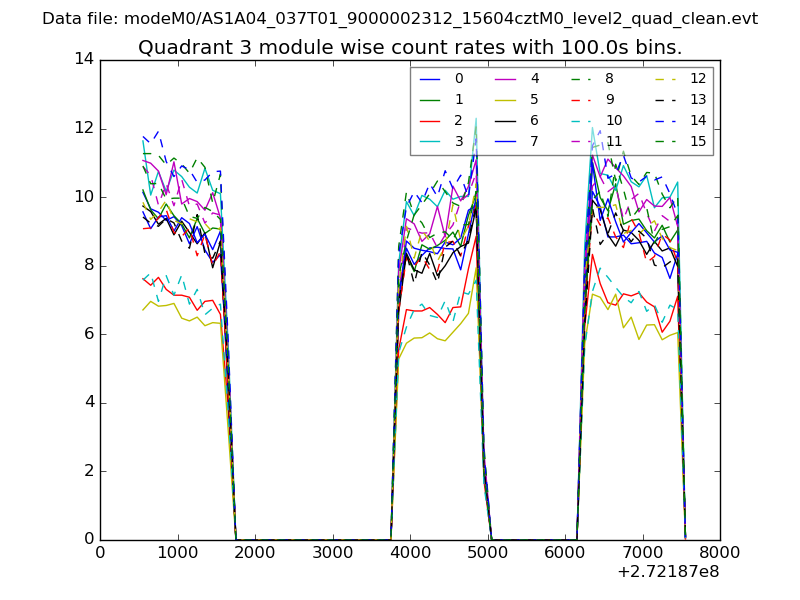
| Module-wise count rates for Quadrant A Data is divided into 100 sec bins |
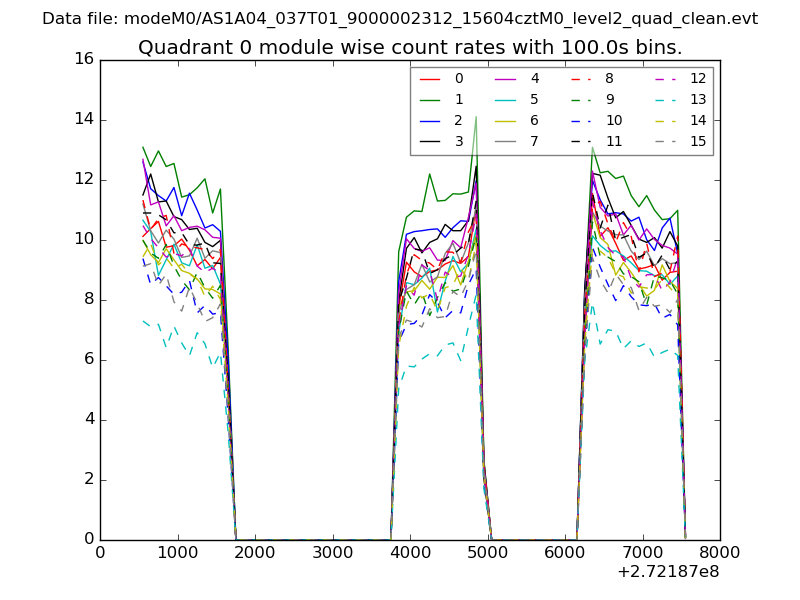 |
 |
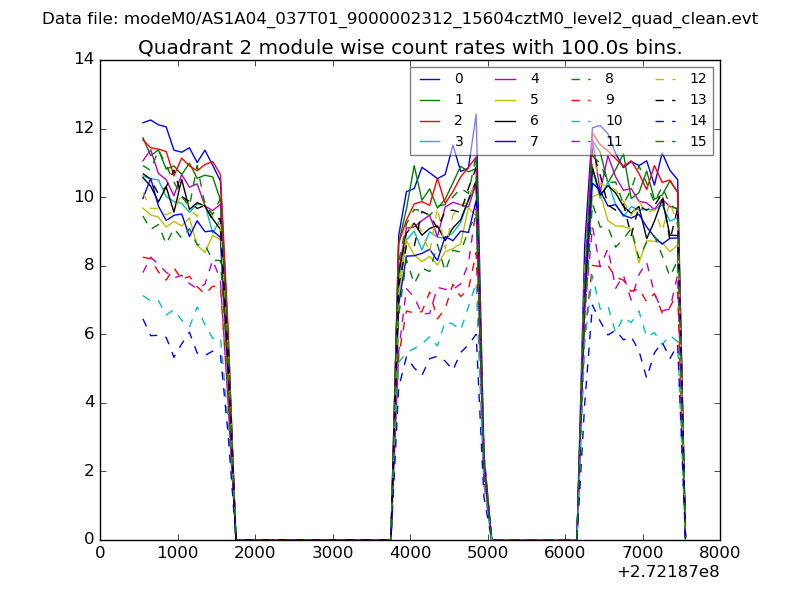
| Module-wise count rates for Quadrant B Data is divided into 100 sec bins |
 |
 |
| Module-wise count rates for Quadrant C Data is divided into 100 sec bins |
 |
 |
| Module-wise count rates for Quadrant D Data is divided into 100 sec bins |
 |
 |
| Parameter | Plot |
|---|---|
| CZT HV Monitor | 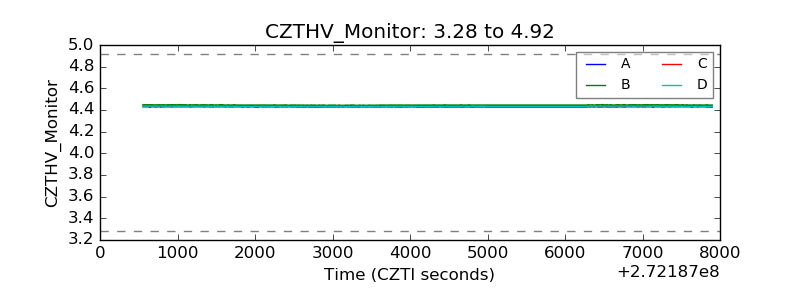 |
| D_VDD | 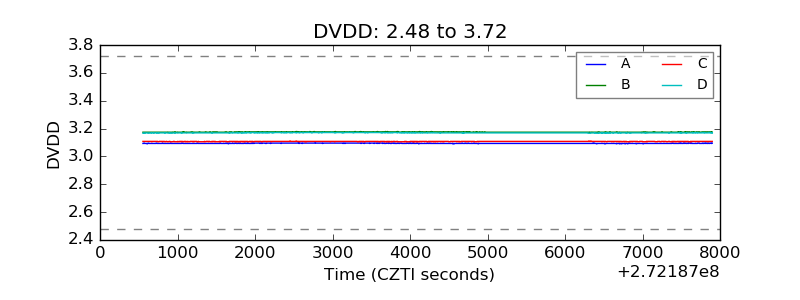 |
| Temperature 1 |  |
| Veto HV Monitor | 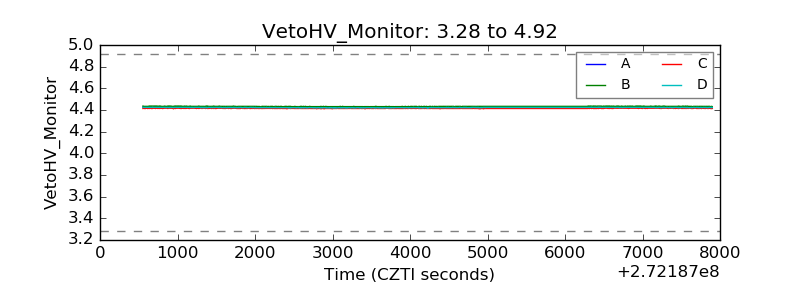 |
| Veto LLD | 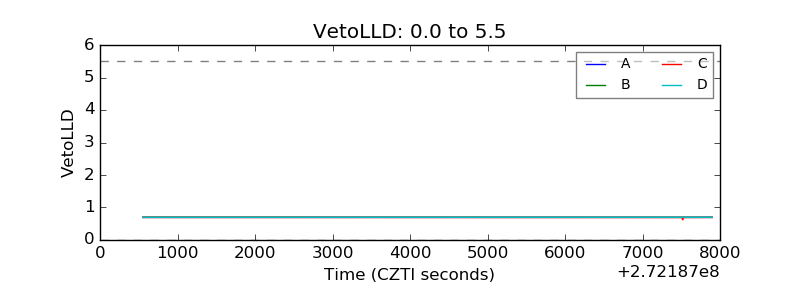 |
| Alpha Counter | 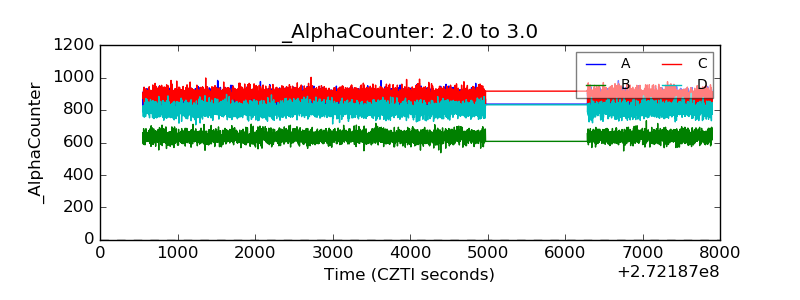 |
| _CPM_Rate | 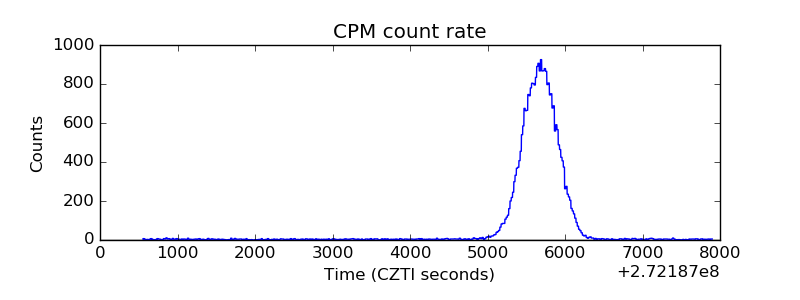 |
| CZT Counter |  |
| +2.5 Volts monitor |  |
| +5 Volts monitor | 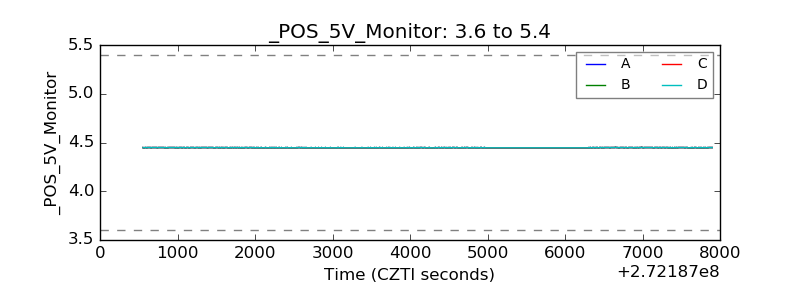 |
| _ROLL_ROT | 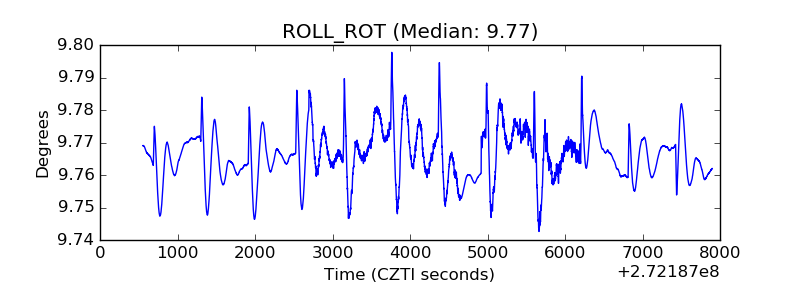 |
| _Roll_DEC | 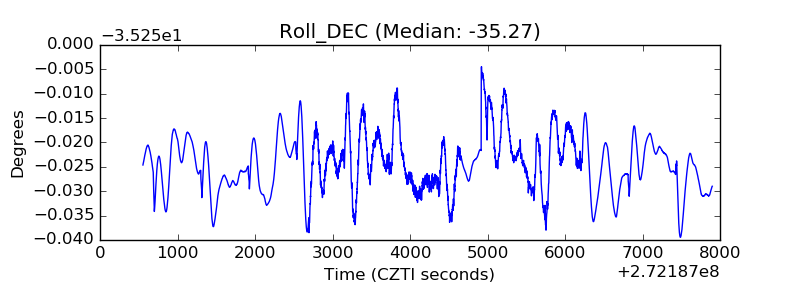 |
| _Roll_RA |  |
| Veto Counter | 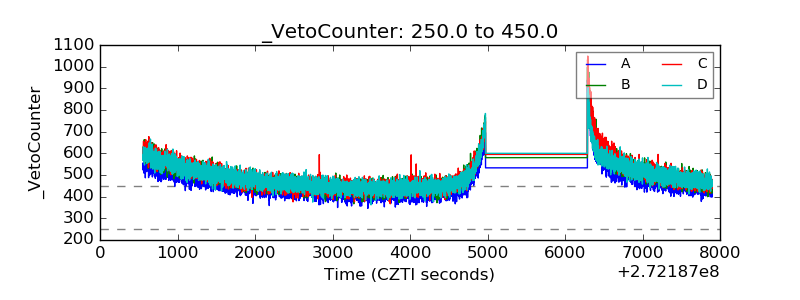 |