| Param | Original file | Final file |
|---|---|---|
| Filename | modeM0/AS1A04_037T01_9000002312_15606cztM0_level2.evt | modeM0/AS1A04_037T01_9000002312_15606cztM0_level2_quad_clean.evt |
| Size (bytes) | 485,164,800 | 80,190,720 |
| Size | 462.7 MB | 76.5 MB |
| Events in quadrant A | 3,477,451 | 491,094 |
| Events in quadrant B | 3,956,072 | 495,809 |
| Events in quadrant C | 3,471,899 | 476,997 |
| Events in quadrant D | 3,310,001 | 474,246 |
| Mode SS | |||
|---|---|---|---|
| Quadrant | BADHDUFLAG | Total packets | Discarded packets |
| A | 0 | 142 | 0 |
| B | 0 | 142 | 0 |
| C | 0 | 142 | 0 |
| D | 0 | 142 | 0 |
| Mode M0 | |||
|---|---|---|---|
| Quadrant | BADHDUFLAG | Total packets | Discarded packets |
| A | 0 | 14715 | 2 |
| B | 0 | 15913 | 1 |
| C | 0 | 14578 | 1 |
| D | 0 | 14534 | 1 |
| Mode M9 | |||
|---|---|---|---|
| Quadrant | BADHDUFLAG | Total packets | Discarded packets |
| A | 0 | 7 | 0 |
| B | 0 | 7 | 0 |
| C | 0 | 7 | 0 |
| D | 0 | 7 | 0 |
| Quadrant | Total seconds | Saturated seconds | Saturation percentage |
|---|---|---|---|
| A | 7033 | 149 | 2.118584% |
| B | 7033 | 169 | 2.402957% |
| C | 7033 | 150 | 2.132803% |
| D | 7033 | 118 | 1.677805% |
Noise dominated data is calculated using 1-second bins in cleaned event files. If a bin has >2000 counts, and if more than 50% of those come from <1% of pixels, then it is considered to be noise-dominated and hence unusable.
| Quadrant | # 1 sec bins | Bins with >0 counts | Bins with >2000 counts | High rate bins dominated by noise | Noise dominated (total time) | Noise dominated (detector-on time) | Marked lightcurve |
|---|---|---|---|---|---|---|---|
| A | 7739 | 7034 | 3 | 3 | 0.04% | 0.04% | 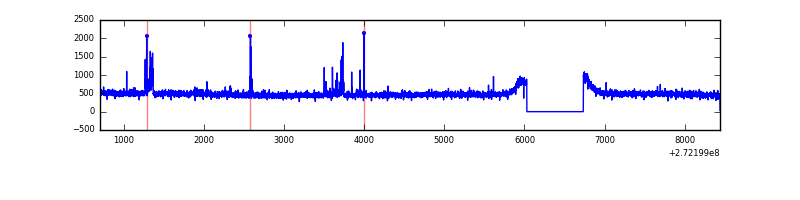 |
| B | 7739 | 7034 | 2 | 2 | 0.03% | 0.03% | 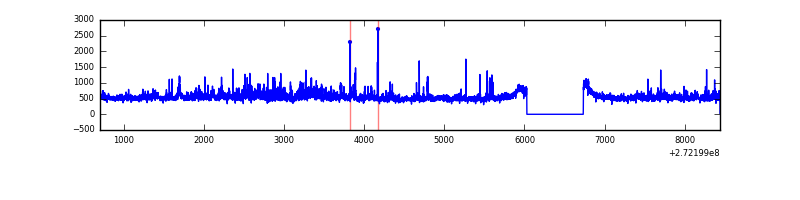 |
| C | 7739 | 7034 | 0 | 0 | 0.00% | 0.00% | 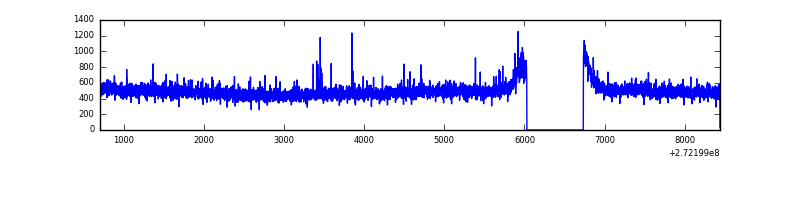 |
| D | 7739 | 7034 | 4 | 4 | 0.05% | 0.06% | 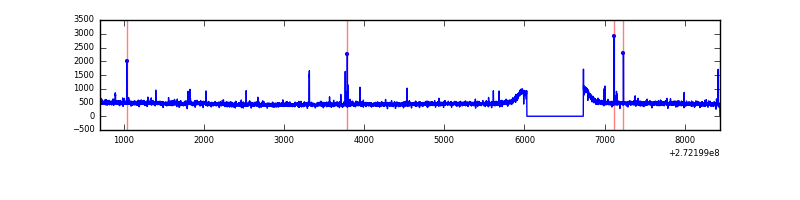 |
Top three noisy pixels from each quadrant. If the there are fewer than three noisy pixels in the level2.evt file, extra rows are filled as -1
| Pixel properties | Quadrant properties | ||||||
|---|---|---|---|---|---|---|---|
| Quadrant | DetID | PixID | Counts | Sigma | Mean | Median | Sigma |
| A | 0 | 253 | 56808 | 315.66 | 876 | 857 | 177.2 |
| A | 4 | 2 | 28649 | 156.8 | 876 | 857 | 177.2 |
| A | 13 | 248 | 10087 | 52.07 | 876 | 857 | 177.2 |
| B | 4 | 251 | 430269 | 2554.27 | 866 | 843 | 168.1 |
| B | 4 | 173 | 34402 | 199.61 | 866 | 843 | 168.1 |
| B | 4 | 48 | 26774 | 154.24 | 866 | 843 | 168.1 |
| C | 14 | 238 | 128443 | 653.57 | 836 | 843 | 195.2 |
| C | 3 | 233 | 34243 | 171.08 | 836 | 843 | 195.2 |
| C | 7 | 247 | 31314 | 156.07 | 836 | 843 | 195.2 |
| D | 2 | 234 | 32493 | 152.86 | 857 | 833 | 207.1 |
| D | 15 | 145 | 16857 | 77.36 | 857 | 833 | 207.1 |
| D | 10 | 70 | 13900 | 63.09 | 857 | 833 | 207.1 |
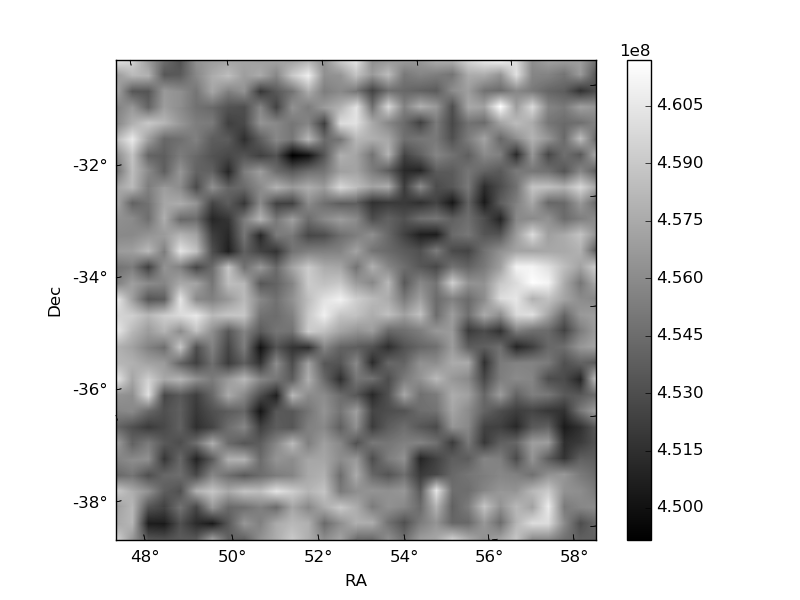
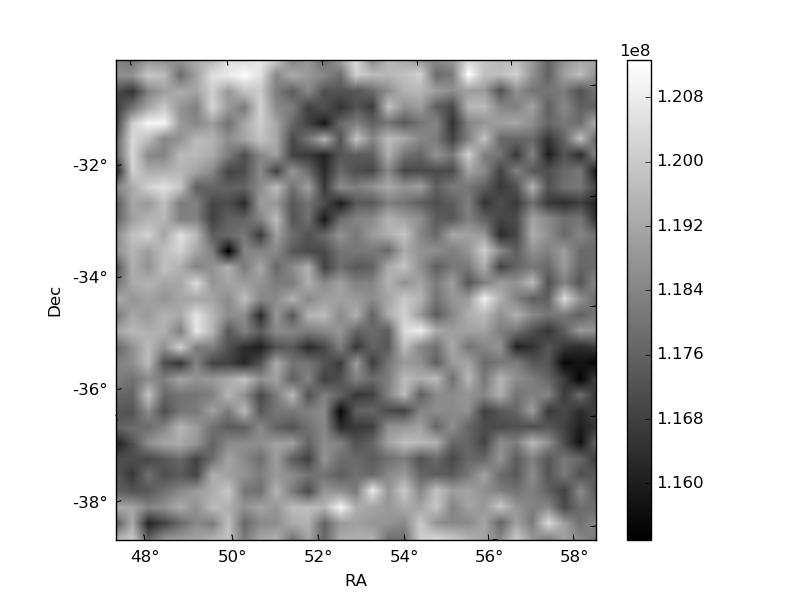
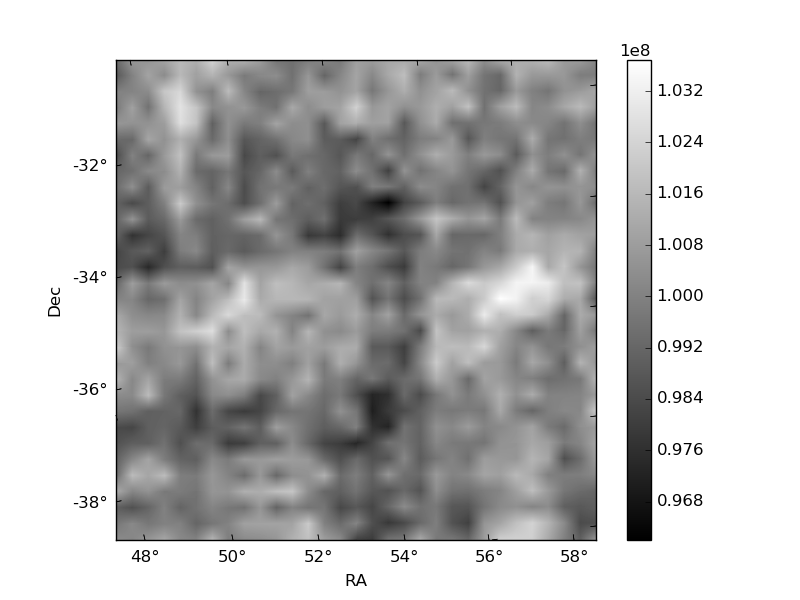
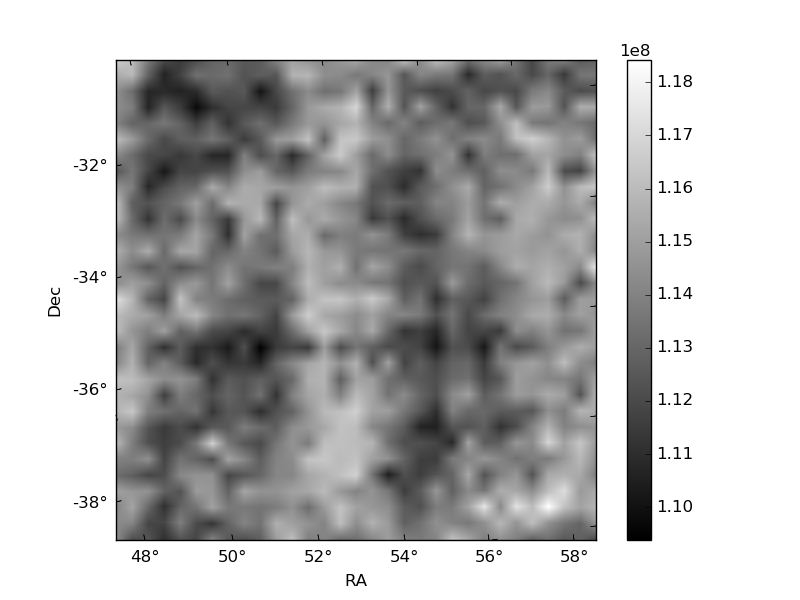
Histogram calculated using DETX and DETY for each event in the final _common_clean file
| Quadrant A | 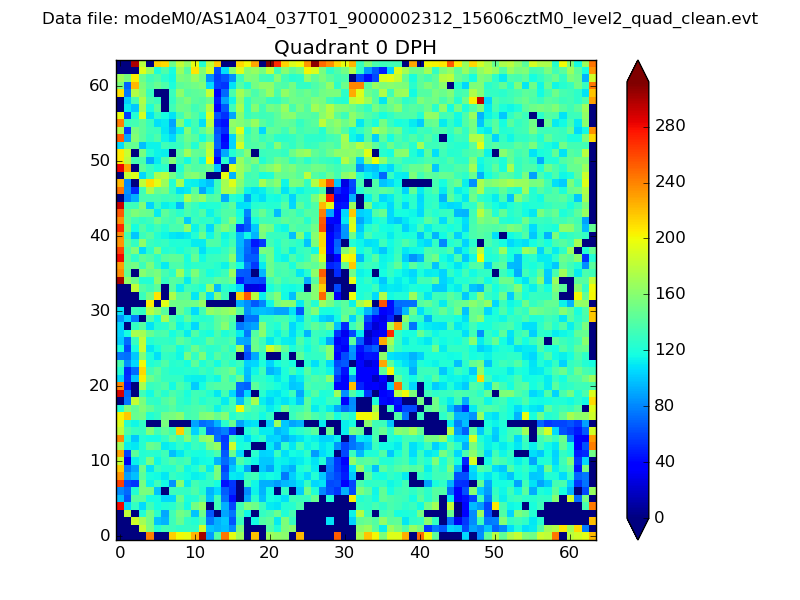 |
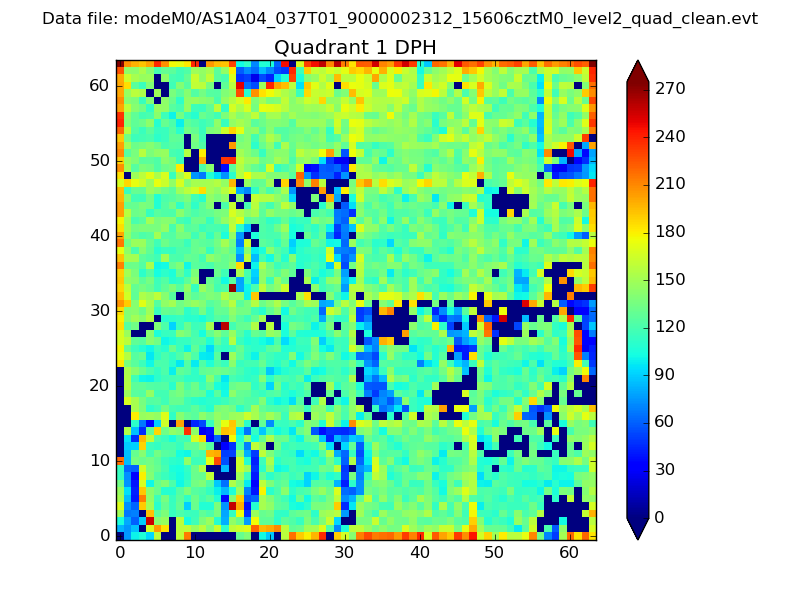 |
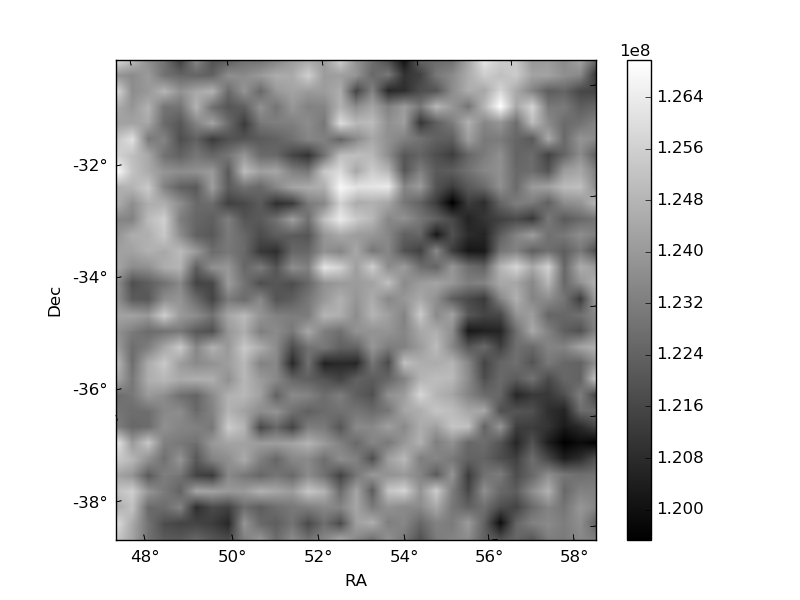
Quadrant B |
|---|---|---|---|
| Quadrant D | 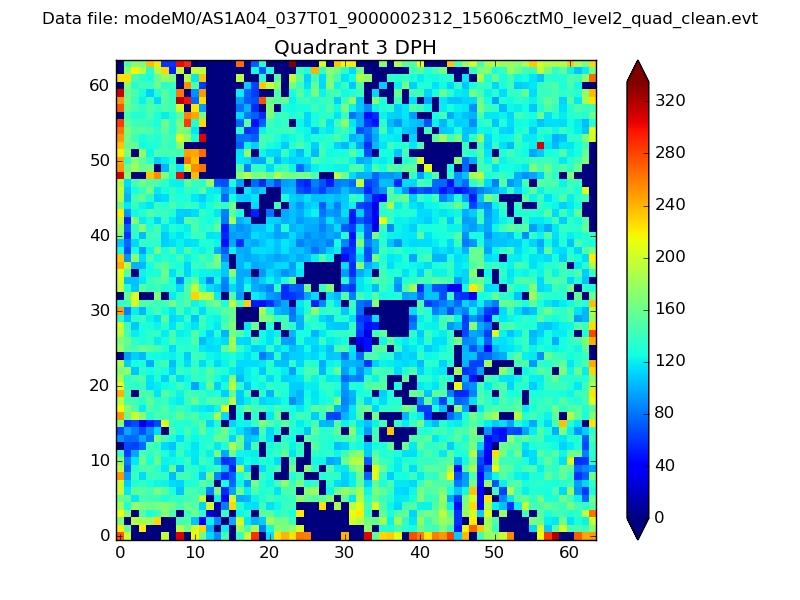 |
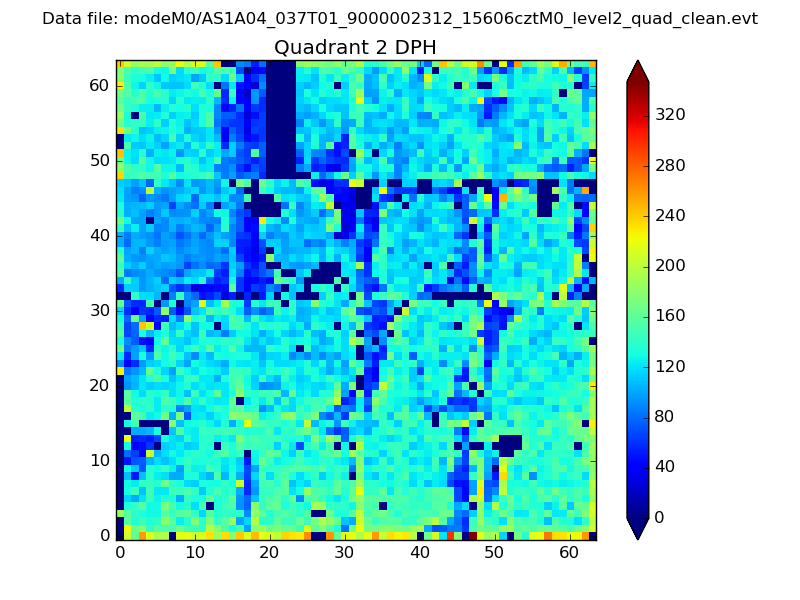 |
Quadrant C |
| Plot type | Count rate plots | Images |
|---|---|---|
| Comparison with Poisson distribution Blue bars denote a histogram of data divided into 1 sec bins. Red curve is a Poisson curve with rate = median count rate of data. |
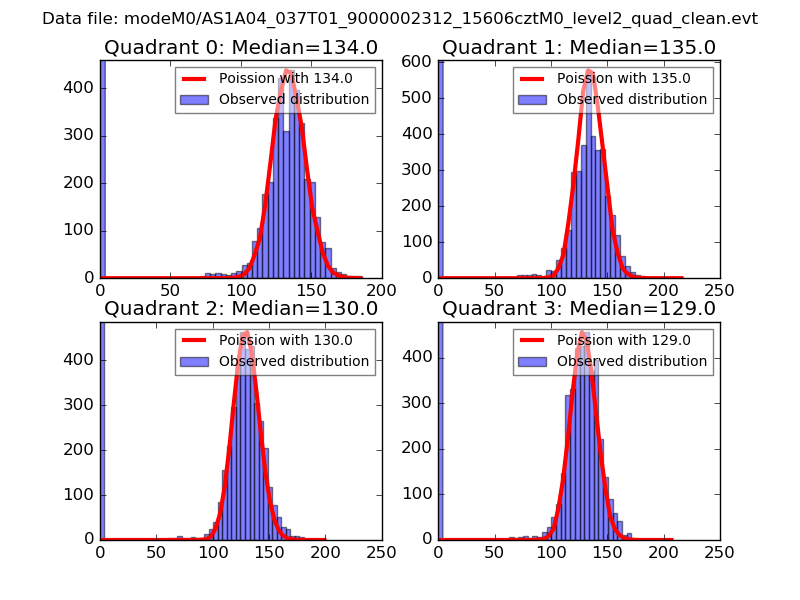 |
 |
| Quadrant-wise count rates Data is divided into 100 sec bins |
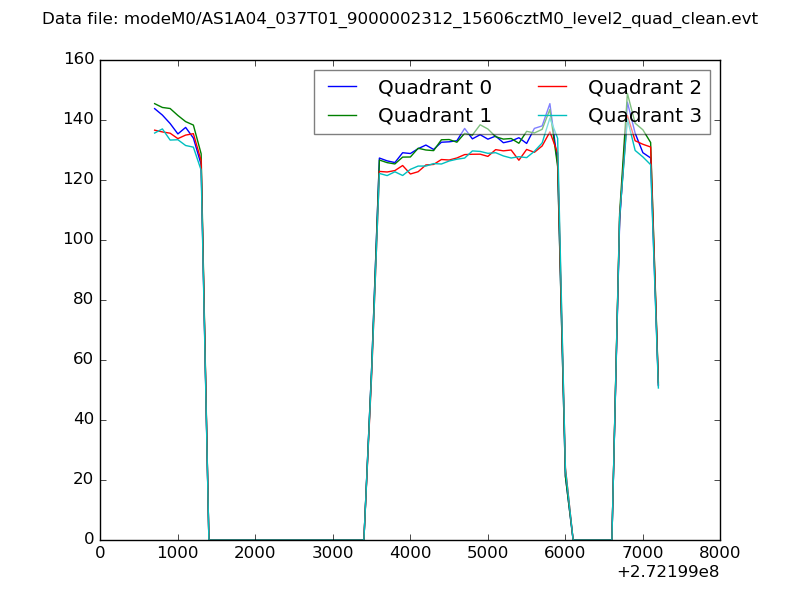 |
|
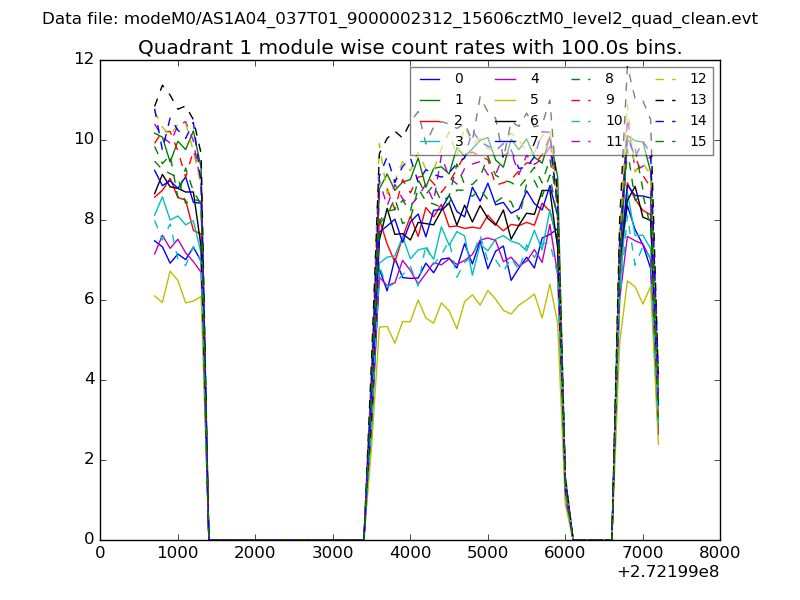
| Module-wise count rates for Quadrant A Data is divided into 100 sec bins |
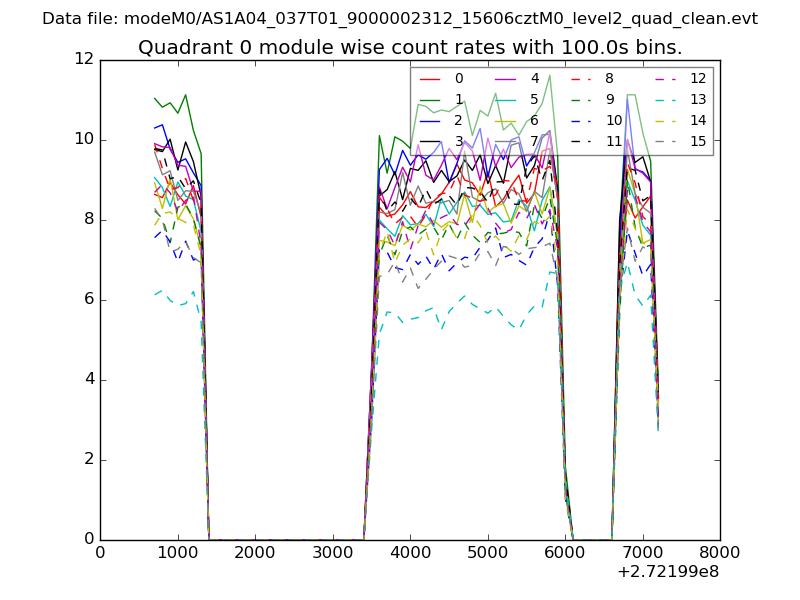 |
 |
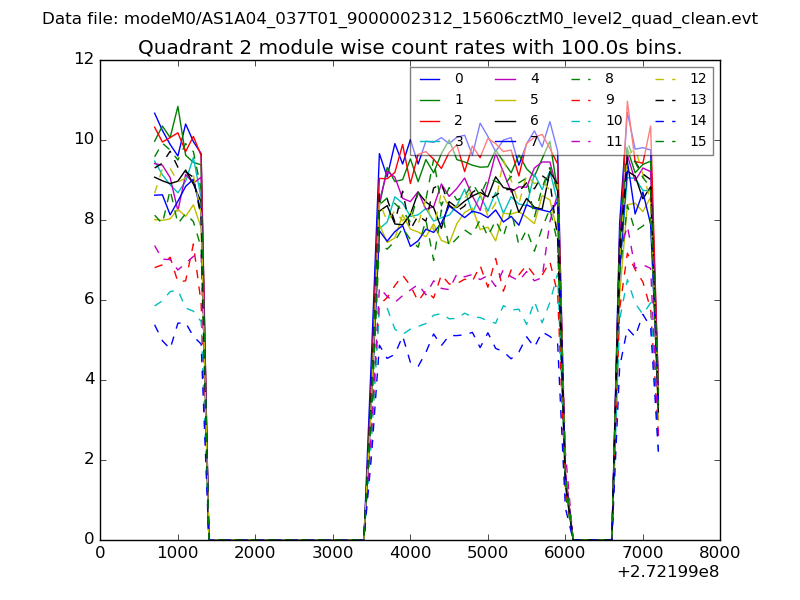
| Module-wise count rates for Quadrant B Data is divided into 100 sec bins |
 |
 |
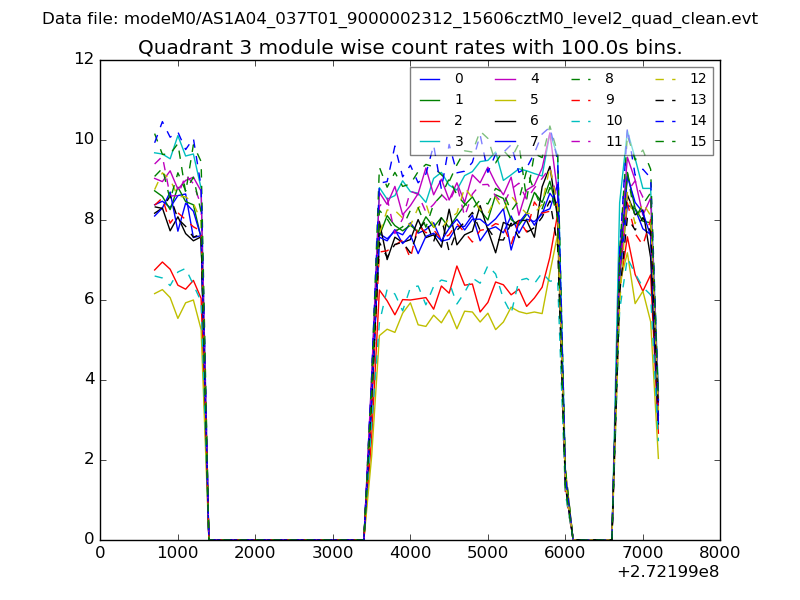
| Module-wise count rates for Quadrant C Data is divided into 100 sec bins |
 |
 |
| Module-wise count rates for Quadrant D Data is divided into 100 sec bins |
 |
 |
| Parameter | Plot |
|---|---|
| CZT HV Monitor | 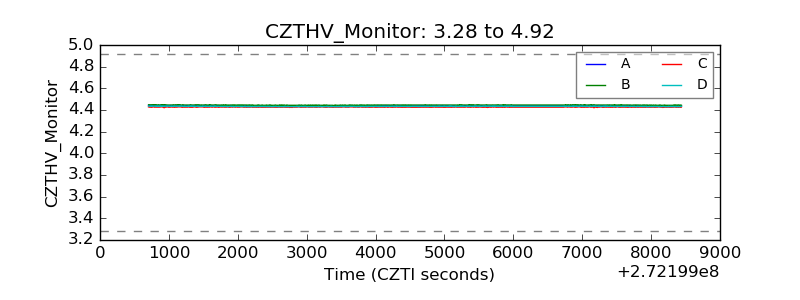 |
| D_VDD | 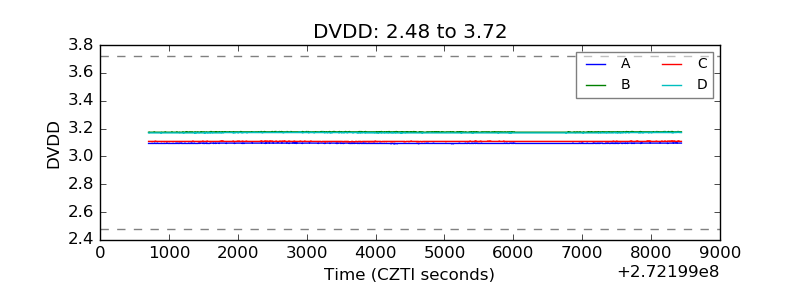 |
| Temperature 1 | 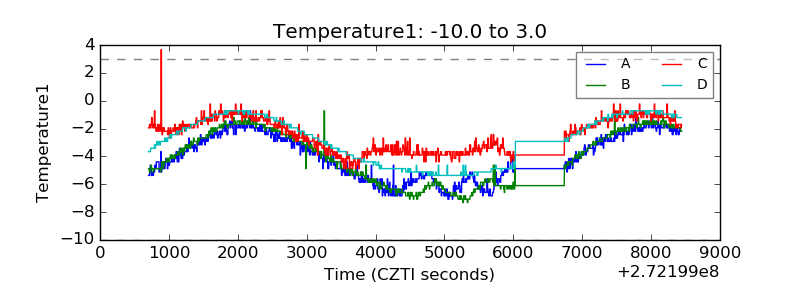 |
| Veto HV Monitor |  |
| Veto LLD | 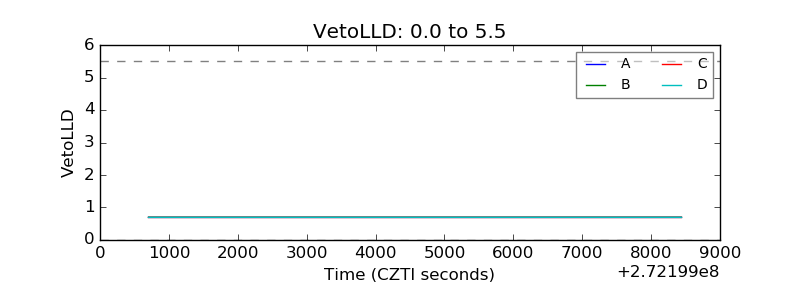 |
| Alpha Counter | 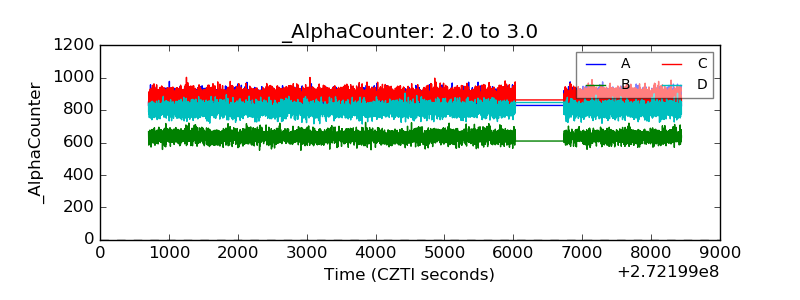 |
| _CPM_Rate | 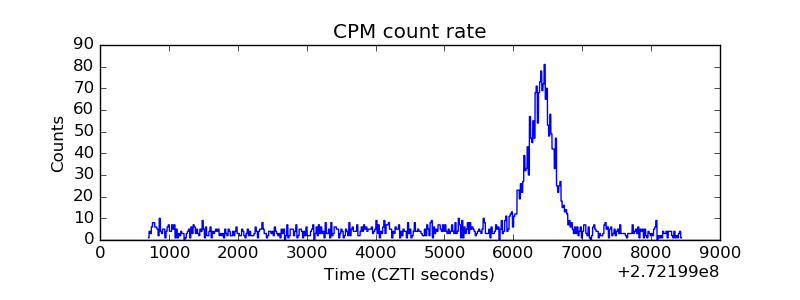 |
| CZT Counter | 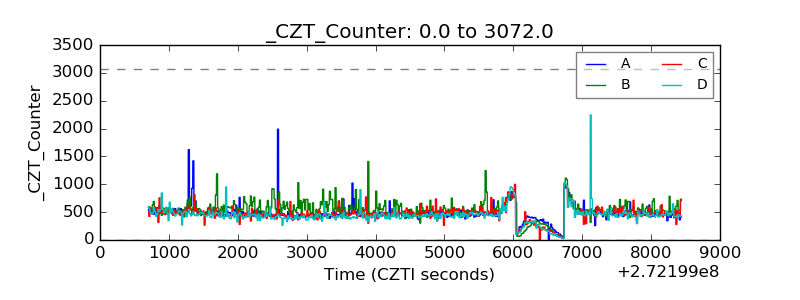 |
| +2.5 Volts monitor | 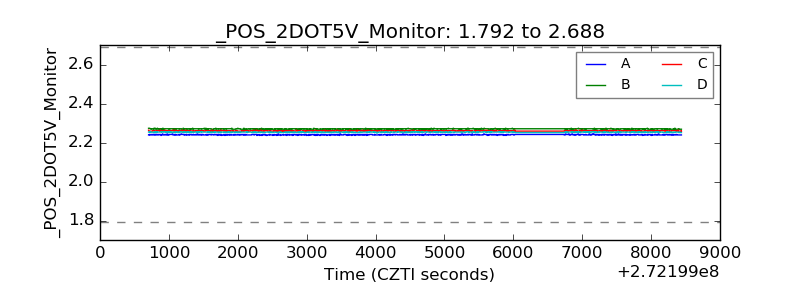 |
| +5 Volts monitor |  |
| _ROLL_ROT | 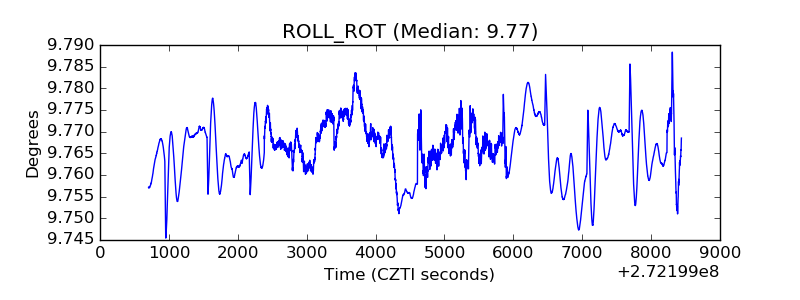 |
| _Roll_DEC | 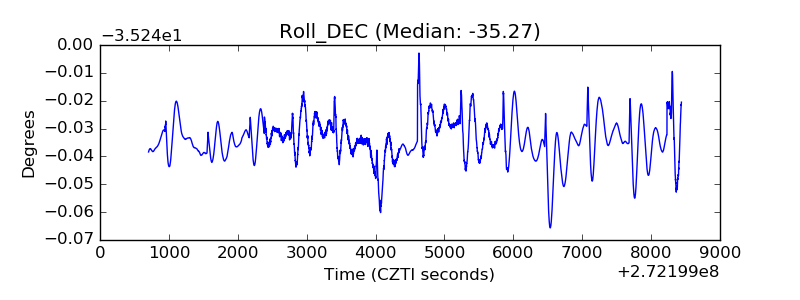 |
| _Roll_RA | 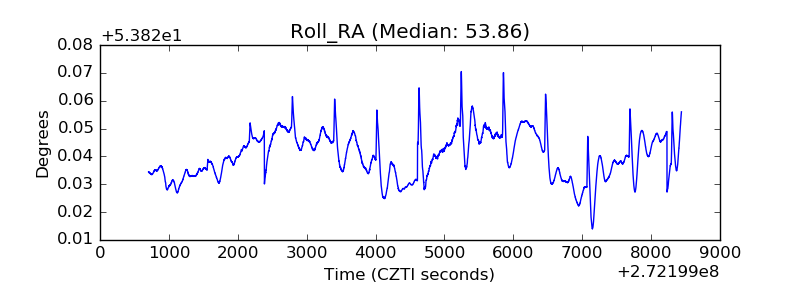 |
| Veto Counter | 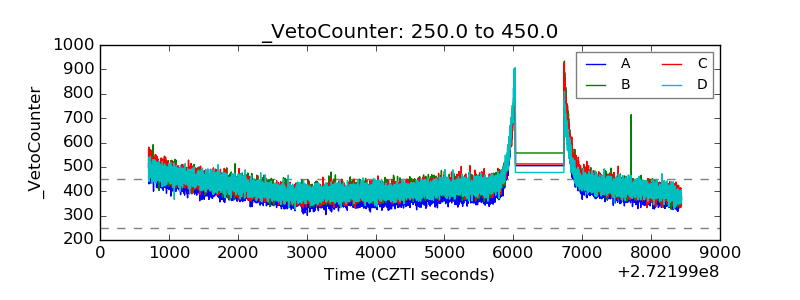 |