| Param | Original file | Final file |
|---|---|---|
| Filename | modeM0/AS1A04_037T01_9000002312_15607cztM0_level2.evt | modeM0/AS1A04_037T01_9000002312_15607cztM0_level2_quad_clean.evt |
| Size (bytes) | 512,841,600 | 79,957,440 |
| Size | 489.1 MB | 76.3 MB |
| Events in quadrant A | 3,536,264 | 481,743 |
| Events in quadrant B | 4,095,077 | 488,987 |
| Events in quadrant C | 3,816,304 | 467,504 |
| Events in quadrant D | 3,579,932 | 466,473 |
| Mode SS | |||
|---|---|---|---|
| Quadrant | BADHDUFLAG | Total packets | Discarded packets |
| A | 0 | 152 | 0 |
| B | 0 | 152 | 0 |
| C | 0 | 152 | 0 |
| D | 0 | 152 | 0 |
| Mode M0 | |||
|---|---|---|---|
| Quadrant | BADHDUFLAG | Total packets | Discarded packets |
| A | 0 | 15344 | 2 |
| B | 0 | 16703 | 1 |
| C | 0 | 15946 | 1 |
| D | 0 | 15694 | 1 |
| Mode M9 | |||
|---|---|---|---|
| Quadrant | BADHDUFLAG | Total packets | Discarded packets |
| A | 0 | 3 | 0 |
| B | 0 | 3 | 0 |
| C | 0 | 3 | 0 |
| D | 0 | 3 | 0 |
| Quadrant | Total seconds | Saturated seconds | Saturation percentage |
|---|---|---|---|
| A | 7411 | 149 | 2.010525% |
| B | 7411 | 178 | 2.401835% |
| C | 7411 | 203 | 2.739172% |
| D | 7411 | 101 | 1.362839% |
Noise dominated data is calculated using 1-second bins in cleaned event files. If a bin has >2000 counts, and if more than 50% of those come from <1% of pixels, then it is considered to be noise-dominated and hence unusable.
| Quadrant | # 1 sec bins | Bins with >0 counts | Bins with >2000 counts | High rate bins dominated by noise | Noise dominated (total time) | Noise dominated (detector-on time) | Marked lightcurve |
|---|---|---|---|---|---|---|---|
| A | 7732 | 7412 | 0 | 0 | 0.00% | 0.00% | 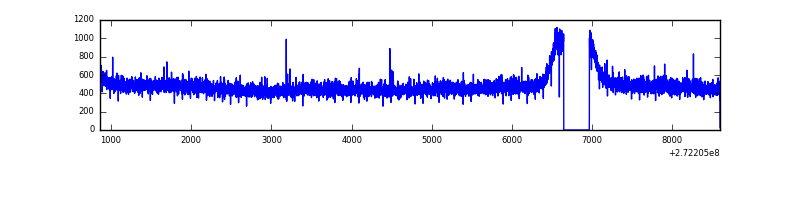 |
| B | 7732 | 7412 | 3 | 3 | 0.04% | 0.04% | 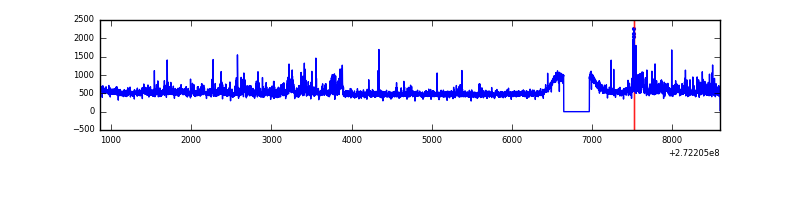 |
| C | 7732 | 7412 | 33 | 33 | 0.43% | 0.45% | 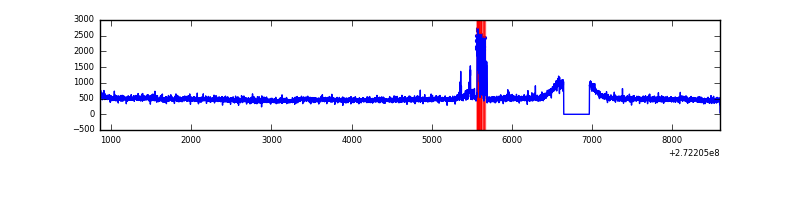 |
| D | 7732 | 7412 | 8 | 8 | 0.10% | 0.11% | 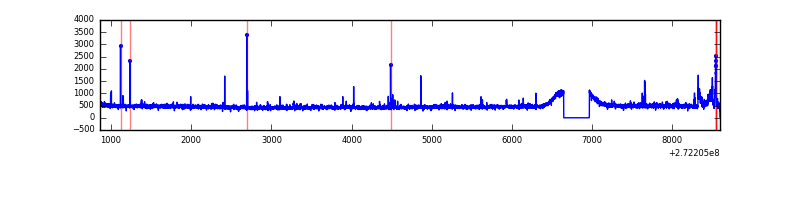 |
Top three noisy pixels from each quadrant. If the there are fewer than three noisy pixels in the level2.evt file, extra rows are filled as -1
| Pixel properties | Quadrant properties | ||||||
|---|---|---|---|---|---|---|---|
| Quadrant | DetID | PixID | Counts | Sigma | Mean | Median | Sigma |
| A | 0 | 226 | 8337 | 39.89 | 916 | 896 | 186.6 |
| A | 12 | 194 | 7028 | 32.87 | 916 | 896 | 186.6 |
| A | 9 | 143 | 6713 | 31.18 | 916 | 896 | 186.6 |
| B | 4 | 251 | 414722 | 2348.28 | 907 | 882 | 176.2 |
| B | 0 | 189 | 61535 | 344.17 | 907 | 882 | 176.2 |
| B | 3 | 209 | 21616 | 117.65 | 907 | 882 | 176.2 |
| C | 3 | 233 | 229797 | 1115.4 | 874 | 880 | 205.2 |
| C | 14 | 238 | 133761 | 647.46 | 874 | 880 | 205.2 |
| C | 7 | 247 | 35690 | 169.61 | 874 | 880 | 205.2 |
| D | 12 | 110 | 94761 | 421.64 | 899 | 872 | 222.7 |
| D | 2 | 234 | 34915 | 152.88 | 899 | 872 | 222.7 |
| D | 15 | 145 | 23669 | 102.38 | 899 | 872 | 222.7 |
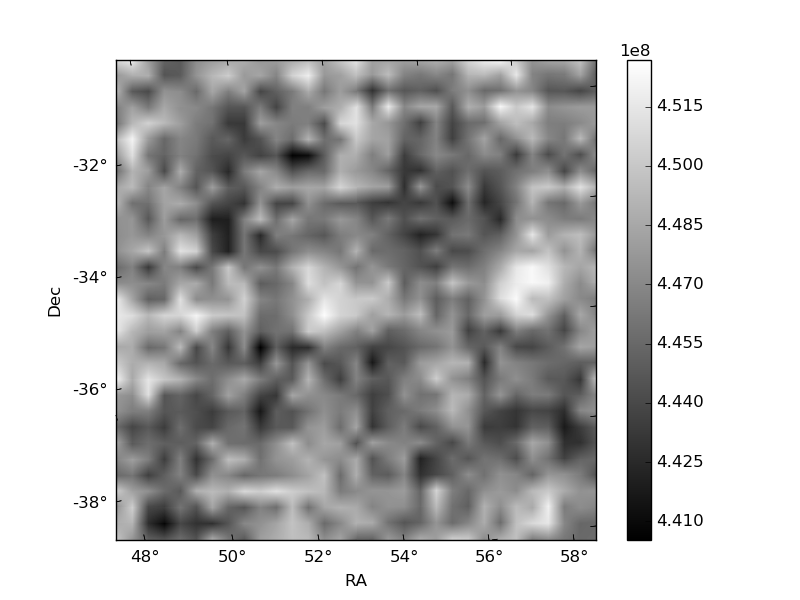
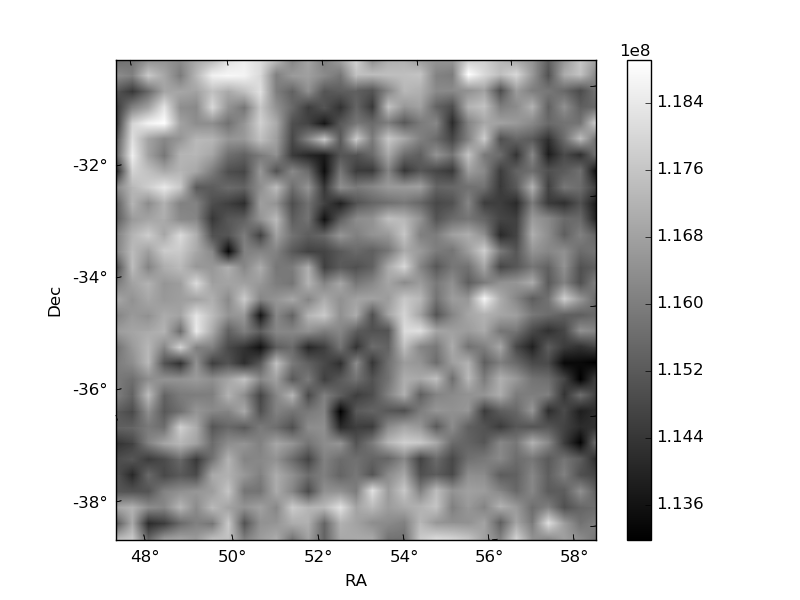
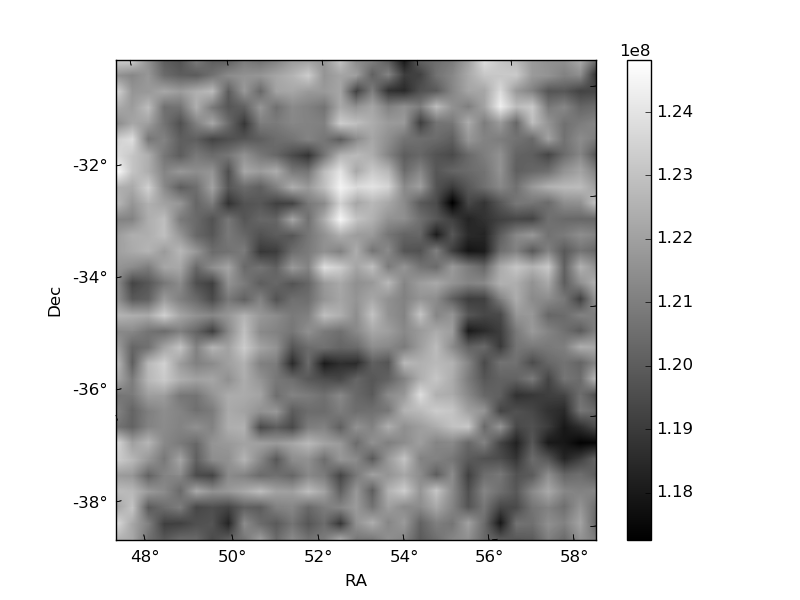
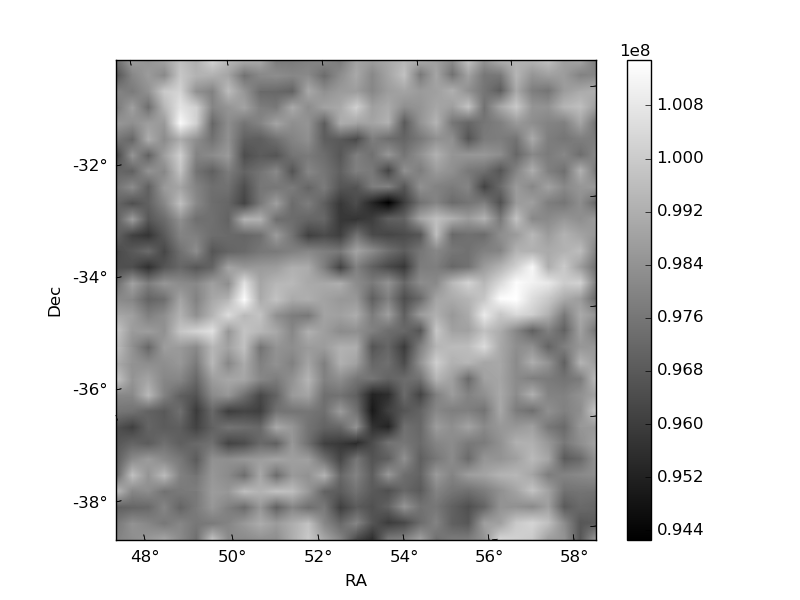
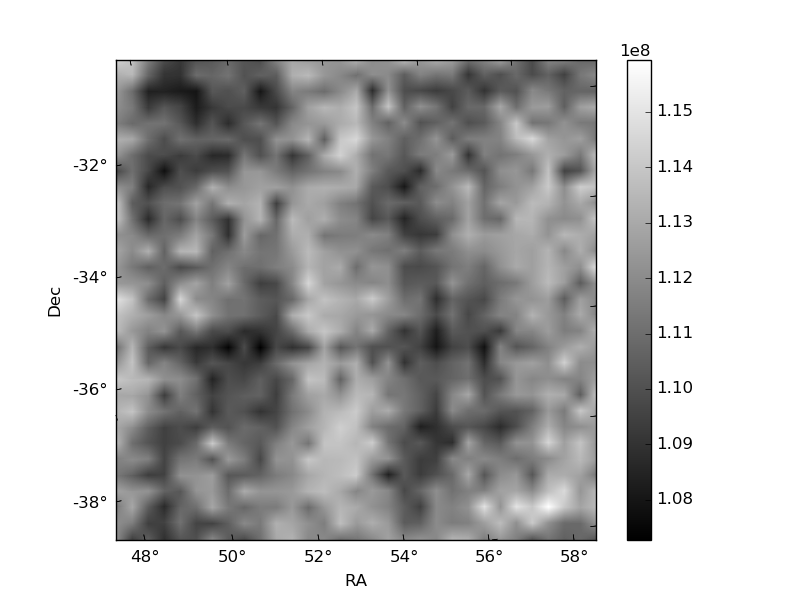
Histogram calculated using DETX and DETY for each event in the final _common_clean file
| Quadrant A |  |
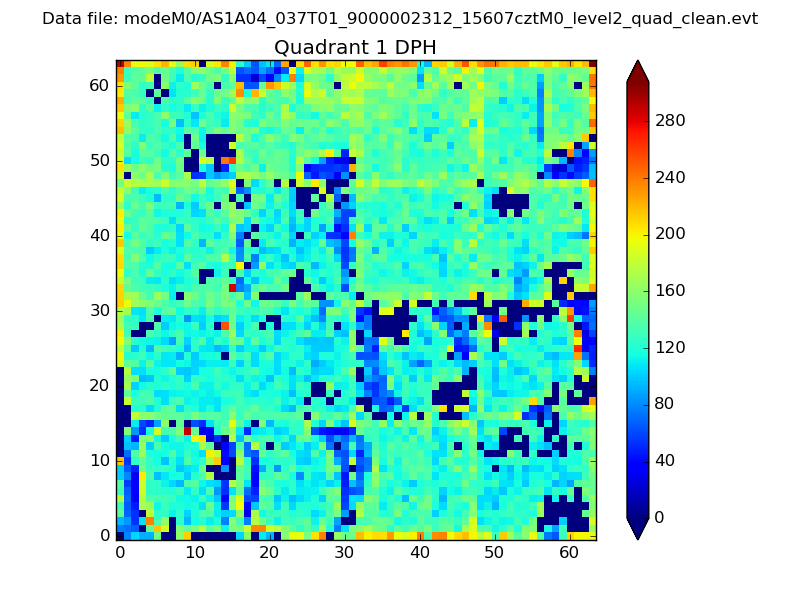 |
Quadrant B |
|---|---|---|---|
| Quadrant D | 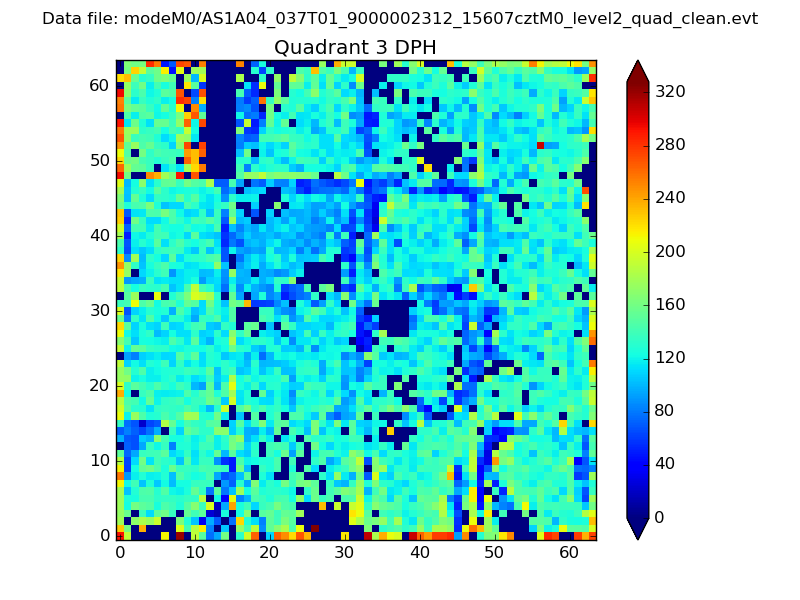 |
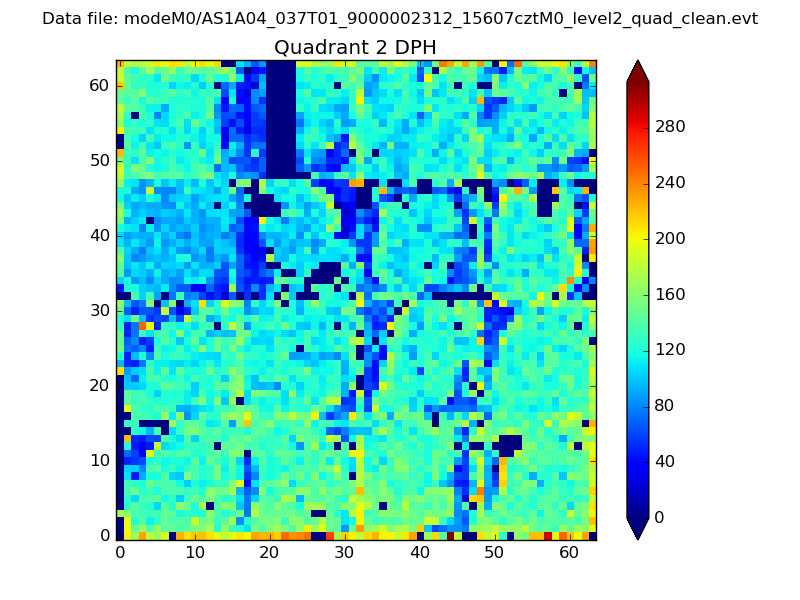 |
Quadrant C |
| Plot type | Count rate plots | Images |
|---|---|---|
| Comparison with Poisson distribution Blue bars denote a histogram of data divided into 1 sec bins. Red curve is a Poisson curve with rate = median count rate of data. |
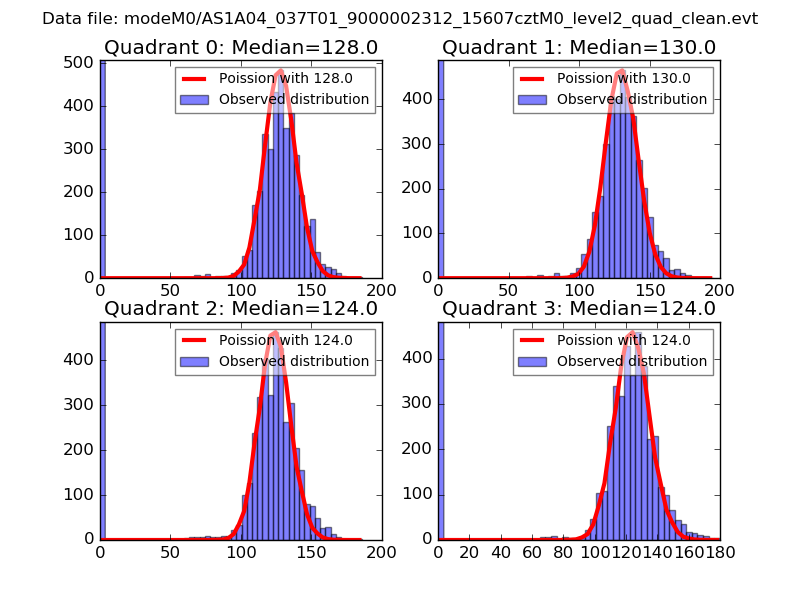 |
 |
| Quadrant-wise count rates Data is divided into 100 sec bins |
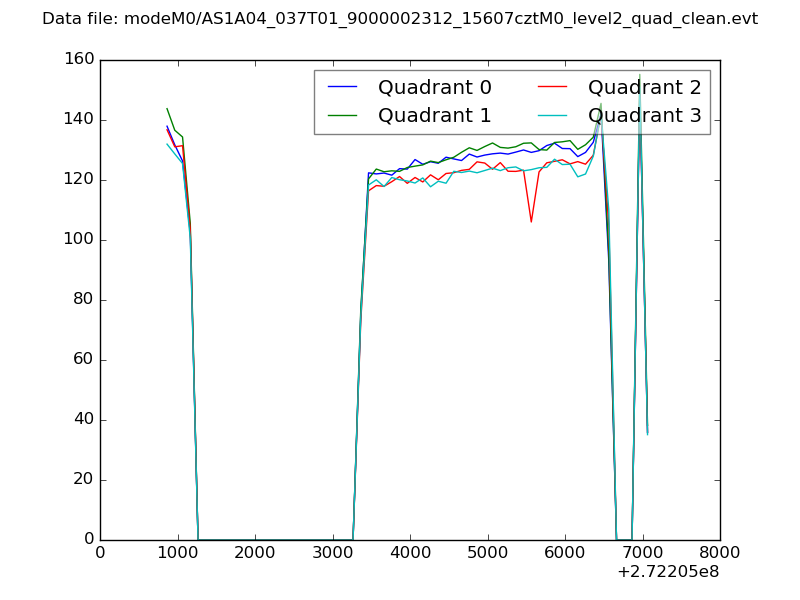 |
|
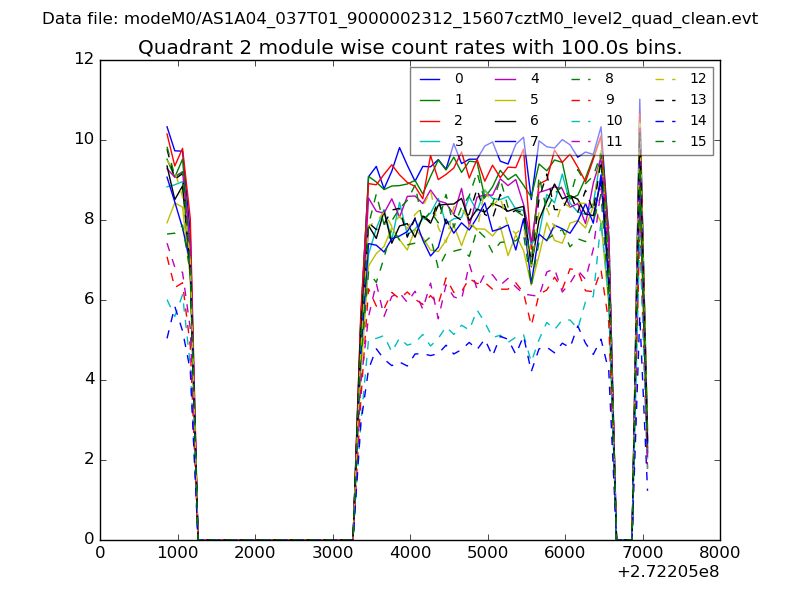
| Module-wise count rates for Quadrant A Data is divided into 100 sec bins |
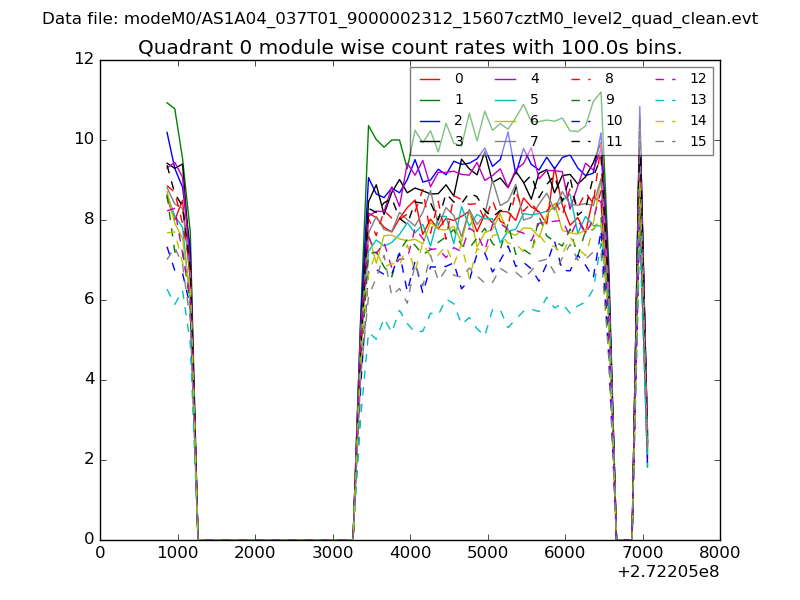 |
 |
| Module-wise count rates for Quadrant B Data is divided into 100 sec bins |
 |
 |
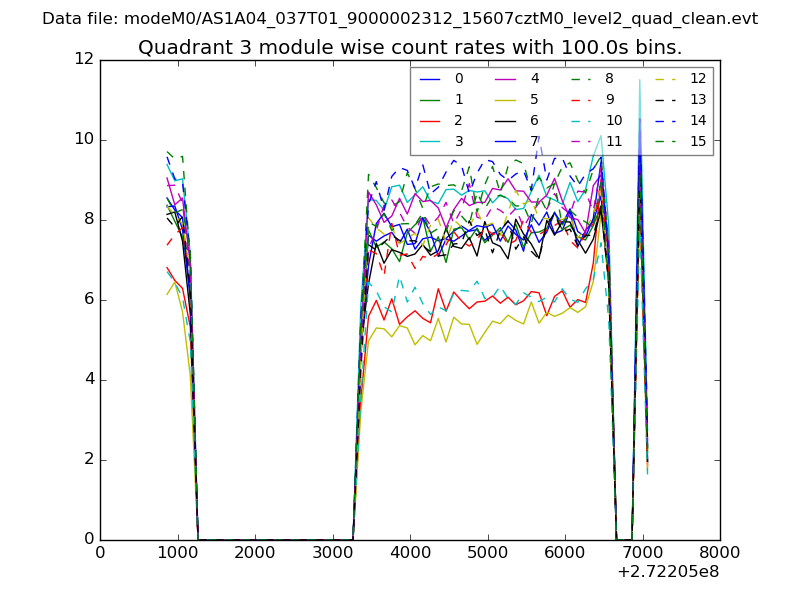
| Module-wise count rates for Quadrant C Data is divided into 100 sec bins |
 |
 |
| Module-wise count rates for Quadrant D Data is divided into 100 sec bins |
 |
 |
| Parameter | Plot |
|---|---|
| CZT HV Monitor | 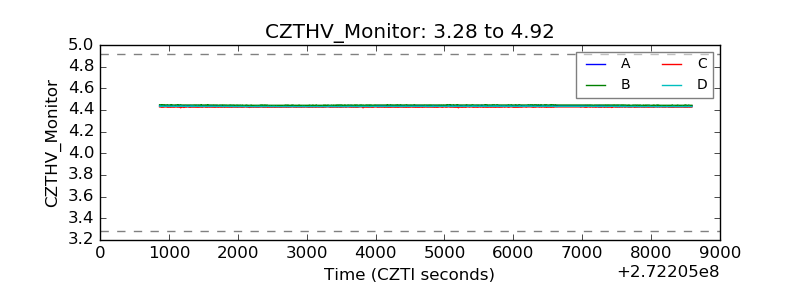 |
| D_VDD | 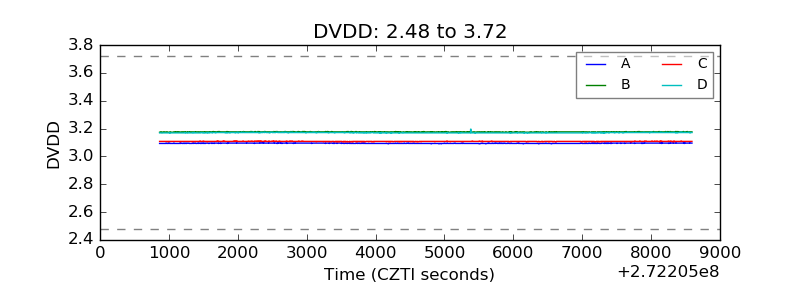 |
| Temperature 1 | 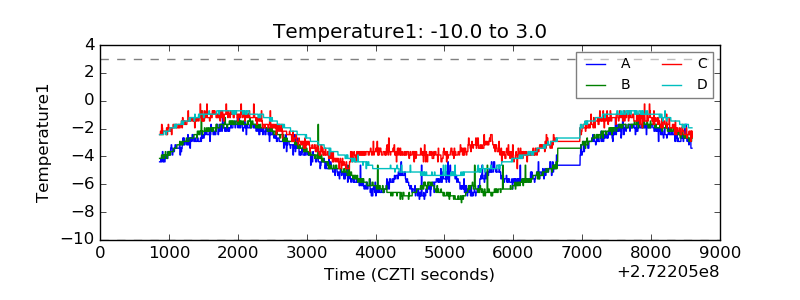 |
| Veto HV Monitor | 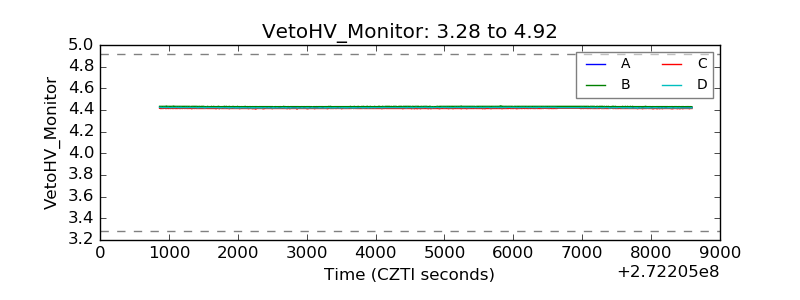 |
| Veto LLD | 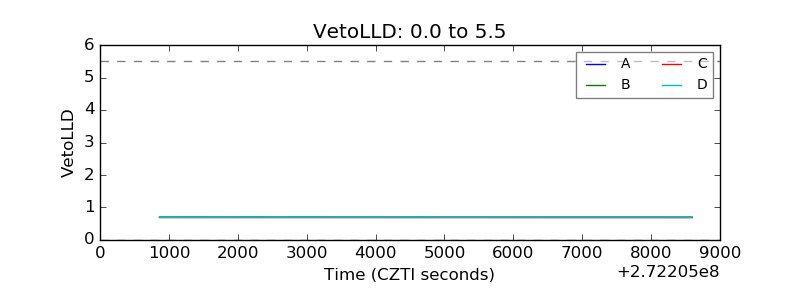 |
| Alpha Counter | 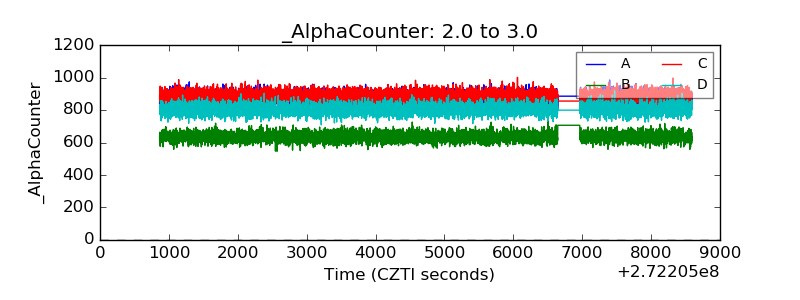 |
| _CPM_Rate | 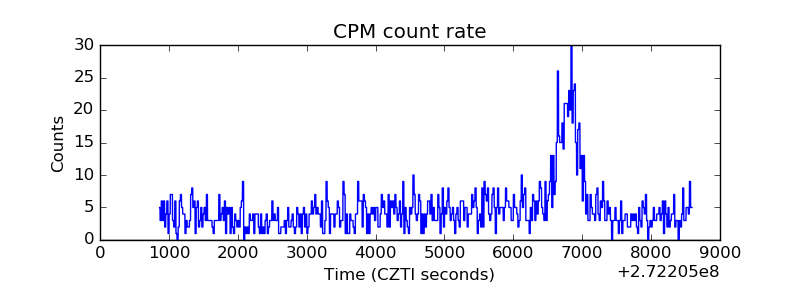 |
| CZT Counter | 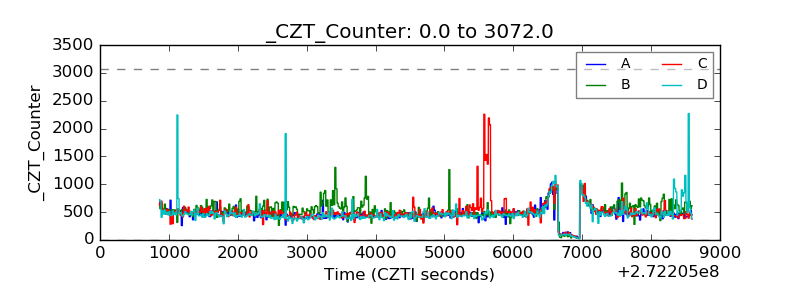 |
| +2.5 Volts monitor |  |
| +5 Volts monitor |  |
| _ROLL_ROT |  |
| _Roll_DEC | 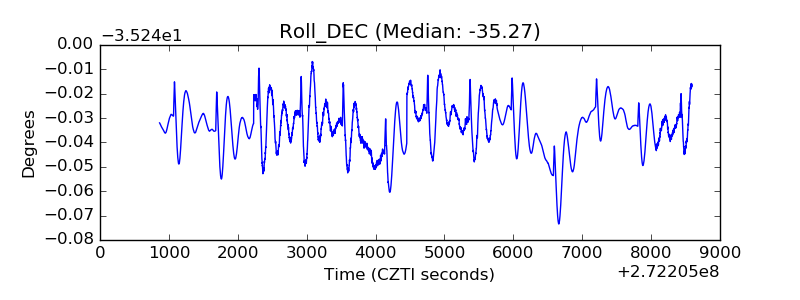 |
| _Roll_RA | 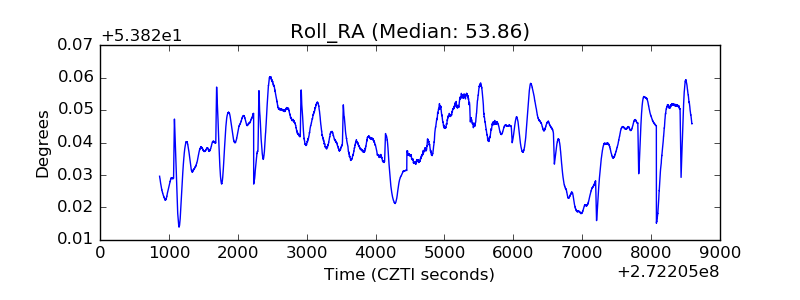 |
| Veto Counter | 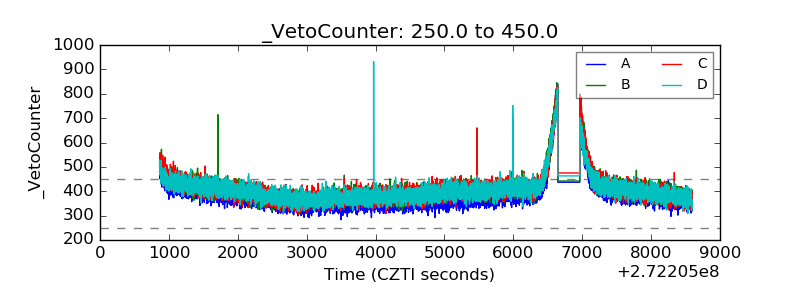 |