| Param | Original file | Final file |
|---|---|---|
| Filename | modeM0/AS1A04_037T01_9000002312_15609cztM0_level2.evt | modeM0/AS1A04_037T01_9000002312_15609cztM0_level2_quad_clean.evt |
| Size (bytes) | 205,813,440 | 22,708,800 |
| Size | 196.3 MB | 21.7 MB |
| Events in quadrant A | 1,447,717 | 121,539 |
| Events in quadrant B | 1,702,450 | 120,851 |
| Events in quadrant C | 1,439,423 | 117,241 |
| Events in quadrant D | 1,440,491 | 116,548 |
| Mode SS | |||
|---|---|---|---|
| Quadrant | BADHDUFLAG | Total packets | Discarded packets |
| A | 0 | 62 | 0 |
| B | 0 | 62 | 0 |
| C | 0 | 62 | 0 |
| D | 0 | 62 | 0 |
| Mode M0 | |||
|---|---|---|---|
| Quadrant | BADHDUFLAG | Total packets | Discarded packets |
| A | 0 | 6291 | 1 |
| B | 0 | 6925 | 1 |
| C | 0 | 6284 | 1 |
| D | 0 | 6358 | 1 |
| Mode M9 | |||
|---|---|---|---|
| Quadrant | BADHDUFLAG | Total packets | Discarded packets |
| A | 0 | 2 | 0 |
| B | 0 | 2 | 0 |
| C | 0 | 2 | 0 |
| D | 0 | 2 | 0 |
| Quadrant | Total seconds | Saturated seconds | Saturation percentage |
|---|---|---|---|
| A | 2951 | 108 | 3.659776% |
| B | 2951 | 122 | 4.134192% |
| C | 2951 | 121 | 4.100305% |
| D | 2951 | 67 | 2.270417% |
Noise dominated data is calculated using 1-second bins in cleaned event files. If a bin has >2000 counts, and if more than 50% of those come from <1% of pixels, then it is considered to be noise-dominated and hence unusable.
| Quadrant | # 1 sec bins | Bins with >0 counts | Bins with >2000 counts | High rate bins dominated by noise | Noise dominated (total time) | Noise dominated (detector-on time) | Marked lightcurve |
|---|---|---|---|---|---|---|---|
| A | 3172 | 2952 | 0 | 0 | 0.00% | 0.00% | 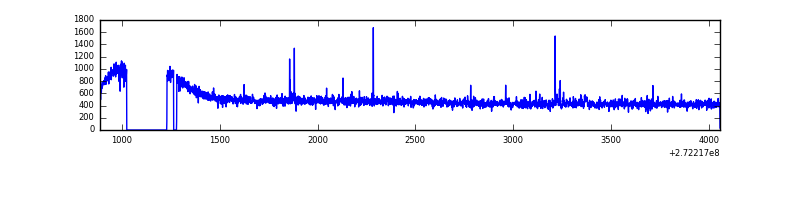 |
| B | 3172 | 2953 | 1 | 1 | 0.03% | 0.03% | 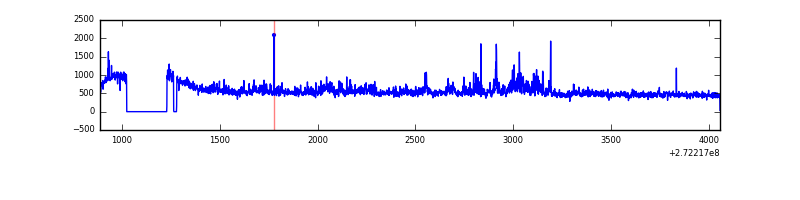 |
| C | 3172 | 2952 | 0 | 0 | 0.00% | 0.00% | 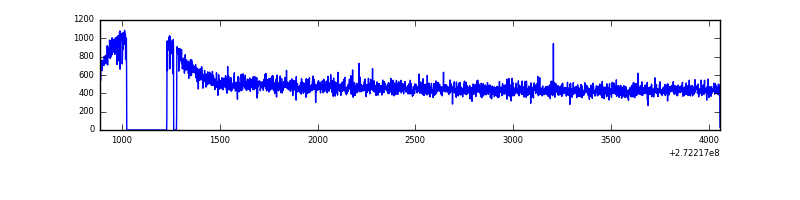 |
| D | 3172 | 2954 | 0 | 0 | 0.00% | 0.00% | 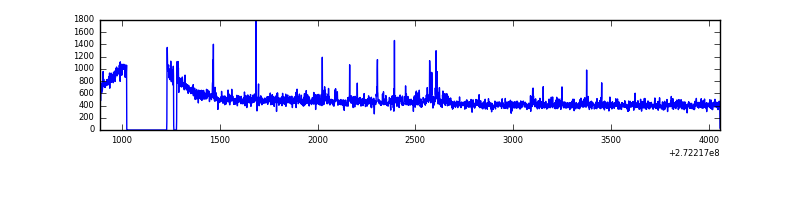 |
Top three noisy pixels from each quadrant. If the there are fewer than three noisy pixels in the level2.evt file, extra rows are filled as -1
| Pixel properties | Quadrant properties | ||||||
|---|---|---|---|---|---|---|---|
| Quadrant | DetID | PixID | Counts | Sigma | Mean | Median | Sigma |
| A | 15 | 239 | 7390 | 91.02 | 370 | 361 | 77.2 |
| A | 13 | 248 | 6838 | 83.88 | 370 | 361 | 77.2 |
| A | 9 | 143 | 3668 | 42.82 | 370 | 361 | 77.2 |
| B | 4 | 251 | 186296 | 2536.68 | 366 | 357 | 73.3 |
| B | 0 | 197 | 25261 | 339.75 | 366 | 357 | 73.3 |
| B | 4 | 216 | 24903 | 334.87 | 366 | 357 | 73.3 |
| C | 14 | 238 | 53417 | 623.84 | 350 | 351 | 85.1 |
| C | 7 | 247 | 14425 | 165.45 | 350 | 351 | 85.1 |
| C | 3 | 233 | 4666 | 50.73 | 350 | 351 | 85.1 |
| D | 2 | 152 | 37397 | 411.72 | 359 | 348 | 90.0 |
| D | 5 | 51 | 18090 | 197.17 | 359 | 348 | 90.0 |
| D | 2 | 234 | 14265 | 154.66 | 359 | 348 | 90.0 |
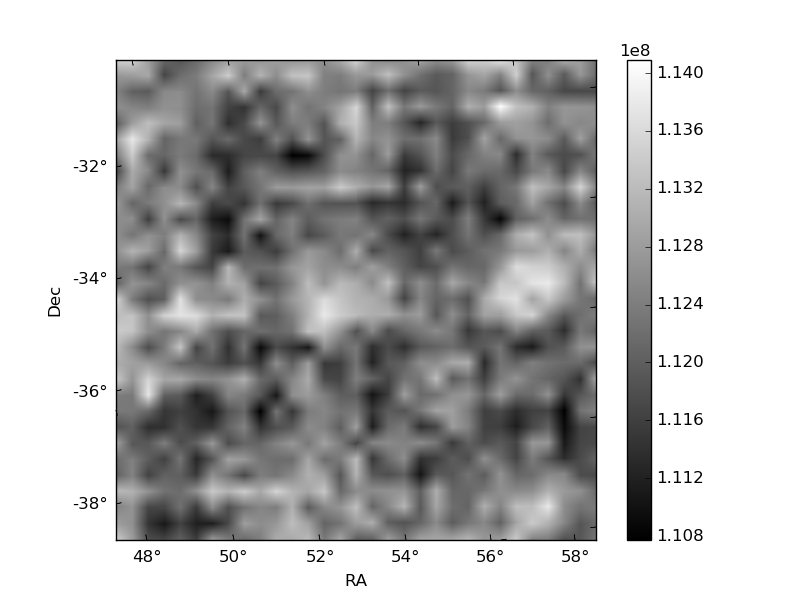
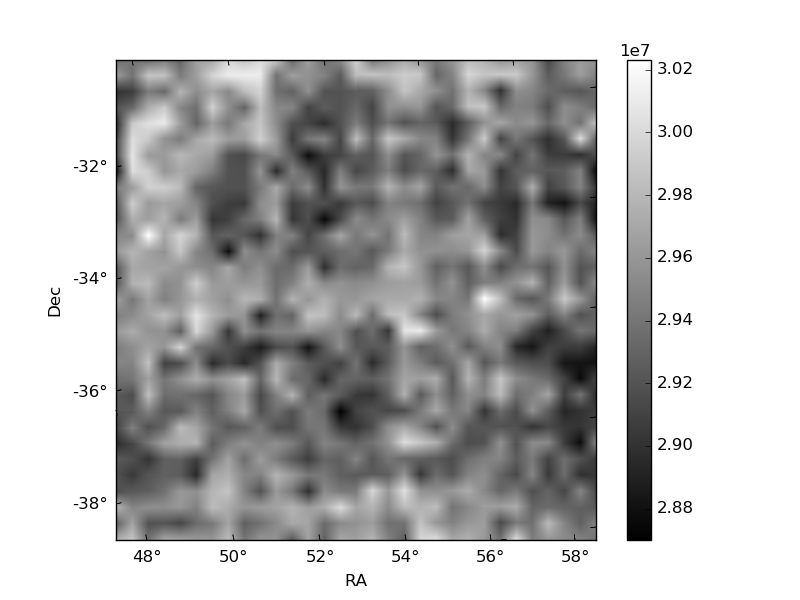
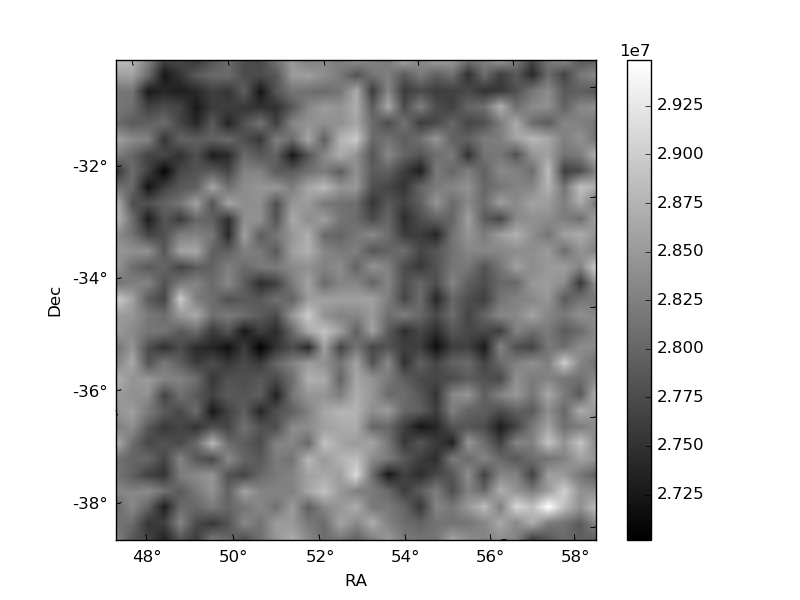
Histogram calculated using DETX and DETY for each event in the final _common_clean file
| Quadrant A |  |
 |
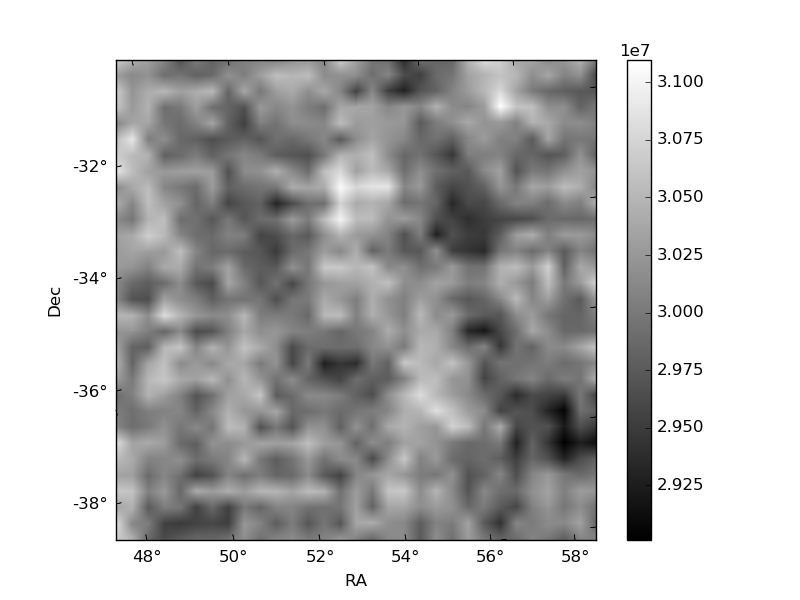
Quadrant B |
|---|---|---|---|
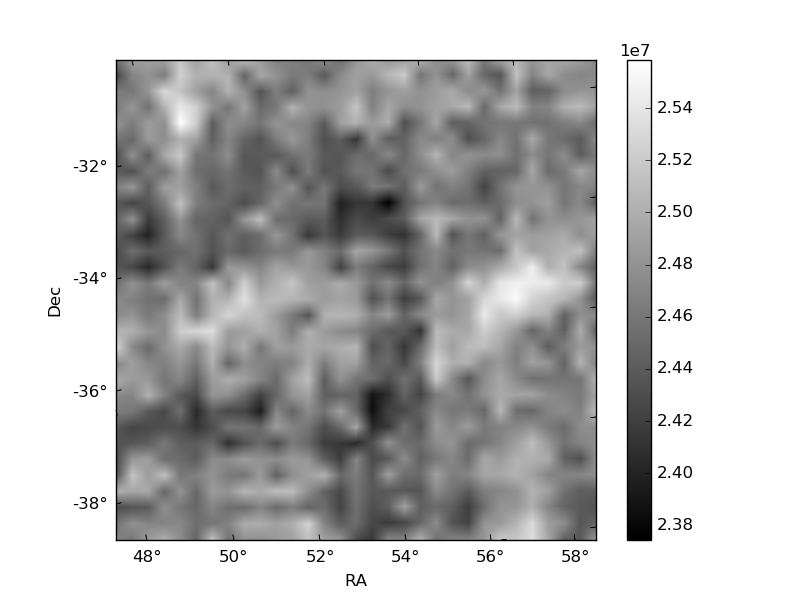
| Quadrant D |  |
 |
Quadrant C |
| Plot type | Count rate plots | Images |
|---|---|---|
| Comparison with Poisson distribution Blue bars denote a histogram of data divided into 1 sec bins. Red curve is a Poisson curve with rate = median count rate of data. |
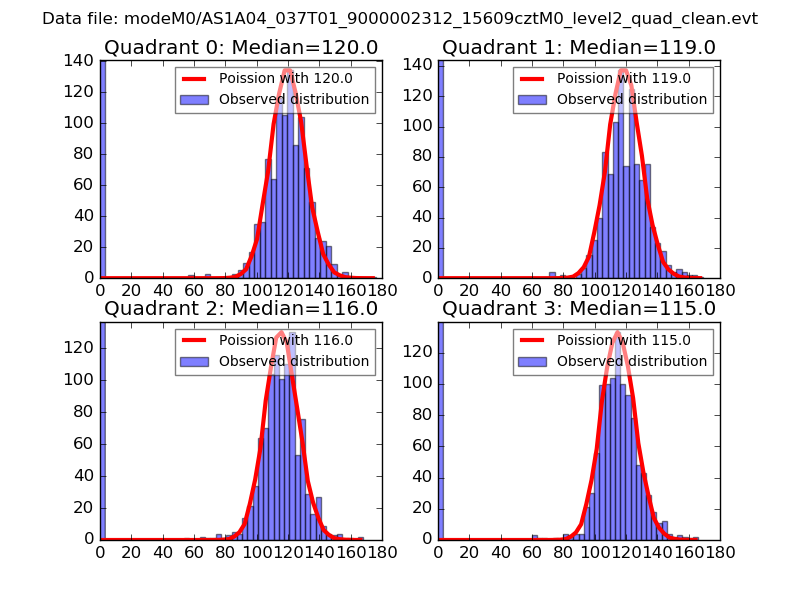 |
 |
| Quadrant-wise count rates Data is divided into 100 sec bins |
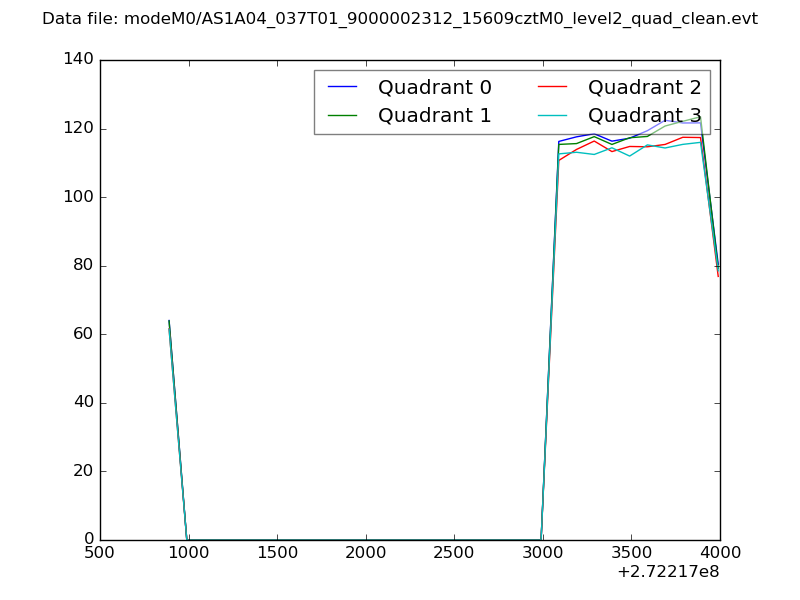 |
|
| Module-wise count rates for Quadrant A Data is divided into 100 sec bins |
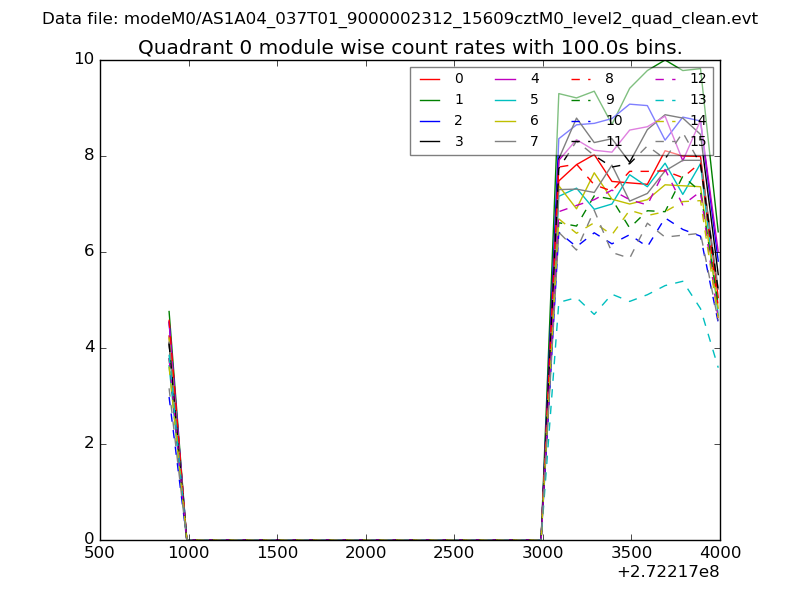 |
 |
| Module-wise count rates for Quadrant B Data is divided into 100 sec bins |
 |
 |
| Module-wise count rates for Quadrant C Data is divided into 100 sec bins |
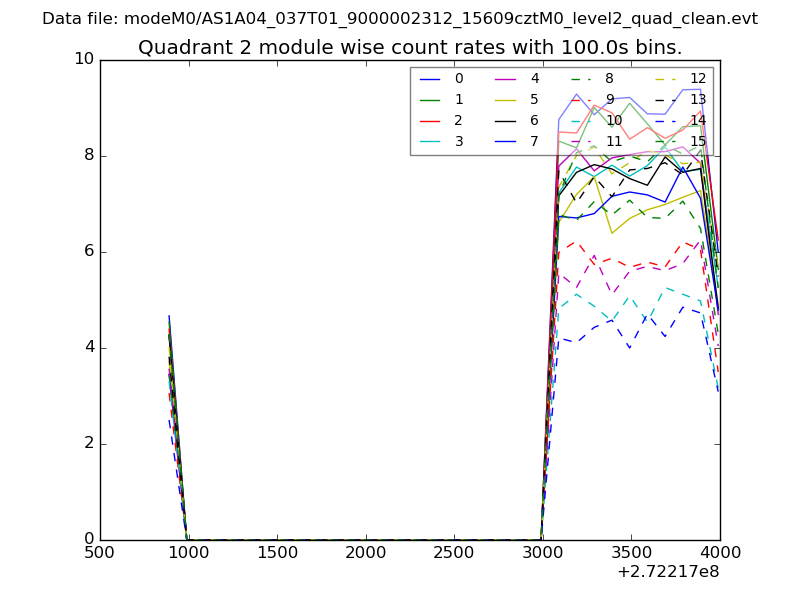 |
 |
| Module-wise count rates for Quadrant D Data is divided into 100 sec bins |
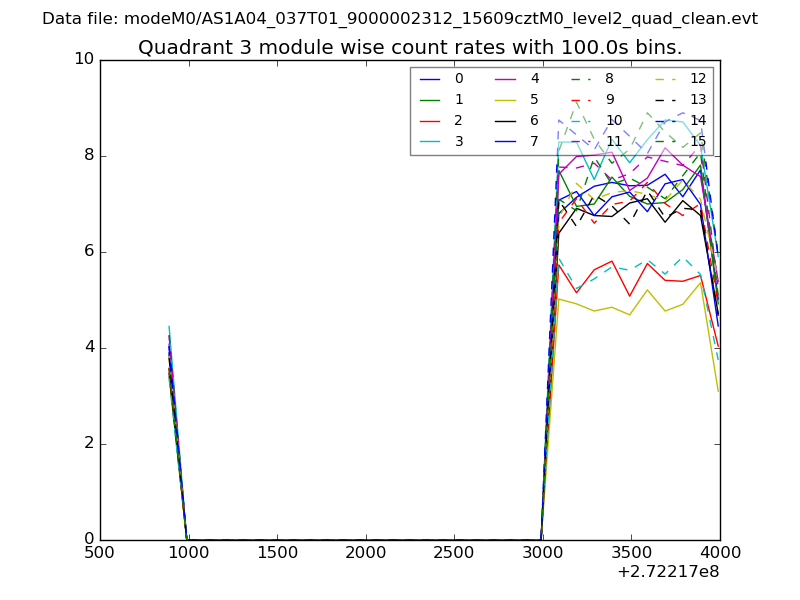 |
 |
| Parameter | Plot |
|---|---|
| CZT HV Monitor | 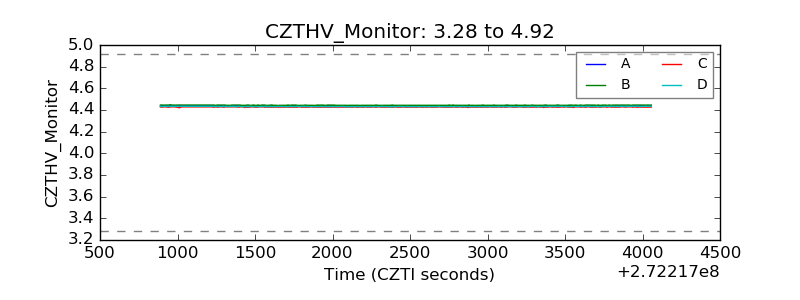 |
| D_VDD | 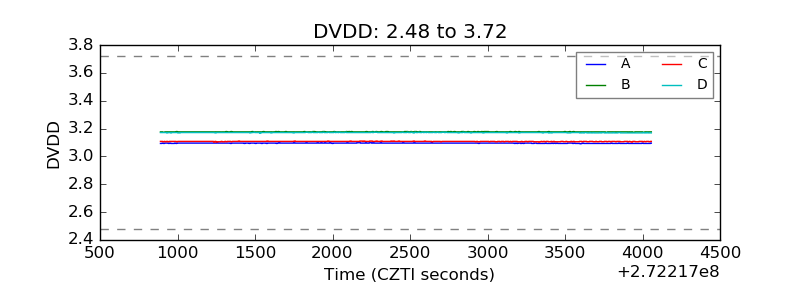 |
| Temperature 1 | 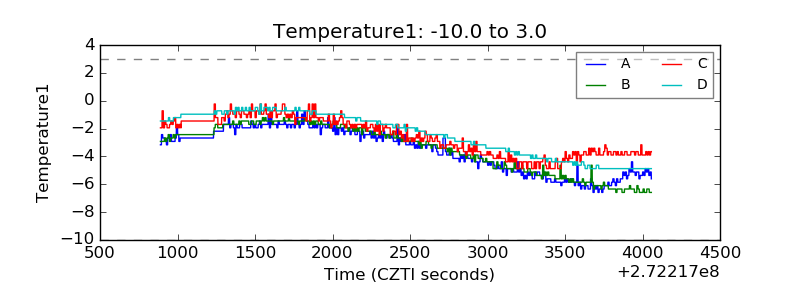 |
| Veto HV Monitor | 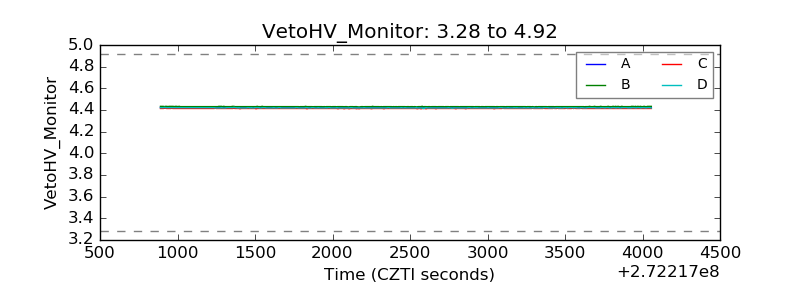 |
| Veto LLD | 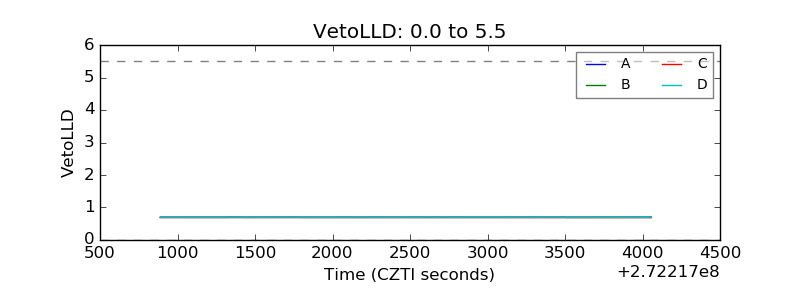 |
| Alpha Counter | 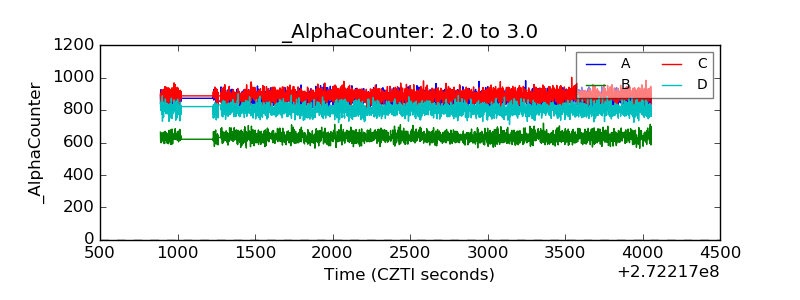 |
| _CPM_Rate | 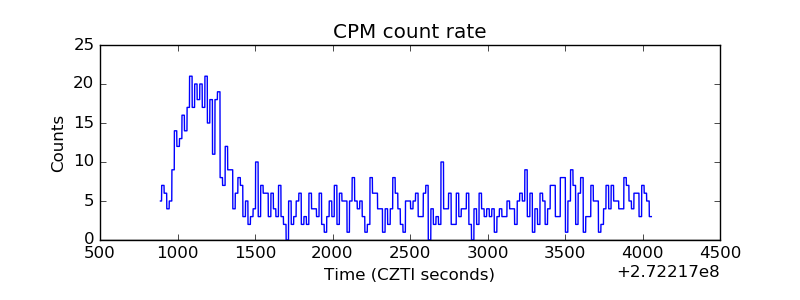 |
| CZT Counter | 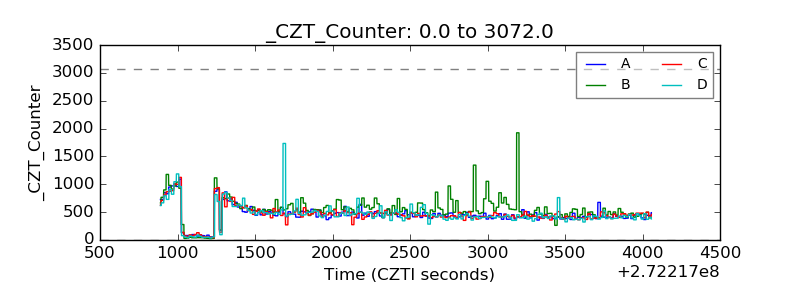 |
| +2.5 Volts monitor |  |
| +5 Volts monitor | 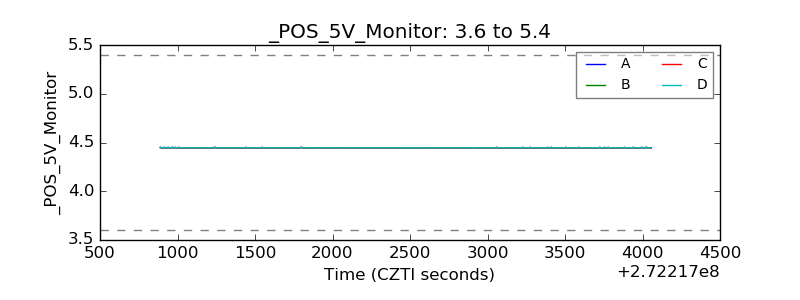 |
| _ROLL_ROT | 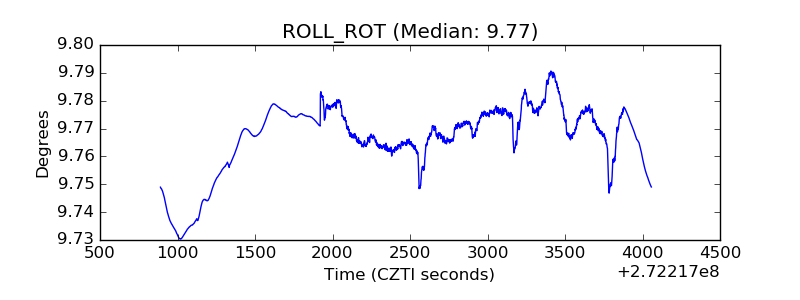 |
| _Roll_DEC | 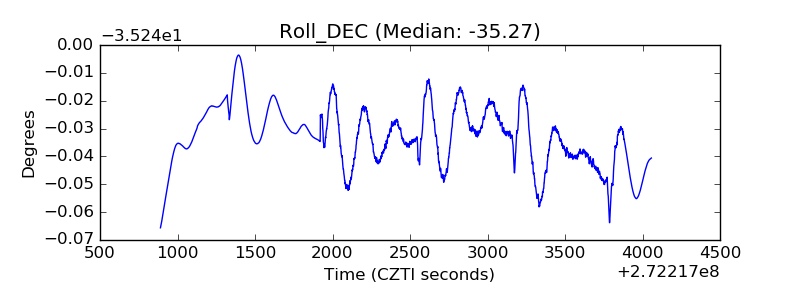 |
| _Roll_RA | 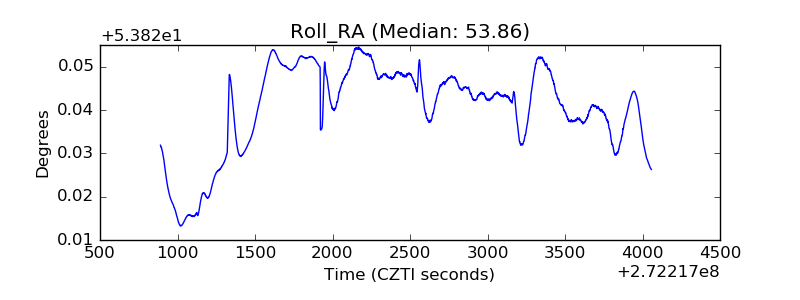 |
| Veto Counter | 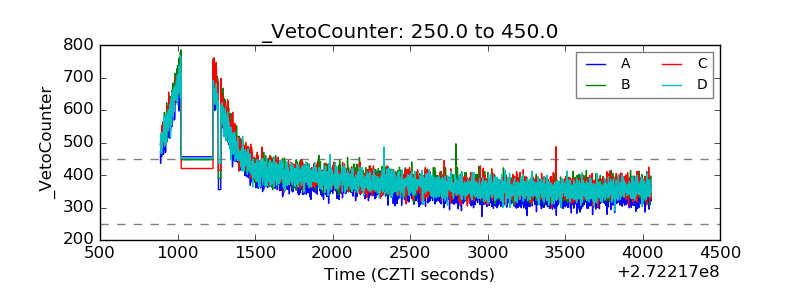 |