| Param | Original file | Final file |
|---|---|---|
| Filename | modeM0/AS1G08_031T01_9000002314_15609cztM0_level2.evt | modeM0/AS1G08_031T01_9000002314_15609cztM0_level2_quad_clean.evt |
| Size (bytes) | 281,730,240 | 45,662,400 |
| Size | 268.7 MB | 43.5 MB |
| Events in quadrant A | 1,975,058 | 276,592 |
| Events in quadrant B | 2,275,375 | 279,199 |
| Events in quadrant C | 2,034,760 | 268,881 |
| Events in quadrant D | 1,965,683 | 267,164 |
| Mode M9 | |||
|---|---|---|---|
| Quadrant | BADHDUFLAG | Total packets | Discarded packets |
| A | 0 | 4 | 0 |
| B | 0 | 4 | 0 |
| C | 0 | 4 | 0 |
| D | 0 | 4 | 0 |
| Mode M0 | |||
|---|---|---|---|
| Quadrant | BADHDUFLAG | Total packets | Discarded packets |
| A | 0 | 8456 | 2 |
| B | 0 | 9404 | 1 |
| C | 0 | 8593 | 1 |
| D | 0 | 8554 | 1 |
| Mode SS | |||
|---|---|---|---|
| Quadrant | BADHDUFLAG | Total packets | Discarded packets |
| A | 0 | 84 | 0 |
| B | 0 | 84 | 0 |
| C | 0 | 84 | 0 |
| D | 0 | 84 | 0 |
| Quadrant | Total seconds | Saturated seconds | Saturation percentage |
|---|---|---|---|
| A | 4120 | 23 | 0.558252% |
| B | 4120 | 47 | 1.140777% |
| C | 4120 | 62 | 1.504854% |
| D | 4120 | 17 | 0.412621% |
Noise dominated data is calculated using 1-second bins in cleaned event files. If a bin has >2000 counts, and if more than 50% of those come from <1% of pixels, then it is considered to be noise-dominated and hence unusable.
| Quadrant | # 1 sec bins | Bins with >0 counts | Bins with >2000 counts | High rate bins dominated by noise | Noise dominated (total time) | Noise dominated (detector-on time) | Marked lightcurve |
|---|---|---|---|---|---|---|---|
| A | 4521 | 4122 | 0 | 0 | 0.00% | 0.00% | 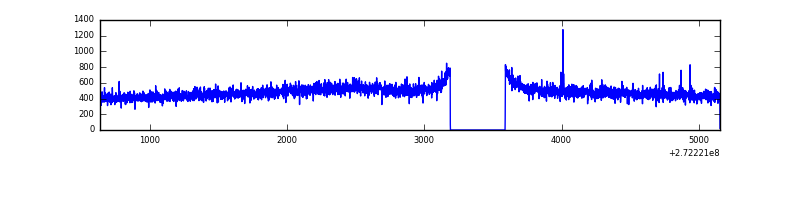 |
| B | 4521 | 4122 | 4 | 4 | 0.09% | 0.10% | 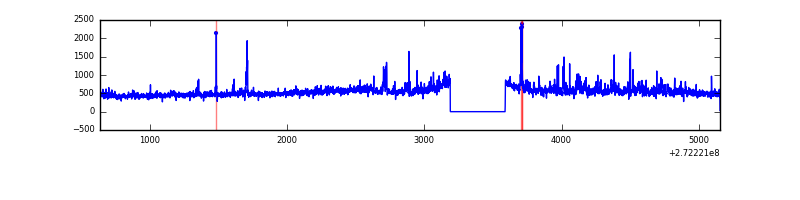 |
| C | 4521 | 4122 | 4 | 4 | 0.09% | 0.10% | 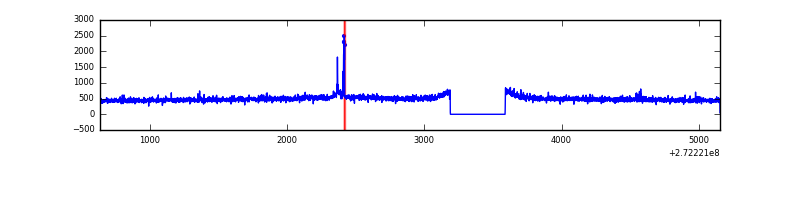 |
| D | 4521 | 4122 | 6 | 6 | 0.13% | 0.15% | 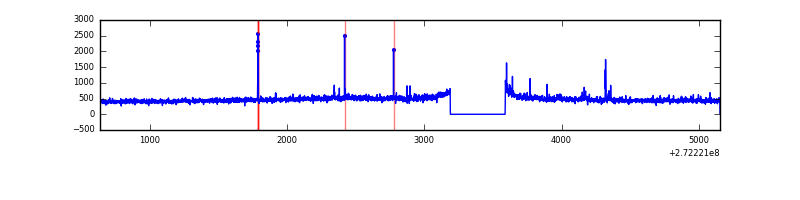 |
Top three noisy pixels from each quadrant. If the there are fewer than three noisy pixels in the level2.evt file, extra rows are filled as -1
| Pixel properties | Quadrant properties | ||||||
|---|---|---|---|---|---|---|---|
| Quadrant | DetID | PixID | Counts | Sigma | Mean | Median | Sigma |
| A | 0 | 226 | 4470 | 37.2 | 510 | 498 | 106.8 |
| A | 12 | 194 | 3919 | 32.04 | 510 | 498 | 106.8 |
| A | 9 | 143 | 3667 | 29.68 | 510 | 498 | 106.8 |
| B | 4 | 251 | 200866 | 2026.1 | 506 | 493 | 98.9 |
| B | 4 | 173 | 23679 | 234.45 | 506 | 493 | 98.9 |
| B | 0 | 189 | 18510 | 182.18 | 506 | 493 | 98.9 |
| C | 14 | 238 | 74649 | 637.39 | 486 | 488 | 116.4 |
| C | 10 | 22 | 33063 | 279.97 | 486 | 488 | 116.4 |
| C | 7 | 247 | 13877 | 115.07 | 486 | 488 | 116.4 |
| D | 2 | 152 | 33563 | 269.44 | 499 | 484 | 122.8 |
| D | 2 | 234 | 19227 | 152.67 | 499 | 484 | 122.8 |
| D | 2 | 120 | 13342 | 104.73 | 499 | 484 | 122.8 |
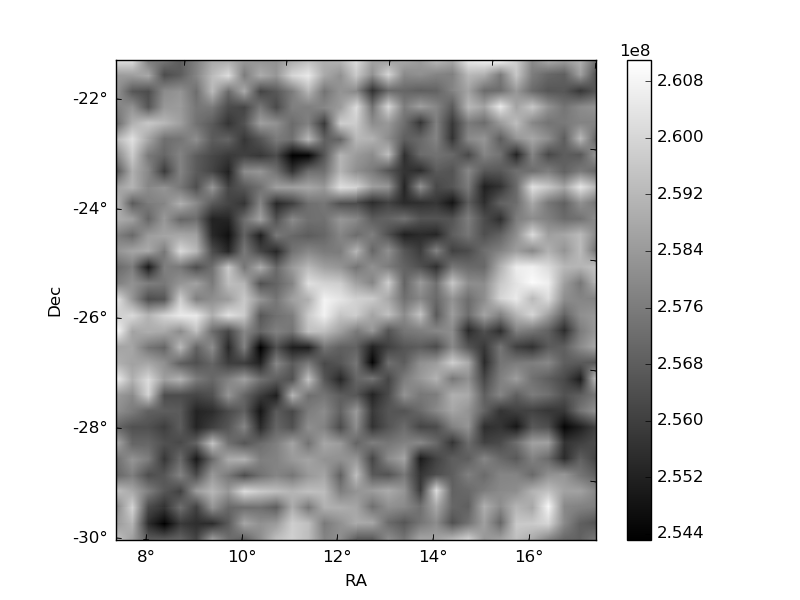
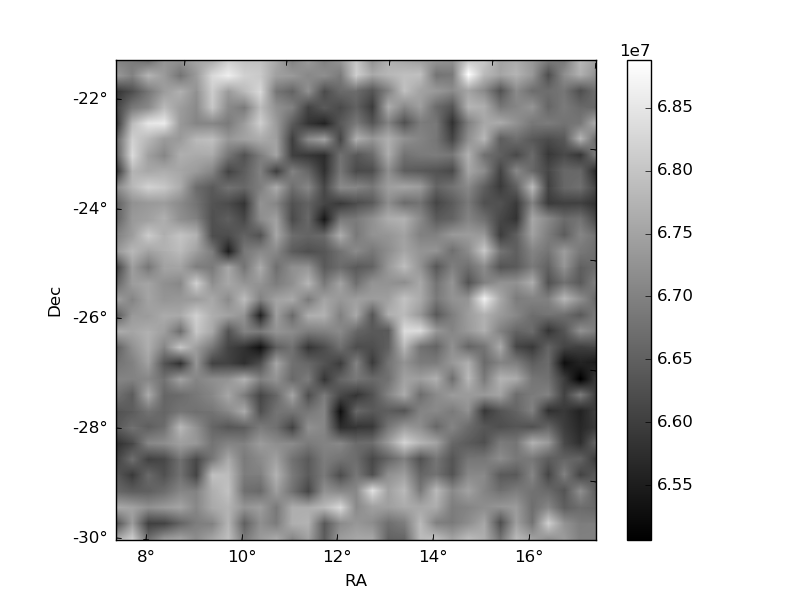
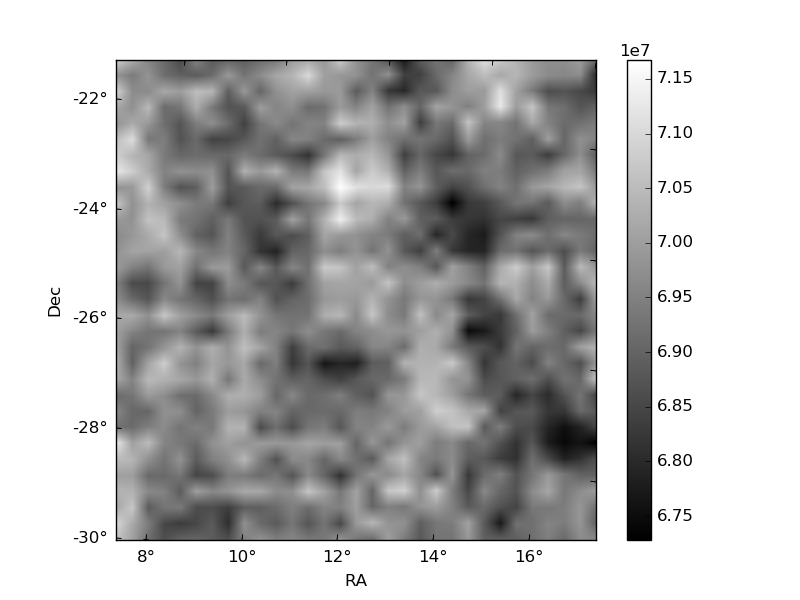
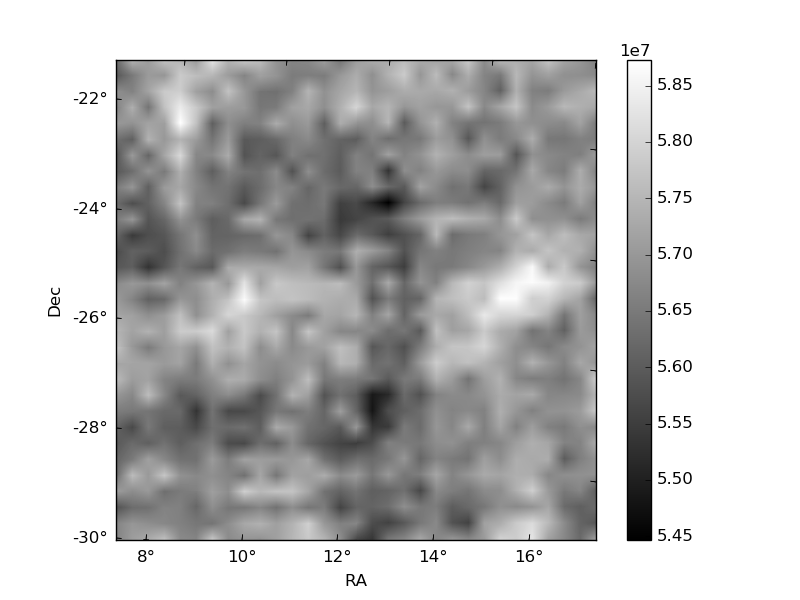
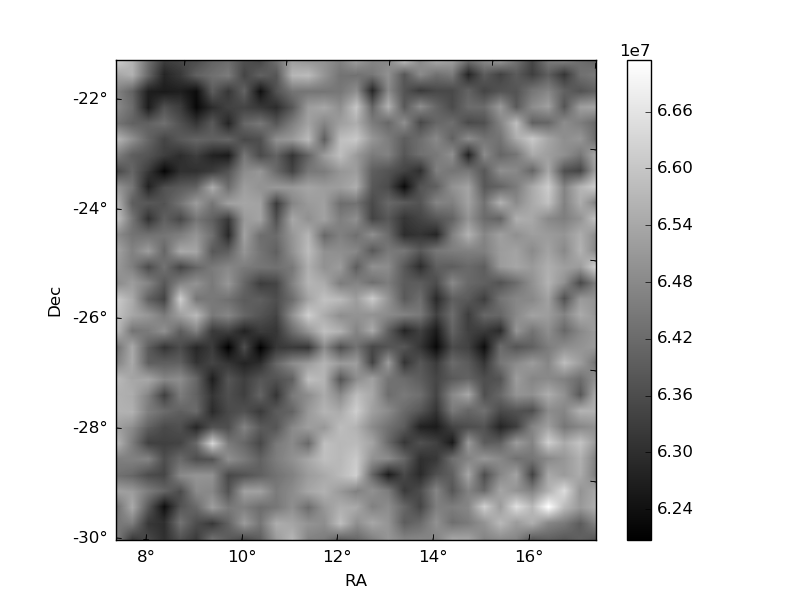
Histogram calculated using DETX and DETY for each event in the final _common_clean file
| Quadrant A | 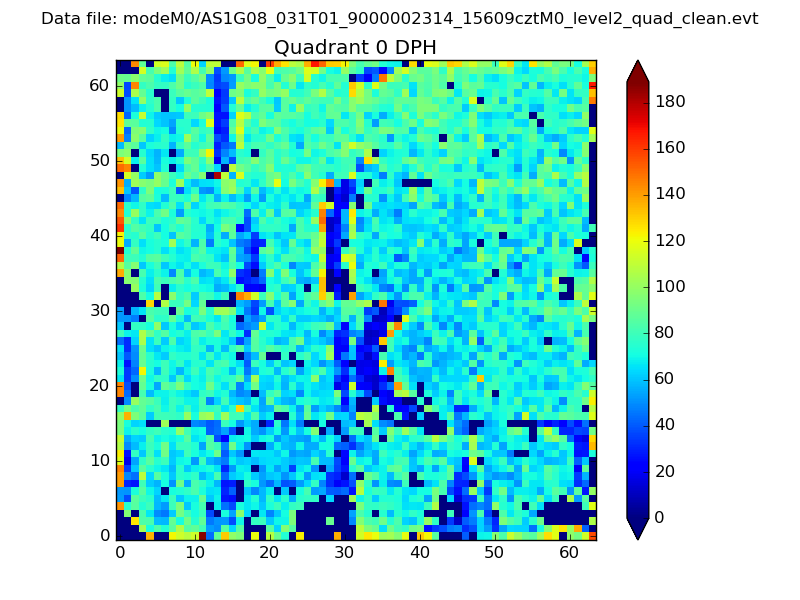 |
 |
Quadrant B |
|---|---|---|---|
| Quadrant D | 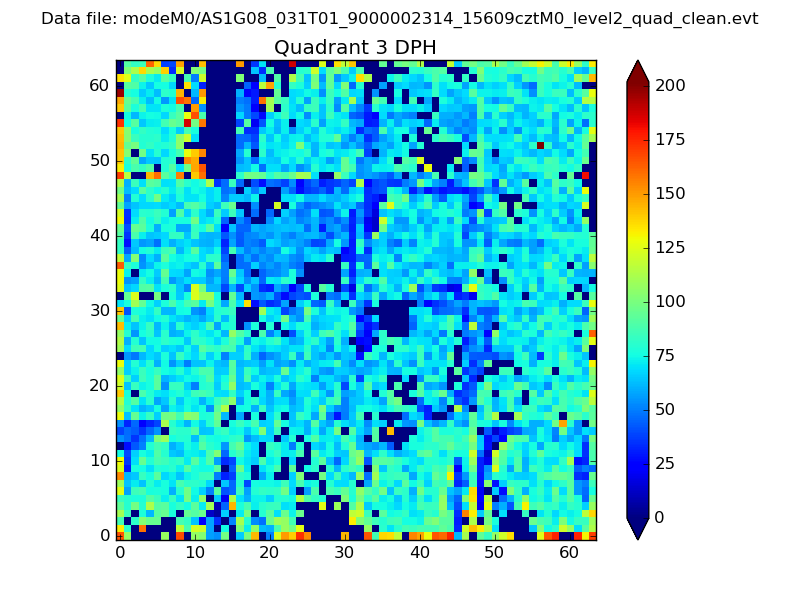 |
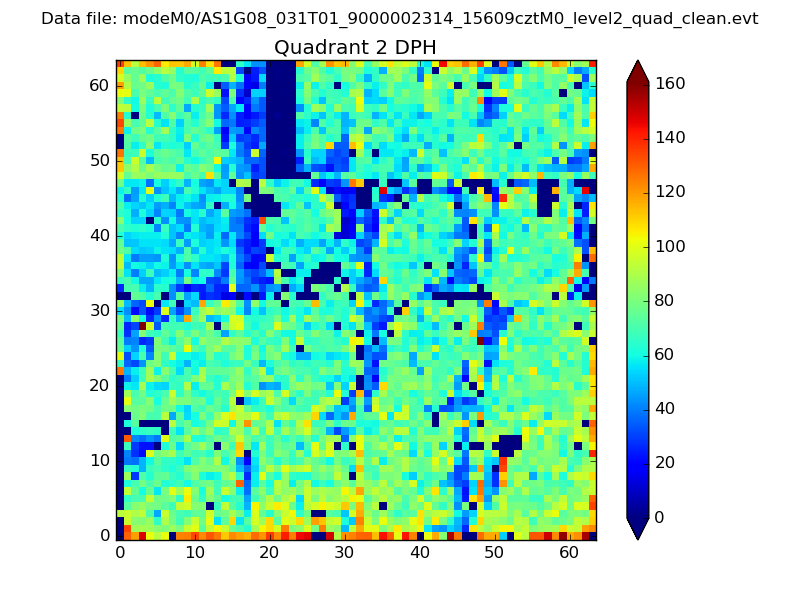 |
Quadrant C |
| Plot type | Count rate plots | Images |
|---|---|---|
| Comparison with Poisson distribution Blue bars denote a histogram of data divided into 1 sec bins. Red curve is a Poisson curve with rate = median count rate of data. |
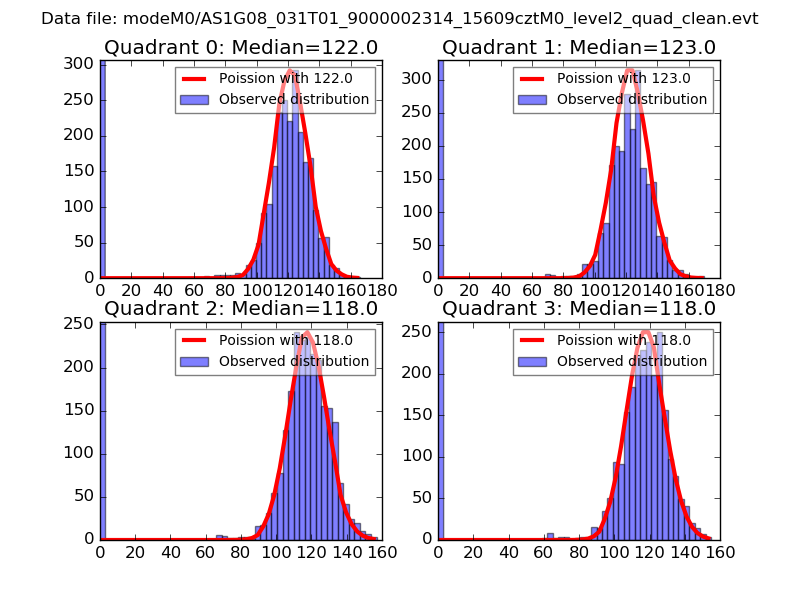 |
 |
| Quadrant-wise count rates Data is divided into 100 sec bins |
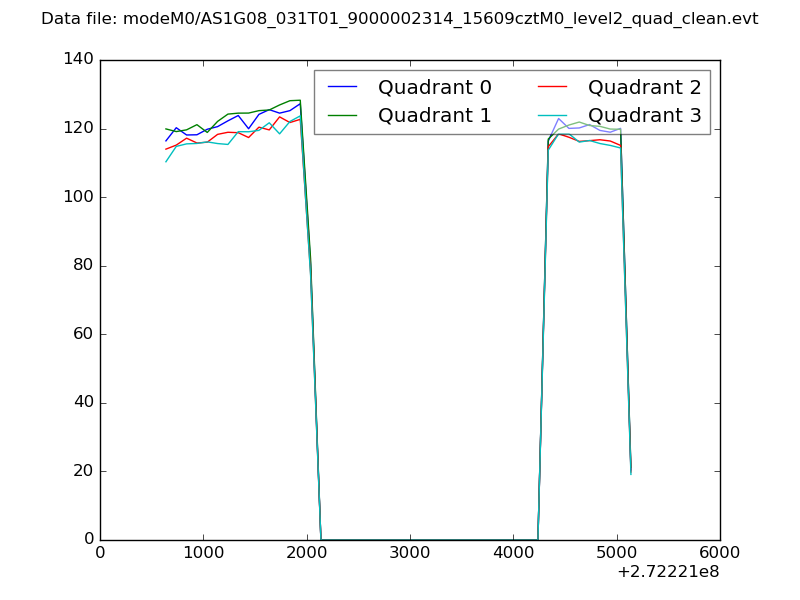 |
|
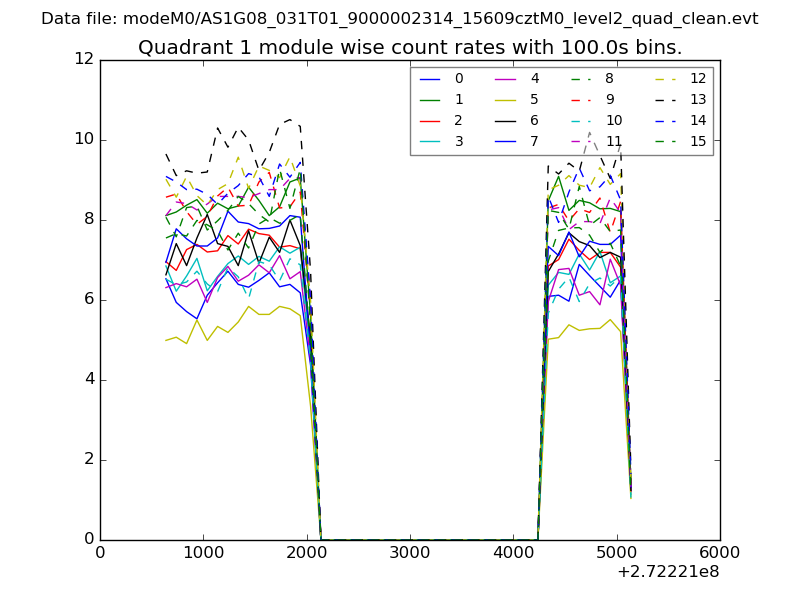
| Module-wise count rates for Quadrant A Data is divided into 100 sec bins |
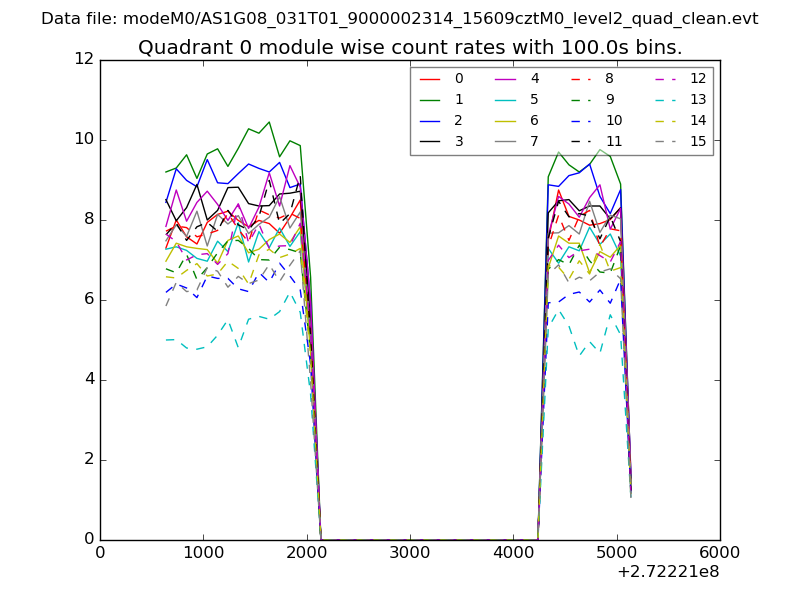 |
 |
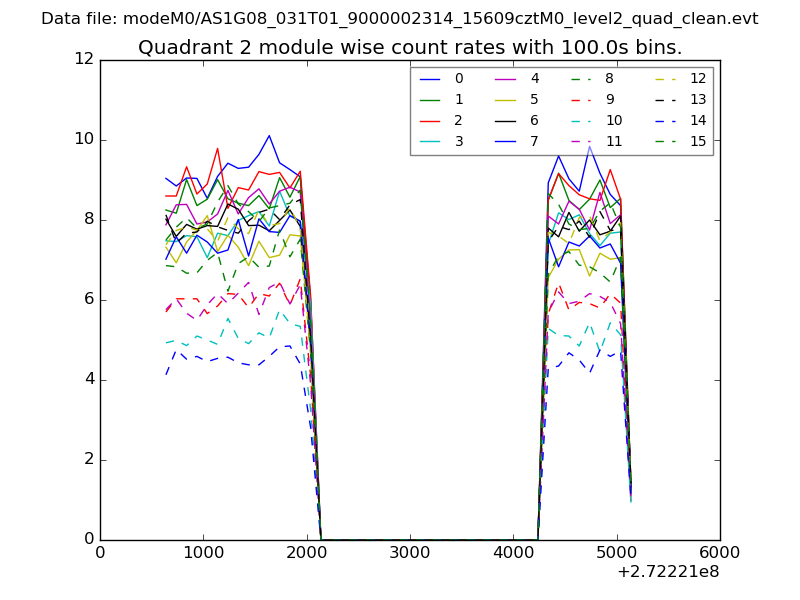
| Module-wise count rates for Quadrant B Data is divided into 100 sec bins |
 |
 |
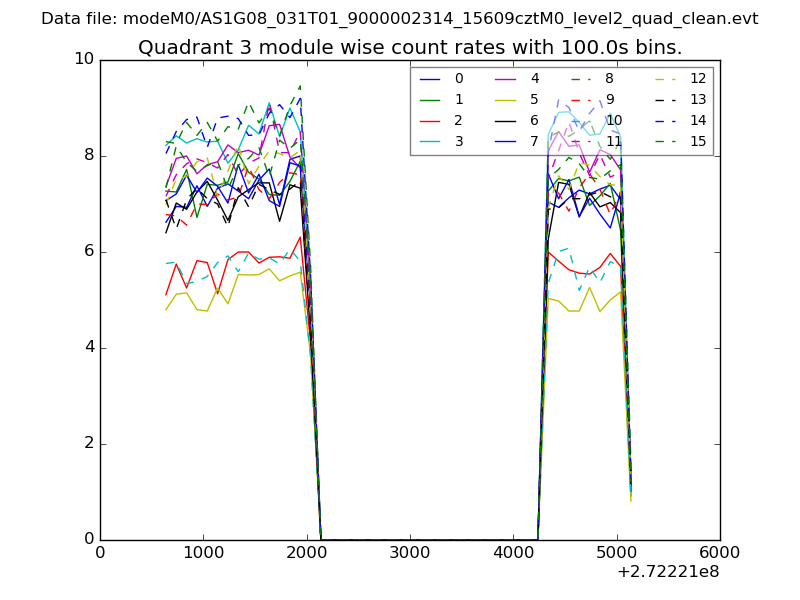
| Module-wise count rates for Quadrant C Data is divided into 100 sec bins |
 |
 |
| Module-wise count rates for Quadrant D Data is divided into 100 sec bins |
 |
 |
| Parameter | Plot |
|---|---|
| CZT HV Monitor |  |
| D_VDD | 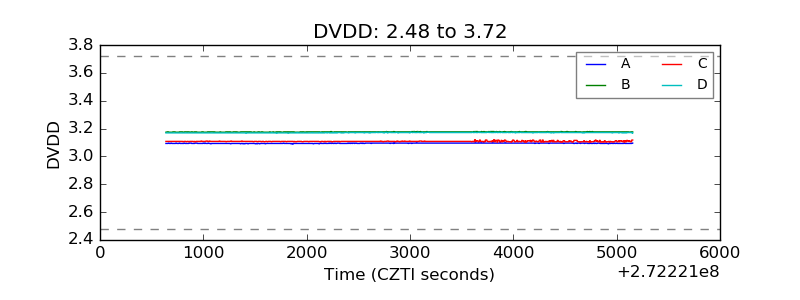 |
| Temperature 1 |  |
| Veto HV Monitor | 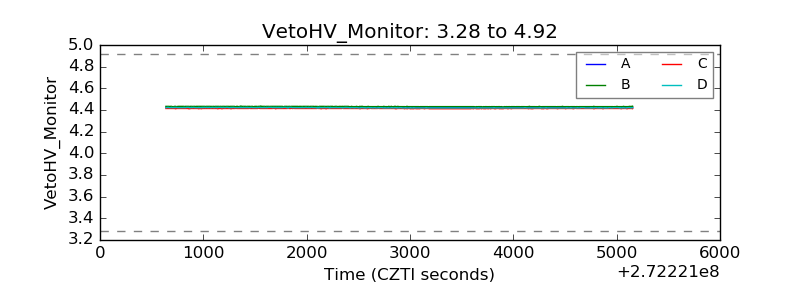 |
| Veto LLD | 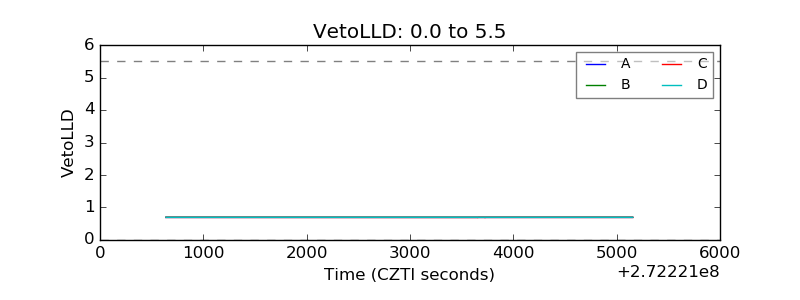 |
| Alpha Counter | 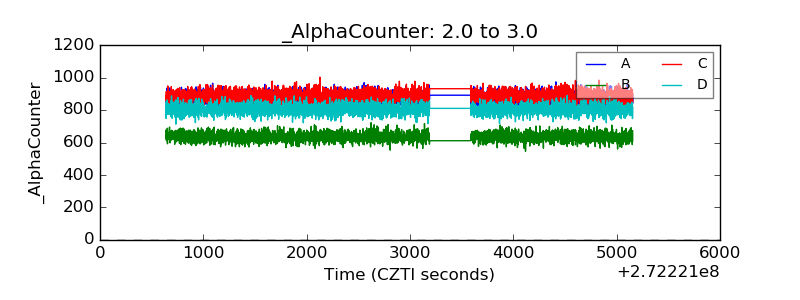 |
| _CPM_Rate | 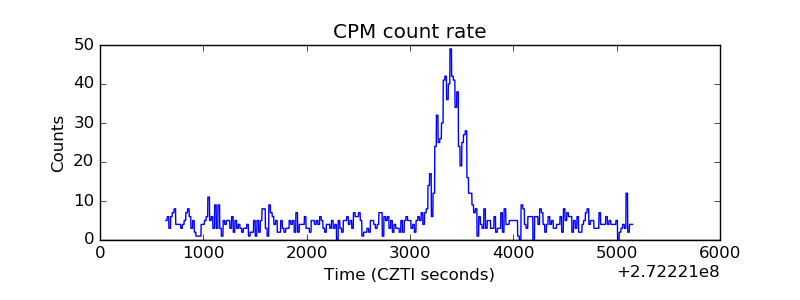 |
| CZT Counter |  |
| +2.5 Volts monitor |  |
| +5 Volts monitor | 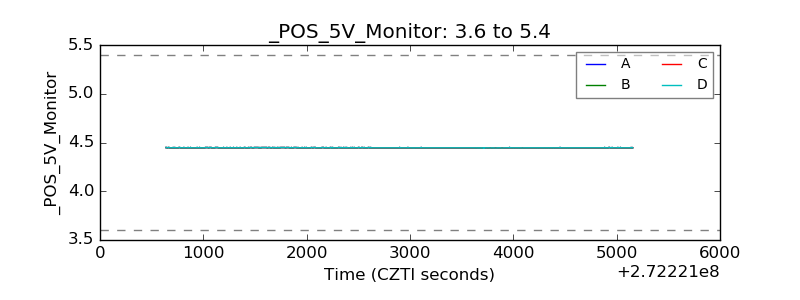 |
| _ROLL_ROT | 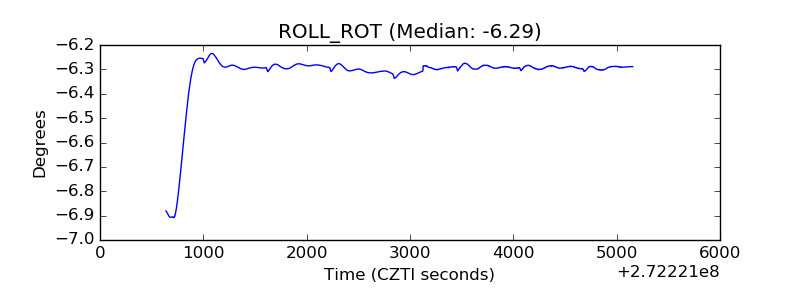 |
| _Roll_DEC | 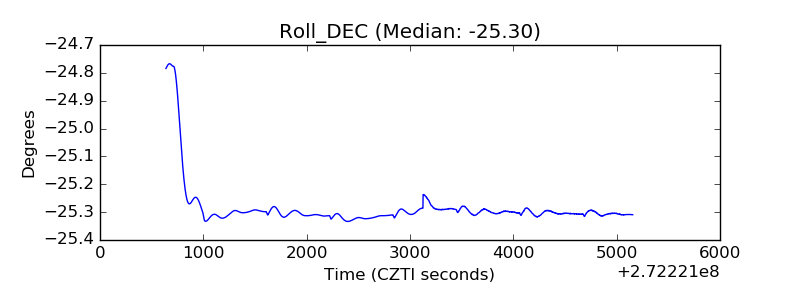 |
| _Roll_RA | 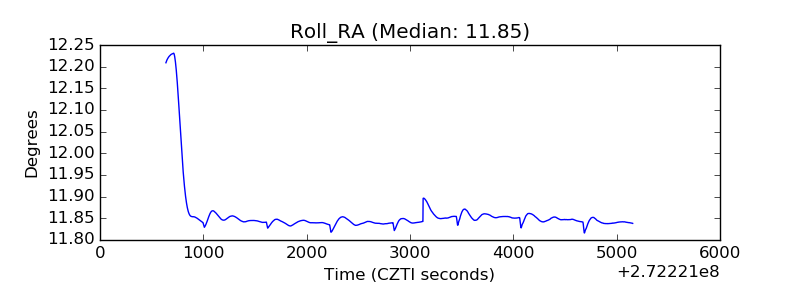 |
| Veto Counter | 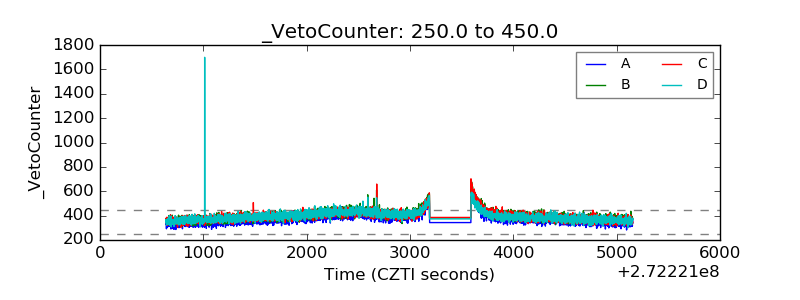 |