| Param | Original file | Final file |
|---|---|---|
| Filename | modeM0/AS1G08_031T01_9000002314_15613cztM0_level2.evt | modeM0/AS1G08_031T01_9000002314_15613cztM0_level2_quad_clean.evt |
| Size (bytes) | 1,481,002,560 | 263,543,040 |
| Size | 1.4 GB | 251.3 MB |
| Events in quadrant A | 10,575,642 | 1,620,169 |
| Events in quadrant B | 11,732,864 | 1,644,027 |
| Events in quadrant C | 10,684,054 | 1,589,919 |
| Events in quadrant D | 10,334,085 | 1,575,105 |
| Mode M9 | |||
|---|---|---|---|
| Quadrant | BADHDUFLAG | Total packets | Discarded packets |
| A | 0 | 26 | 0 |
| B | 0 | 26 | 0 |
| C | 0 | 26 | 0 |
| D | 0 | 26 | 0 |
| Mode M0 | |||
|---|---|---|---|
| Quadrant | BADHDUFLAG | Total packets | Discarded packets |
| A | 0 | 46298 | 5 |
| B | 0 | 49862 | 4 |
| C | 0 | 46237 | 4 |
| D | 0 | 46487 | 4 |
| Mode SS | |||
|---|---|---|---|
| Quadrant | BADHDUFLAG | Total packets | Discarded packets |
| A | 0 | 458 | 0 |
| B | 0 | 458 | 0 |
| C | 0 | 458 | 0 |
| D | 0 | 458 | 0 |
| Quadrant | Total seconds | Saturated seconds | Saturation percentage |
|---|---|---|---|
| A | 22567 | 80 | 0.354500% |
| B | 22567 | 176 | 0.779900% |
| C | 22567 | 209 | 0.926131% |
| D | 22567 | 98 | 0.434262% |
Noise dominated data is calculated using 1-second bins in cleaned event files. If a bin has >2000 counts, and if more than 50% of those come from <1% of pixels, then it is considered to be noise-dominated and hence unusable.
| Quadrant | # 1 sec bins | Bins with >0 counts | Bins with >2000 counts | High rate bins dominated by noise | Noise dominated (total time) | Noise dominated (detector-on time) | Marked lightcurve |
|---|---|---|---|---|---|---|---|
| A | 25133 | 22572 | 5 | 5 | 0.02% | 0.02% | 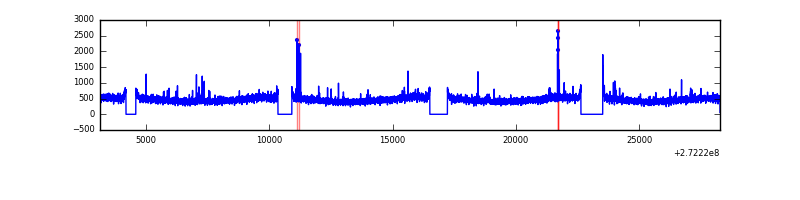 |
| B | 25133 | 22570 | 22 | 22 | 0.09% | 0.10% | 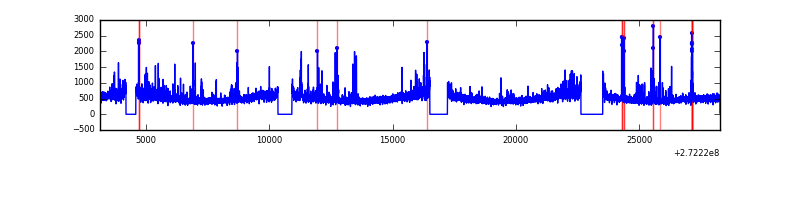 |
| C | 25133 | 22569 | 11 | 11 | 0.04% | 0.05% | 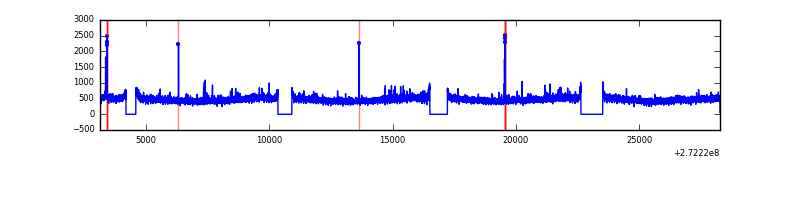 |
| D | 25133 | 22571 | 53 | 53 | 0.21% | 0.23% | 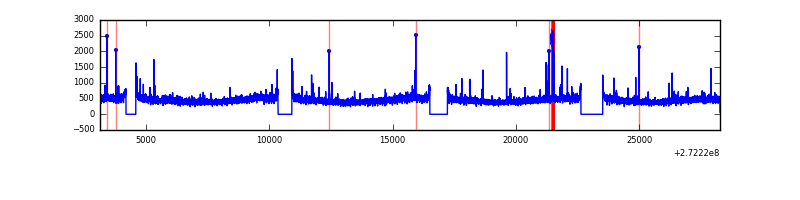 |
Top three noisy pixels from each quadrant. If the there are fewer than three noisy pixels in the level2.evt file, extra rows are filled as -1
| Pixel properties | Quadrant properties | ||||||
|---|---|---|---|---|---|---|---|
| Quadrant | DetID | PixID | Counts | Sigma | Mean | Median | Sigma |
| A | 0 | 253 | 108244 | 194.11 | 2692 | 2629 | 544.1 |
| A | 7 | 16 | 38625 | 66.16 | 2692 | 2629 | 544.1 |
| A | 0 | 226 | 23872 | 39.04 | 2692 | 2629 | 544.1 |
| B | 4 | 251 | 763170 | 1480.15 | 2687 | 2615 | 513.8 |
| B | 4 | 173 | 203990 | 391.9 | 2687 | 2615 | 513.8 |
| B | 0 | 189 | 105061 | 199.37 | 2687 | 2615 | 513.8 |
| C | 14 | 238 | 395899 | 649.49 | 2590 | 2604 | 605.5 |
| C | 3 | 233 | 55285 | 87.0 | 2590 | 2604 | 605.5 |
| C | 7 | 247 | 52711 | 82.75 | 2590 | 2604 | 605.5 |
| D | 1 | 52 | 120615 | 183.92 | 2634 | 2557 | 641.9 |
| D | 2 | 234 | 106222 | 161.5 | 2634 | 2557 | 641.9 |
| D | 2 | 152 | 88721 | 134.23 | 2634 | 2557 | 641.9 |
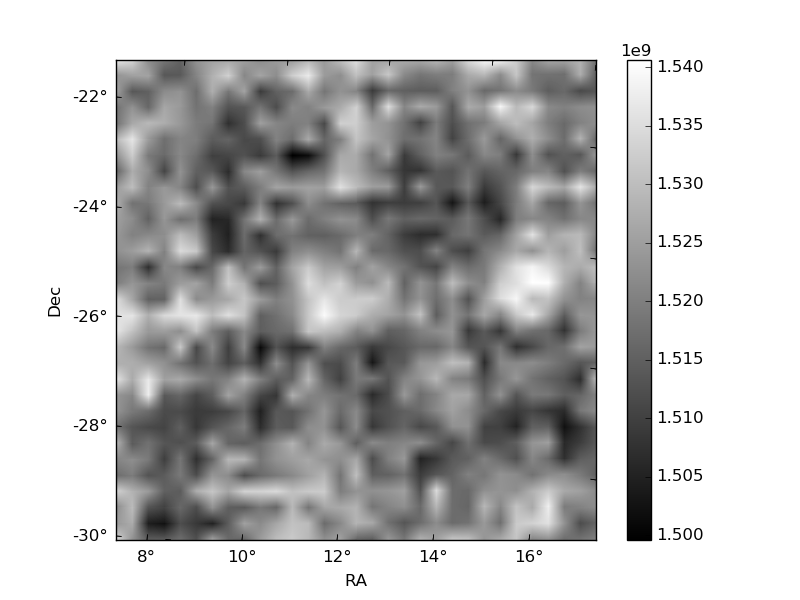
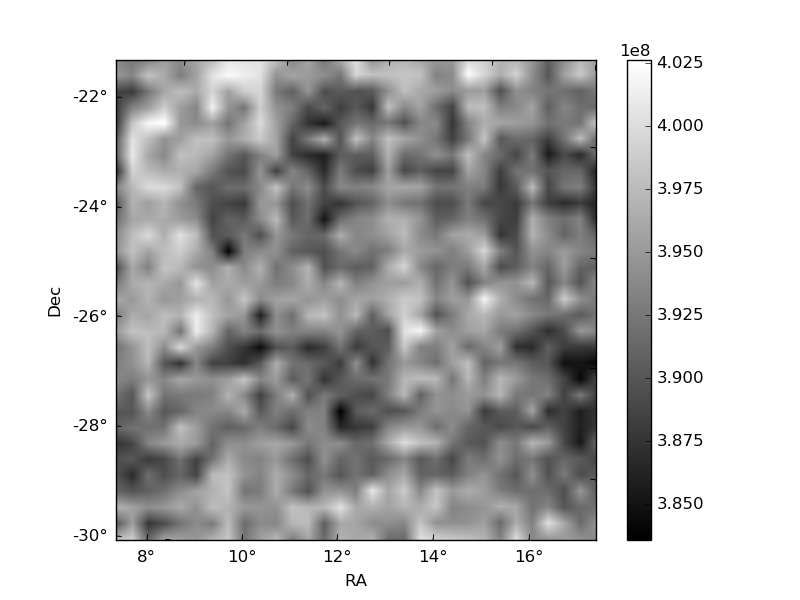
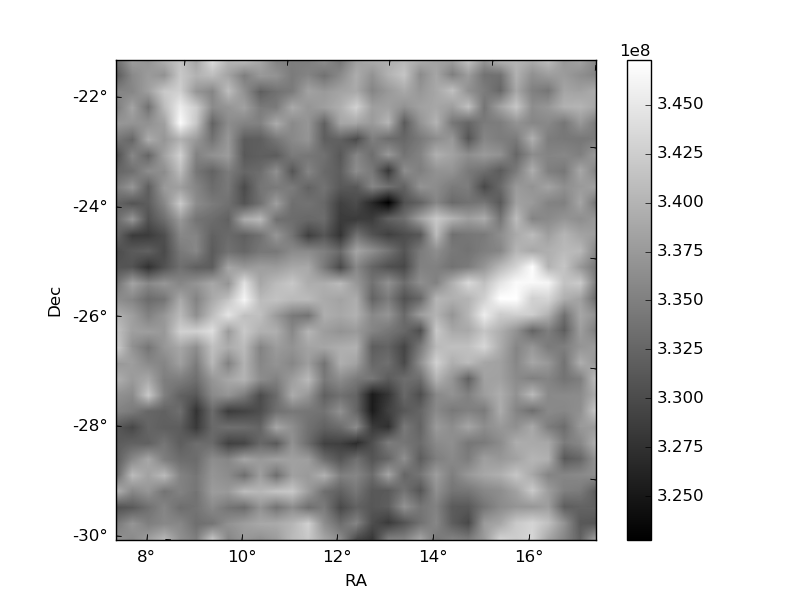
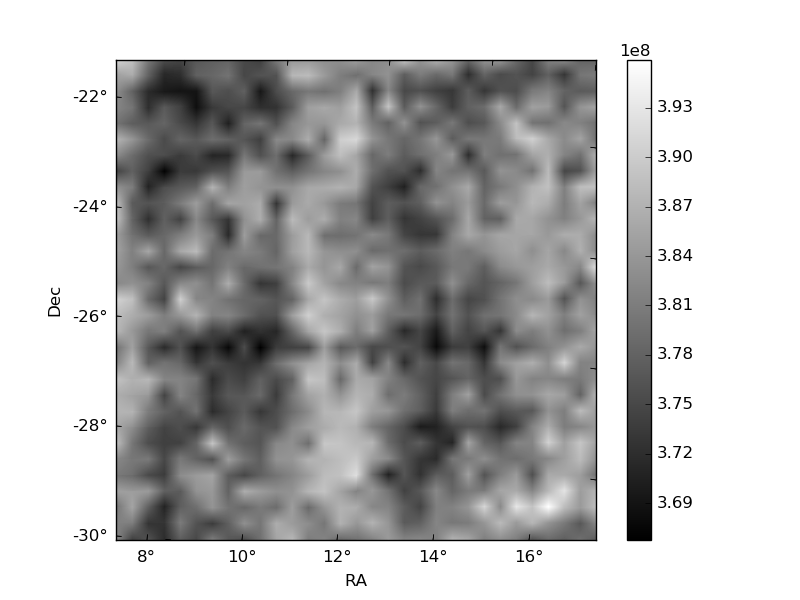
Histogram calculated using DETX and DETY for each event in the final _common_clean file
| Quadrant A | 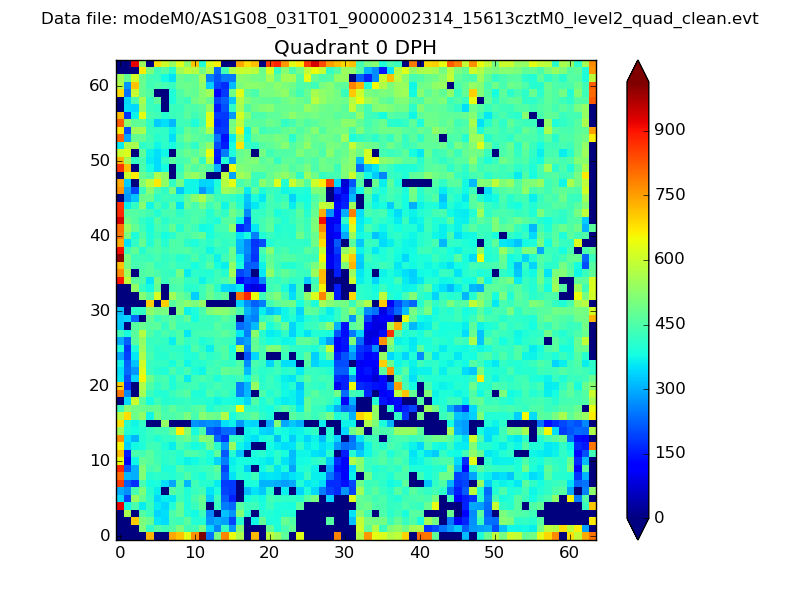 |
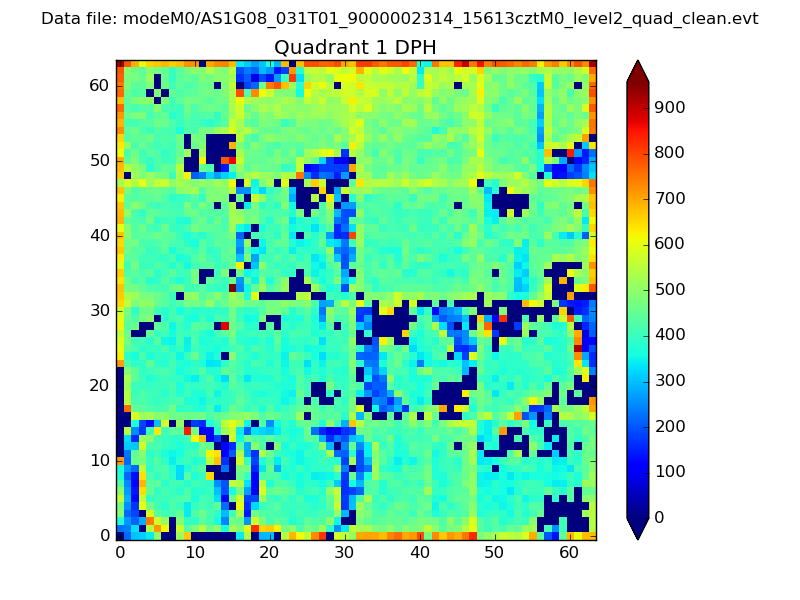 |
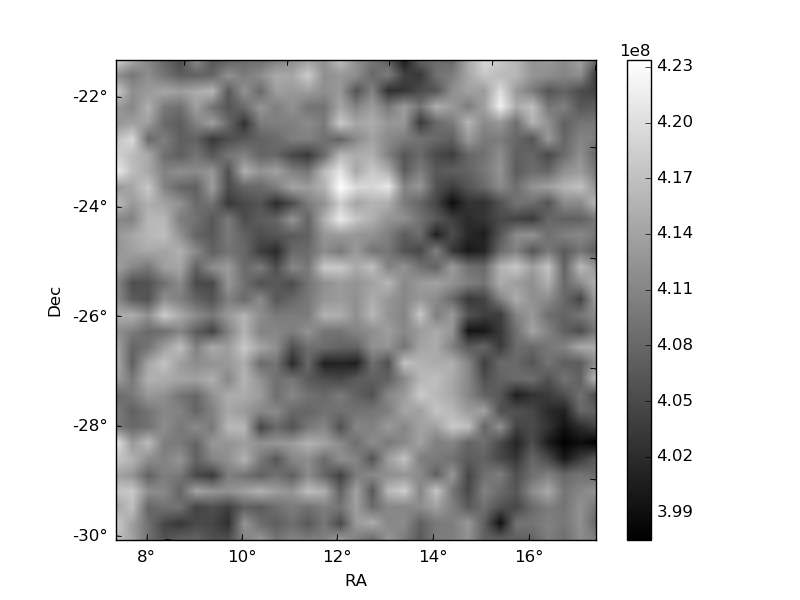
Quadrant B |
|---|---|---|---|
| Quadrant D | 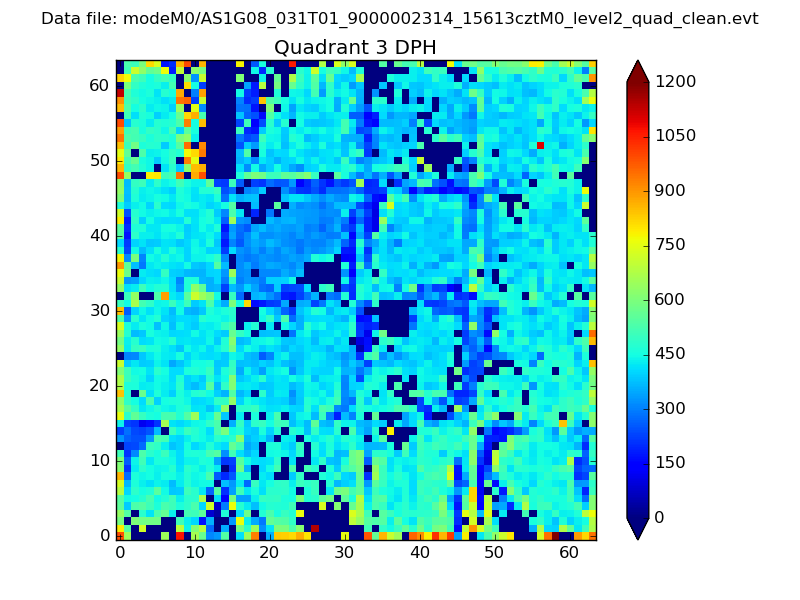 |
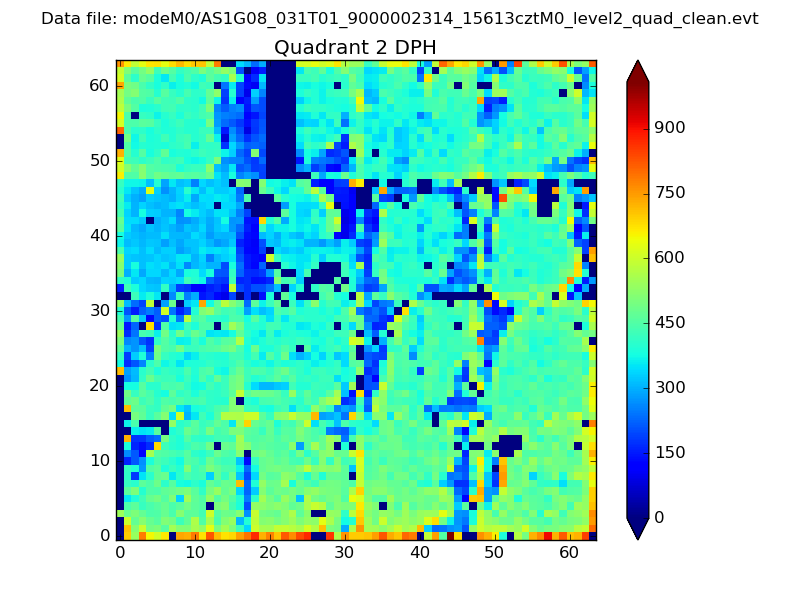 |
Quadrant C |
| Plot type | Count rate plots | Images |
|---|---|---|
| Comparison with Poisson distribution Blue bars denote a histogram of data divided into 1 sec bins. Red curve is a Poisson curve with rate = median count rate of data. |
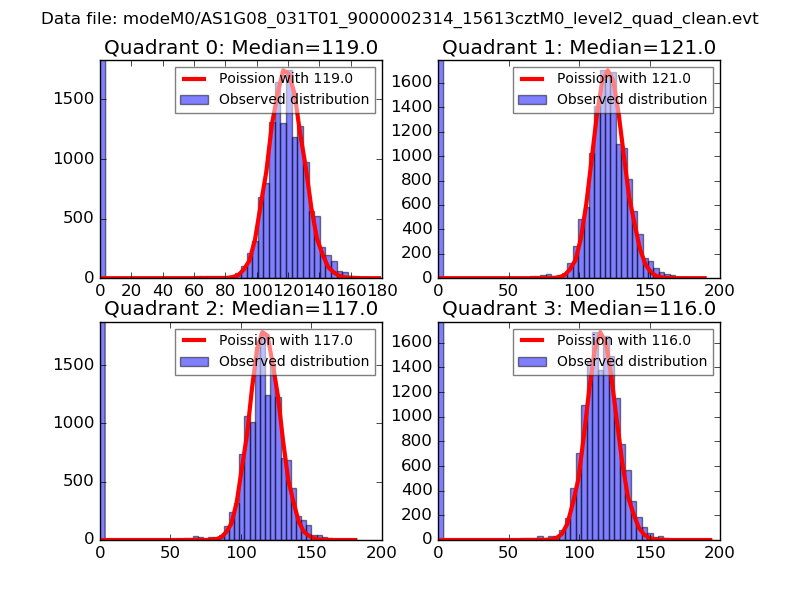 |
 |
| Quadrant-wise count rates Data is divided into 100 sec bins |
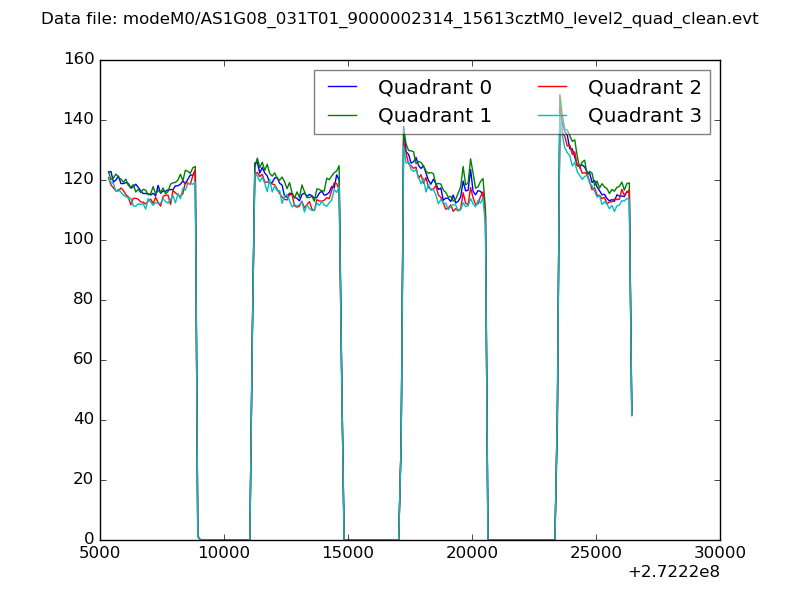 |
|
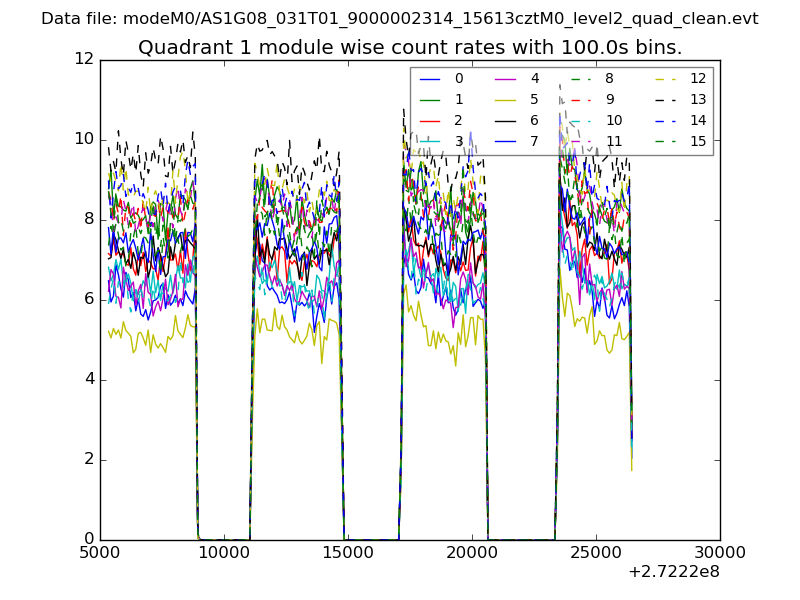
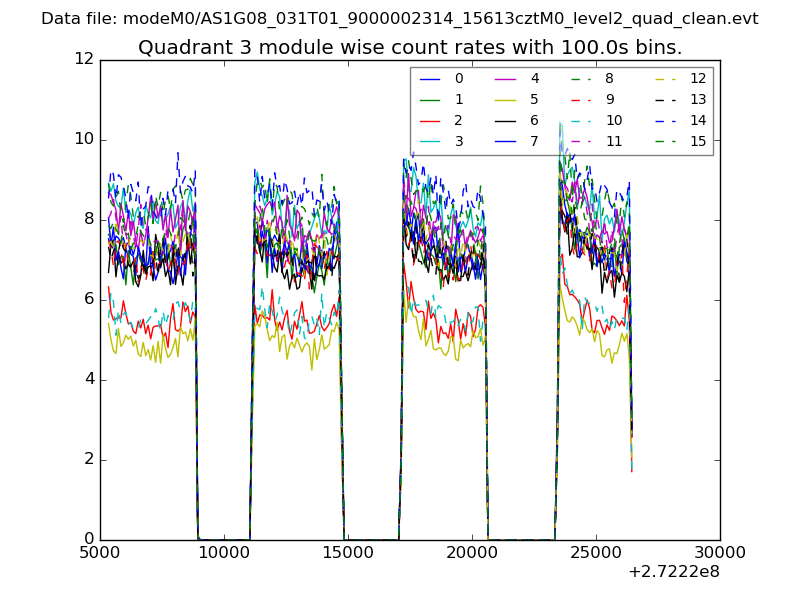
| Module-wise count rates for Quadrant A Data is divided into 100 sec bins |
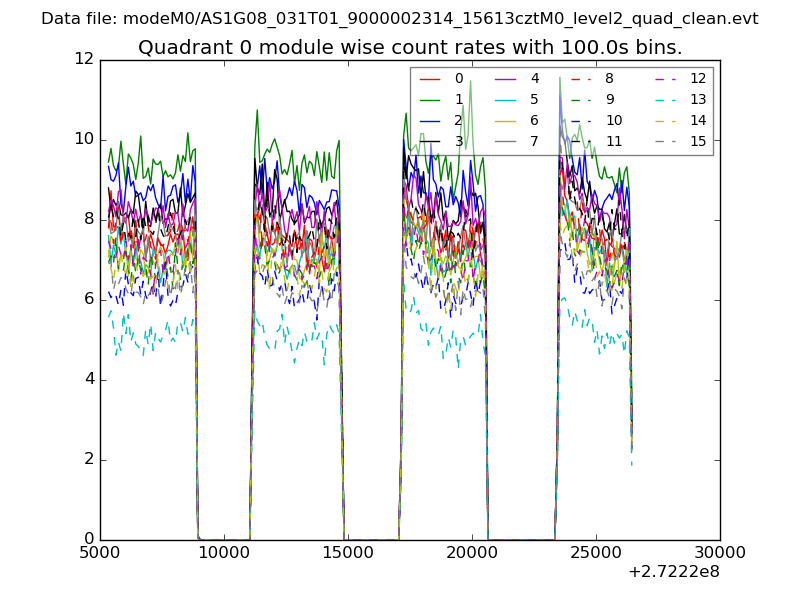 |
 |
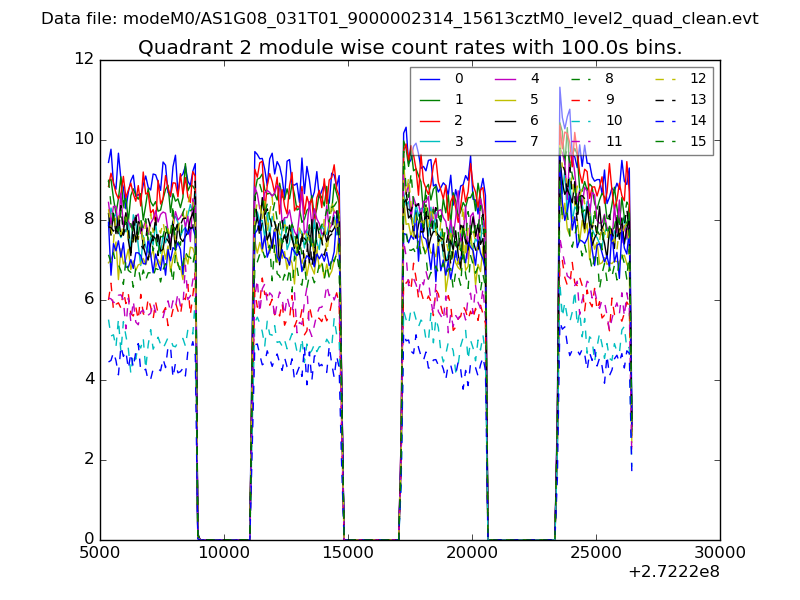
| Module-wise count rates for Quadrant B Data is divided into 100 sec bins |
 |
 |
| Module-wise count rates for Quadrant C Data is divided into 100 sec bins |
 |
 |
| Module-wise count rates for Quadrant D Data is divided into 100 sec bins |
 |
 |
| Parameter | Plot |
|---|---|
| CZT HV Monitor | 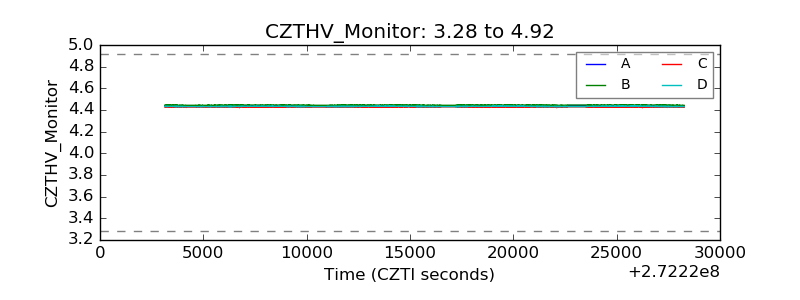 |
| D_VDD | 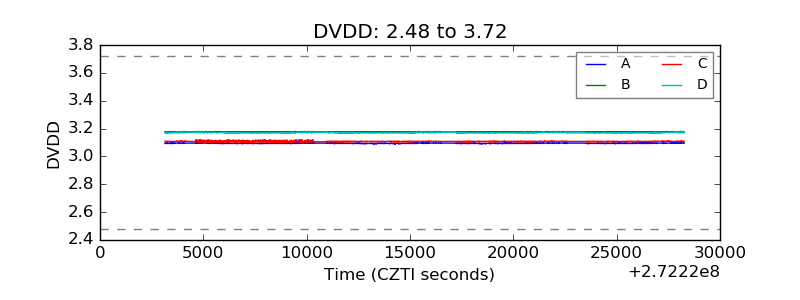 |
| Temperature 1 | 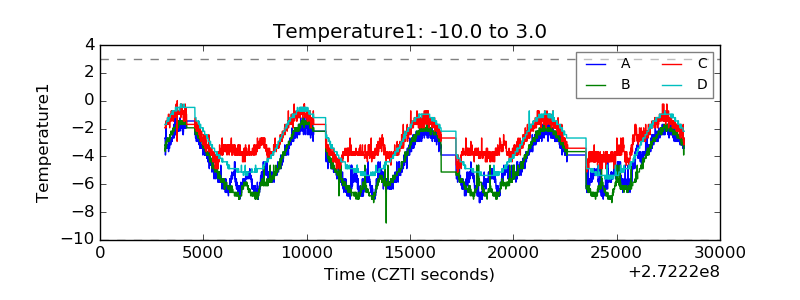 |
| Veto HV Monitor | 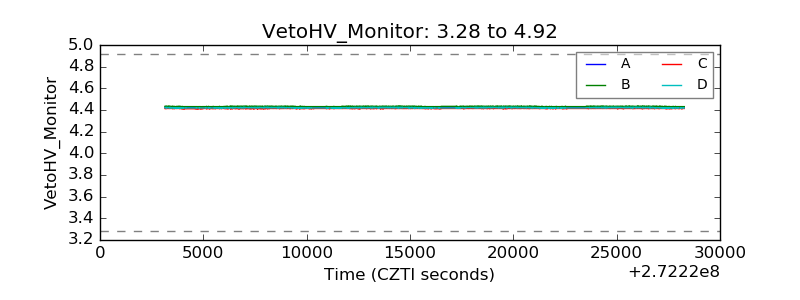 |
| Veto LLD | 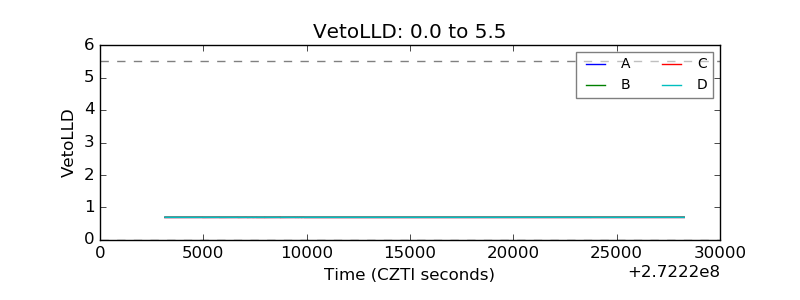 |
| Alpha Counter | 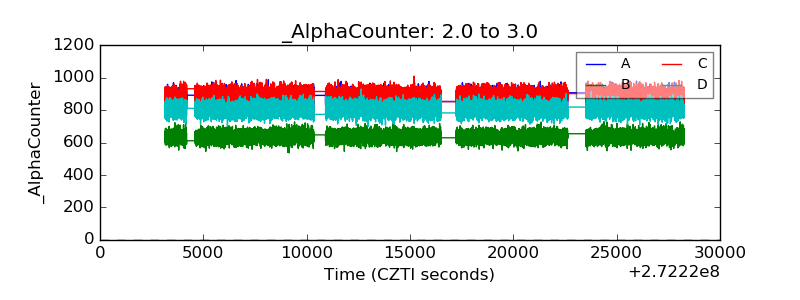 |
| _CPM_Rate | 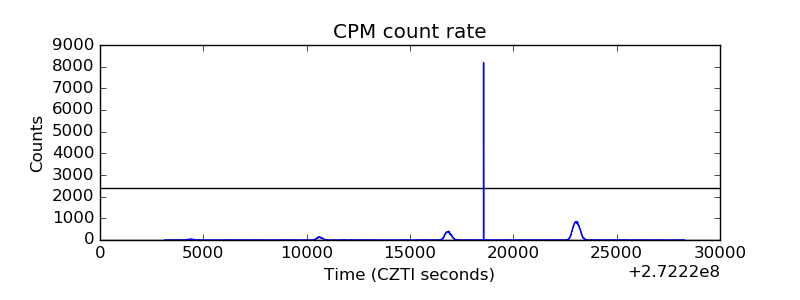 |
| CZT Counter | 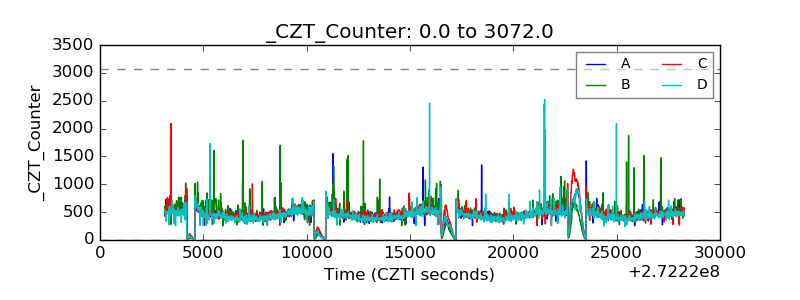 |
| +2.5 Volts monitor |  |
| +5 Volts monitor |  |
| _ROLL_ROT | 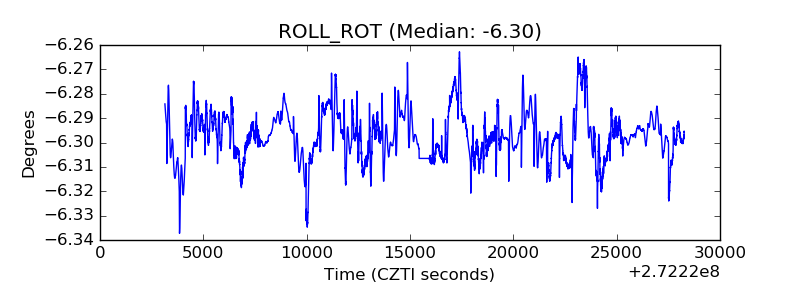 |
| _Roll_DEC | 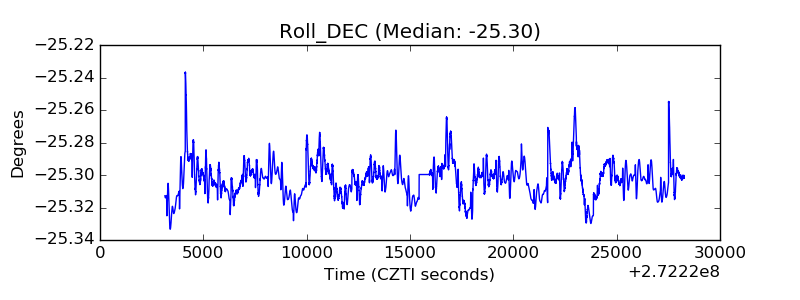 |
| _Roll_RA | 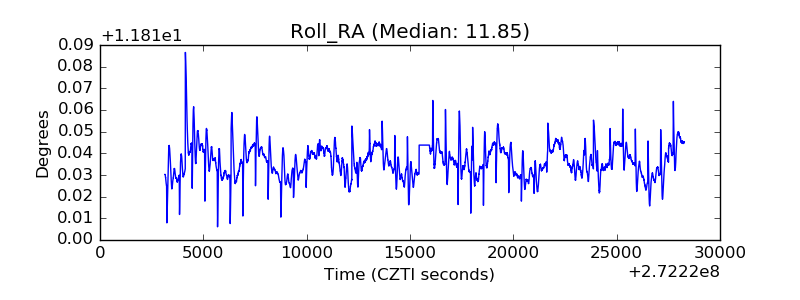 |
| Veto Counter | 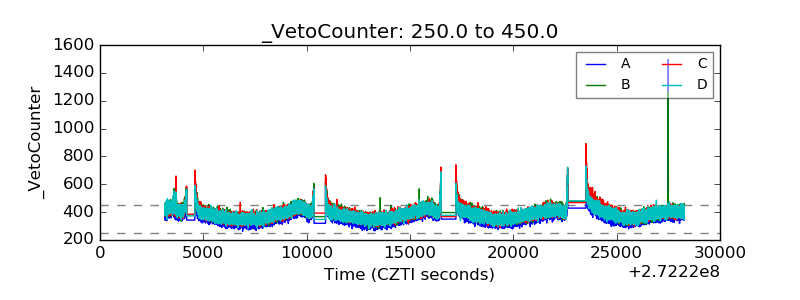 |