| Param | Original file | Final file |
|---|---|---|
| Filename | modeM0/AS1G08_031T01_9000002314_15615cztM0_level2.evt | modeM0/AS1G08_031T01_9000002314_15615cztM0_level2_quad_clean.evt |
| Size (bytes) | 593,688,960 | 102,024,000 |
| Size | 566.2 MB | 97.3 MB |
| Events in quadrant A | 4,288,524 | 628,653 |
| Events in quadrant B | 4,539,367 | 637,875 |
| Events in quadrant C | 4,283,296 | 617,509 |
| Events in quadrant D | 4,284,517 | 607,561 |
| Mode M9 | |||
|---|---|---|---|
| Quadrant | BADHDUFLAG | Total packets | Discarded packets |
| A | 0 | 23 | 0 |
| B | 0 | 23 | 0 |
| C | 0 | 23 | 0 |
| D | 0 | 23 | 0 |
| Mode M0 | |||
|---|---|---|---|
| Quadrant | BADHDUFLAG | Total packets | Discarded packets |
| A | 0 | 18048 | 3 |
| B | 0 | 18790 | 2 |
| C | 0 | 17848 | 2 |
| D | 0 | 18206 | 2 |
| Mode SS | |||
|---|---|---|---|
| Quadrant | BADHDUFLAG | Total packets | Discarded packets |
| A | 0 | 174 | 0 |
| B | 0 | 174 | 0 |
| C | 0 | 174 | 0 |
| D | 0 | 174 | 0 |
| Quadrant | Total seconds | Saturated seconds | Saturation percentage |
|---|---|---|---|
| A | 8621 | 54 | 0.626377% |
| B | 8621 | 102 | 1.183157% |
| C | 8621 | 85 | 0.985965% |
| D | 8621 | 66 | 0.765572% |
Noise dominated data is calculated using 1-second bins in cleaned event files. If a bin has >2000 counts, and if more than 50% of those come from <1% of pixels, then it is considered to be noise-dominated and hence unusable.
| Quadrant | # 1 sec bins | Bins with >0 counts | Bins with >2000 counts | High rate bins dominated by noise | Noise dominated (total time) | Noise dominated (detector-on time) | Marked lightcurve |
|---|---|---|---|---|---|---|---|
| A | 10837 | 8623 | 2 | 2 | 0.02% | 0.02% | 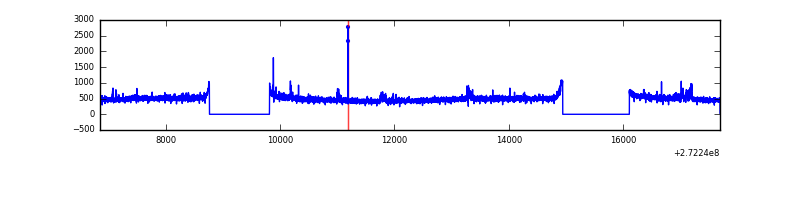 |
| B | 10837 | 8622 | 15 | 15 | 0.14% | 0.17% | 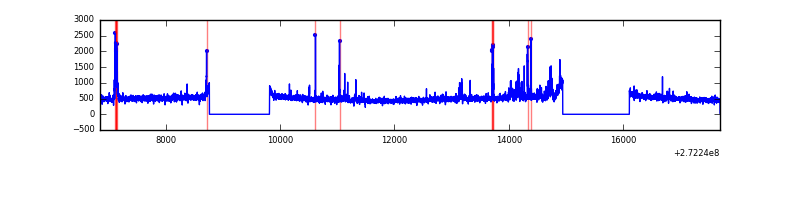 |
| C | 10837 | 8622 | 0 | 0 | 0.00% | 0.00% | 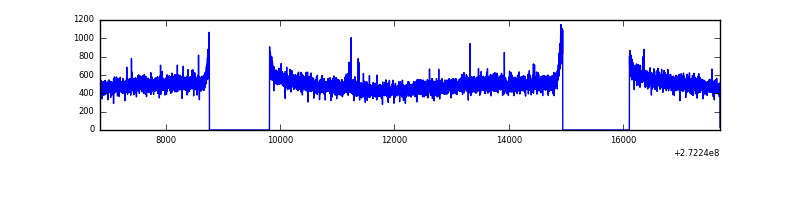 |
| D | 10837 | 8622 | 30 | 30 | 0.28% | 0.35% | 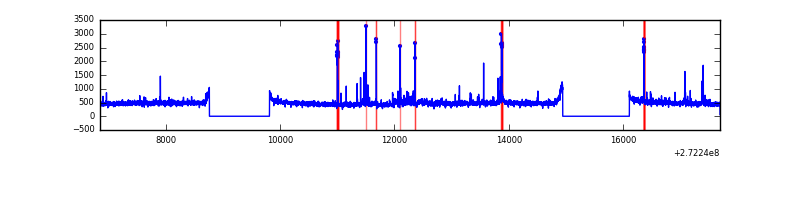 |
Top three noisy pixels from each quadrant. If the there are fewer than three noisy pixels in the level2.evt file, extra rows are filled as -1
| Pixel properties | Quadrant properties | ||||||
|---|---|---|---|---|---|---|---|
| Quadrant | DetID | PixID | Counts | Sigma | Mean | Median | Sigma |
| A | 0 | 253 | 82648 | 372.64 | 1087 | 1062 | 218.9 |
| A | 15 | 157 | 11170 | 46.17 | 1087 | 1062 | 218.9 |
| A | 0 | 226 | 9677 | 39.35 | 1087 | 1062 | 218.9 |
| B | 4 | 251 | 180794 | 865.53 | 1082 | 1053 | 207.7 |
| B | 0 | 189 | 47841 | 225.3 | 1082 | 1053 | 207.7 |
| B | 0 | 230 | 35400 | 165.4 | 1082 | 1053 | 207.7 |
| C | 14 | 238 | 159793 | 645.27 | 1049 | 1056 | 246.0 |
| C | 7 | 247 | 24093 | 93.65 | 1049 | 1056 | 246.0 |
| C | 13 | 61 | 7488 | 26.15 | 1049 | 1056 | 246.0 |
| D | 12 | 110 | 127321 | 487.94 | 1065 | 1035 | 258.8 |
| D | 10 | 70 | 117708 | 450.8 | 1065 | 1035 | 258.8 |
| D | 2 | 234 | 35335 | 132.53 | 1065 | 1035 | 258.8 |
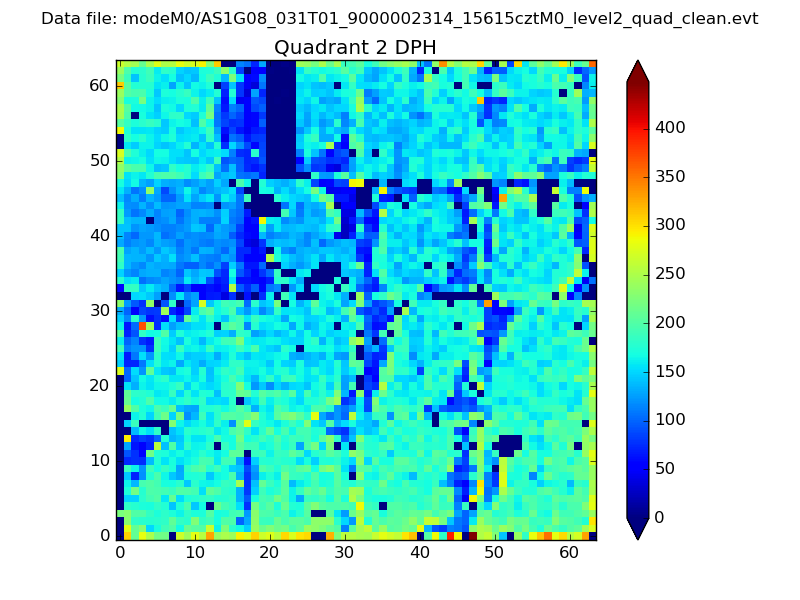
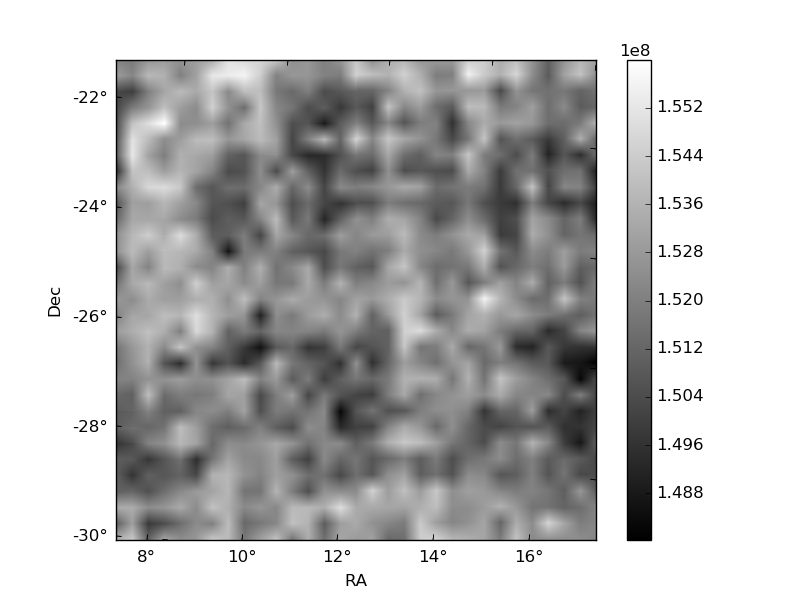
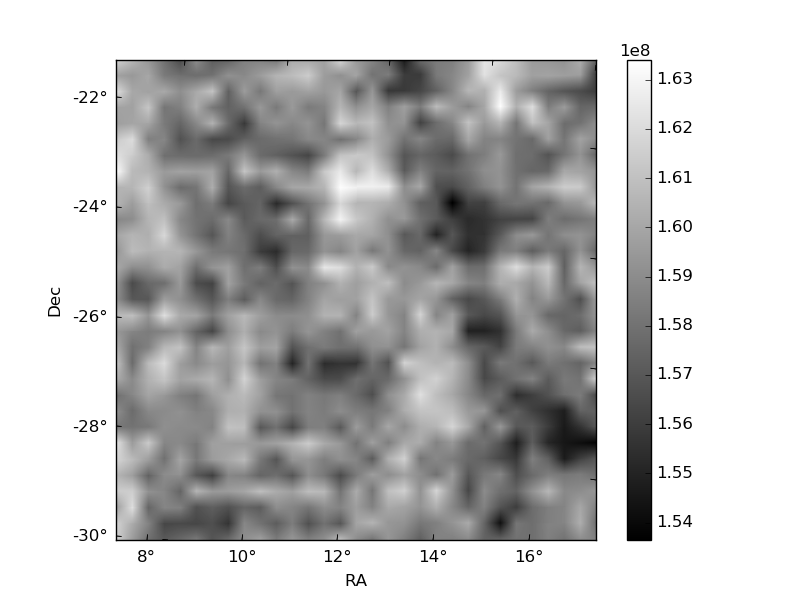
Histogram calculated using DETX and DETY for each event in the final _common_clean file
| Quadrant A | 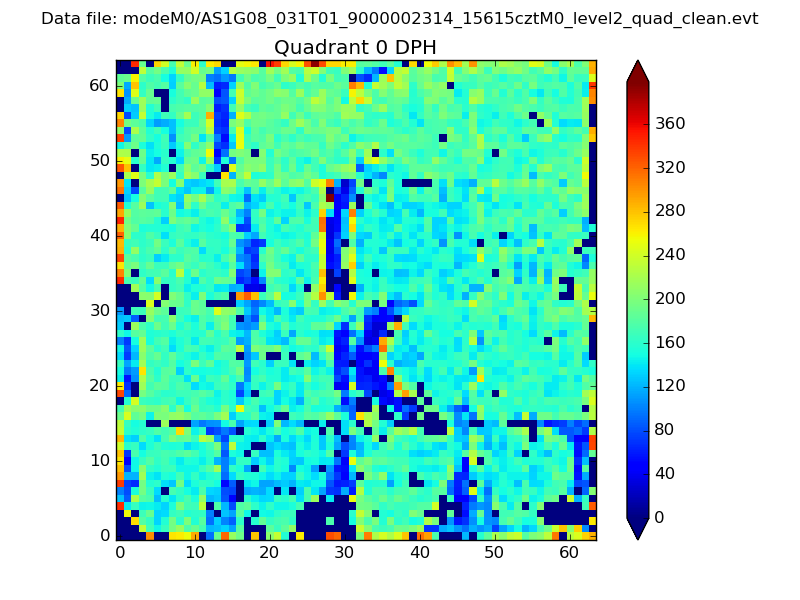 |
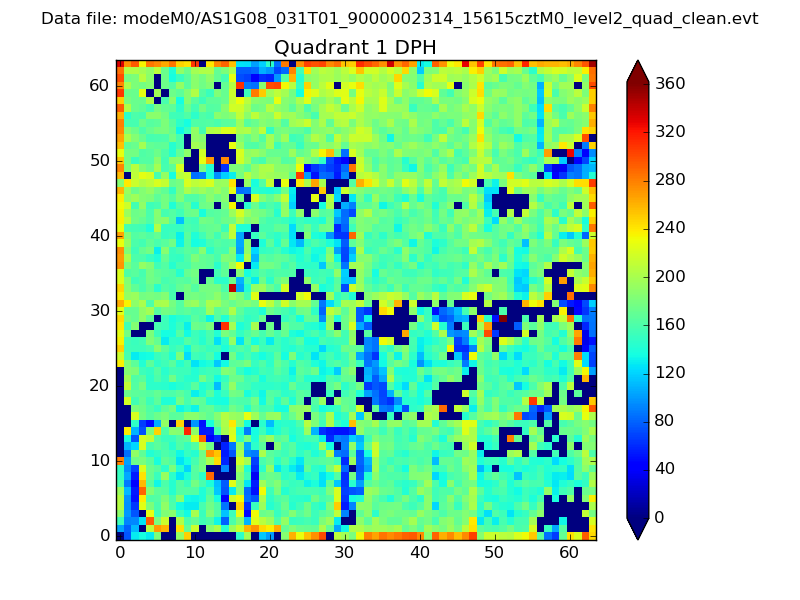 |
Quadrant B |
|---|---|---|---|
| Quadrant D | 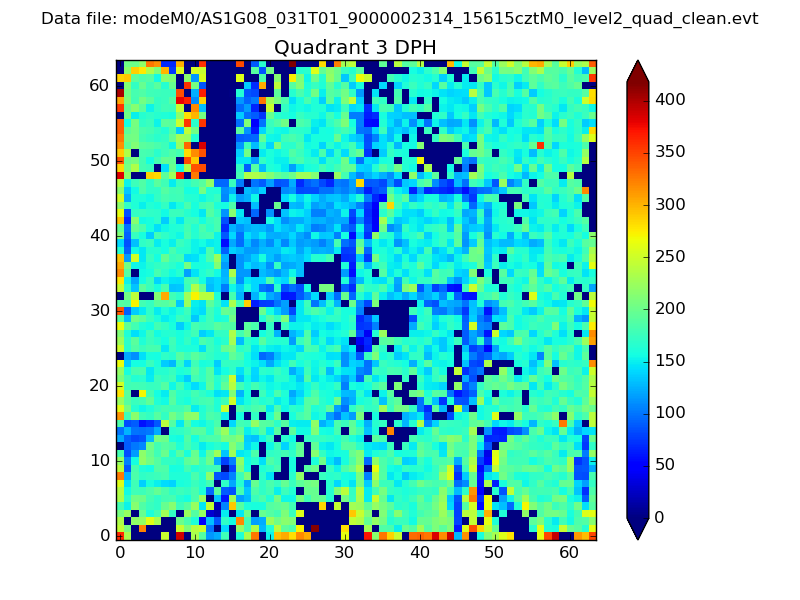 |
 |
Quadrant C |
| Plot type | Count rate plots | Images |
|---|---|---|
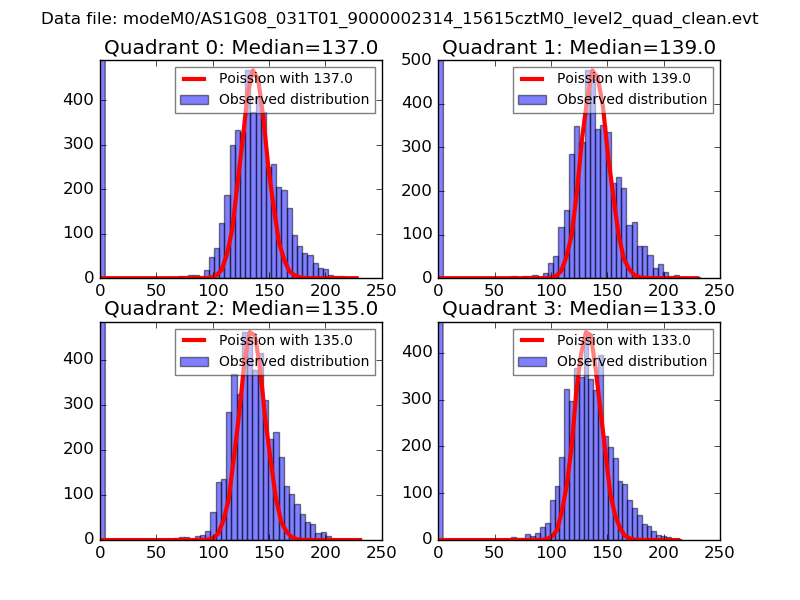
| Comparison with Poisson distribution Blue bars denote a histogram of data divided into 1 sec bins. Red curve is a Poisson curve with rate = median count rate of data. |
 |
 |
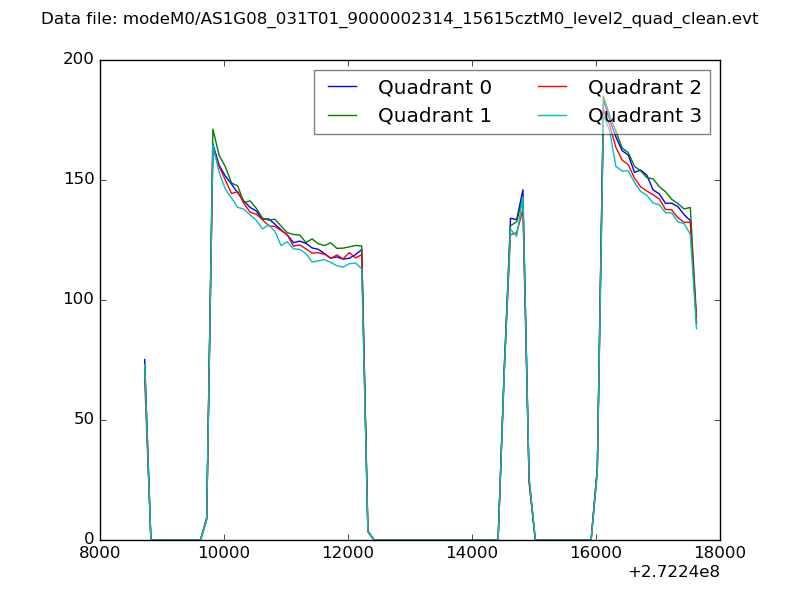
| Quadrant-wise count rates Data is divided into 100 sec bins |
 |
|
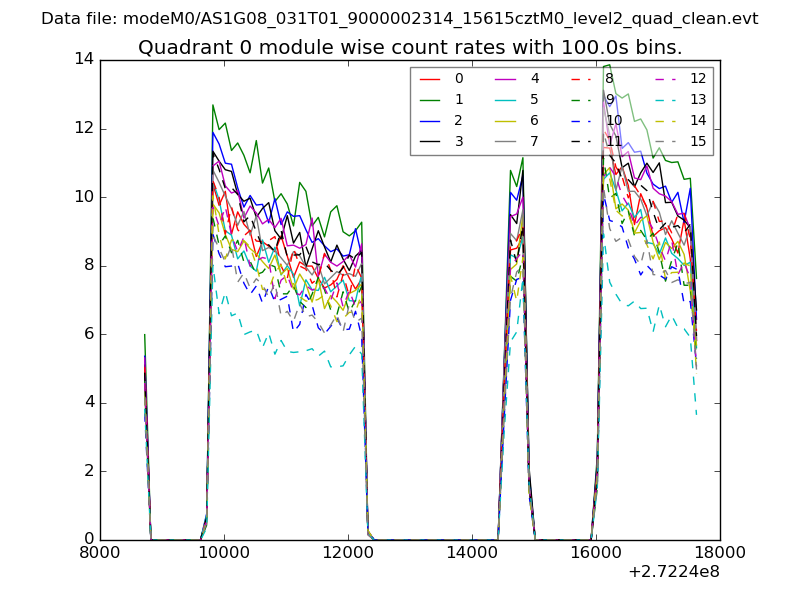
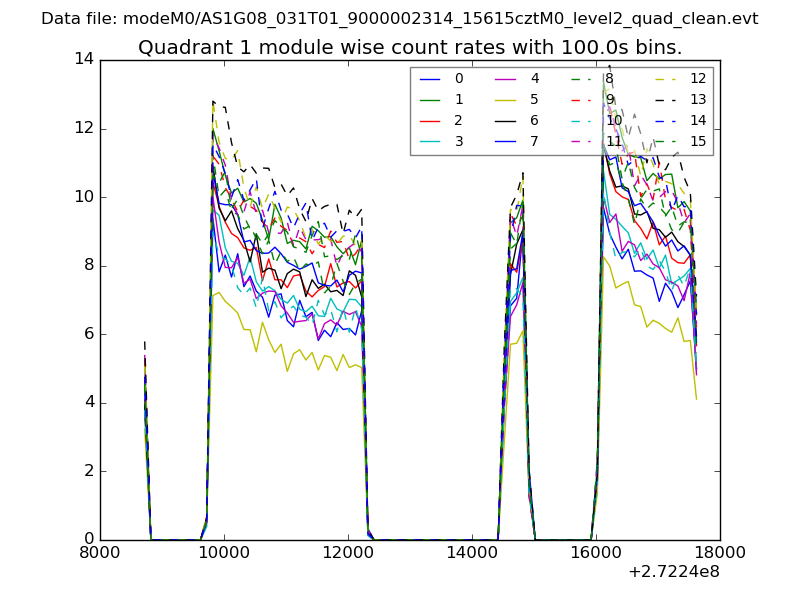
| Module-wise count rates for Quadrant A Data is divided into 100 sec bins |
 |
 |
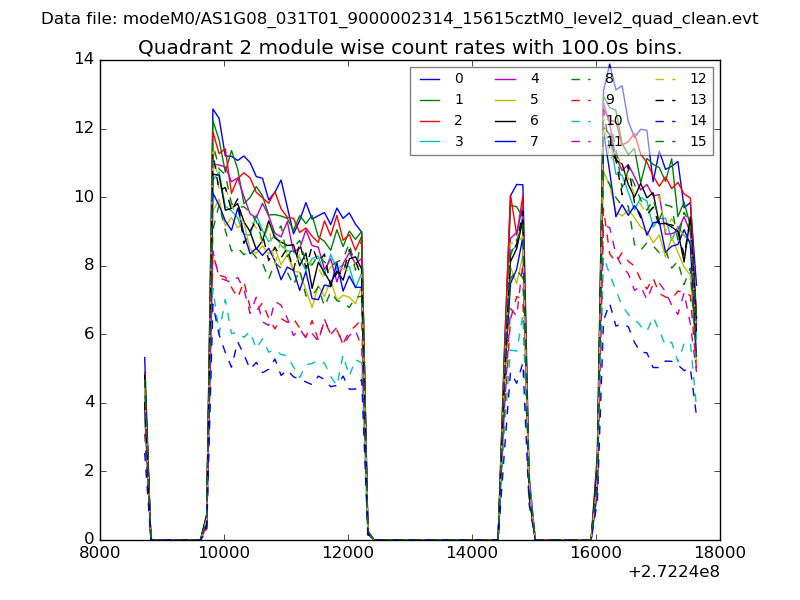
| Module-wise count rates for Quadrant B Data is divided into 100 sec bins |
 |
 |
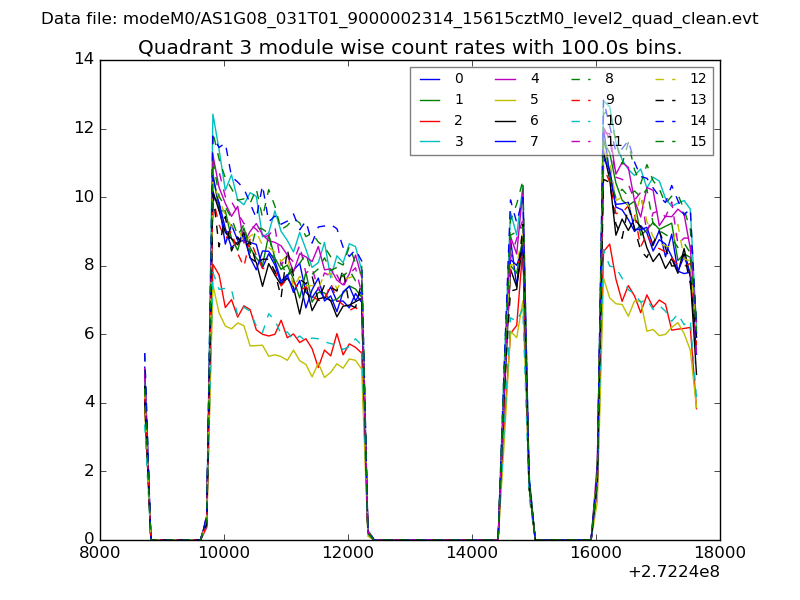
| Module-wise count rates for Quadrant C Data is divided into 100 sec bins |
 |
 |
| Module-wise count rates for Quadrant D Data is divided into 100 sec bins |
 |
 |
| Parameter | Plot |
|---|---|
| CZT HV Monitor | 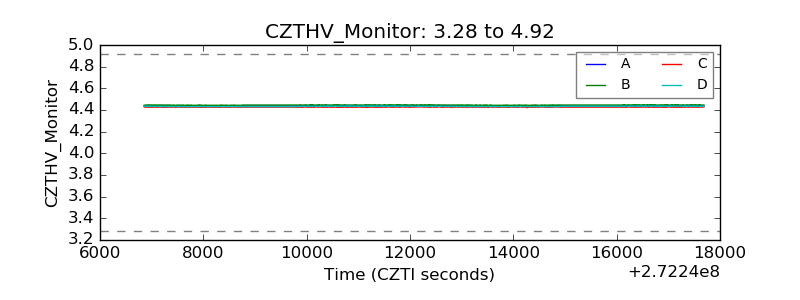 |
| D_VDD | 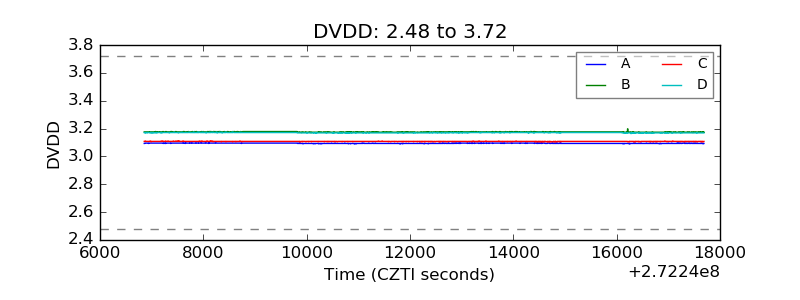 |
| Temperature 1 | 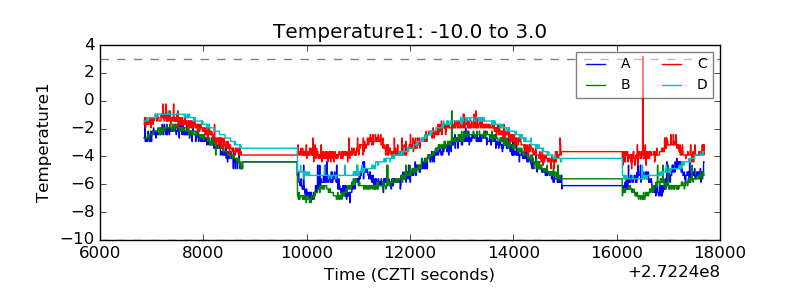 |
| Veto HV Monitor | 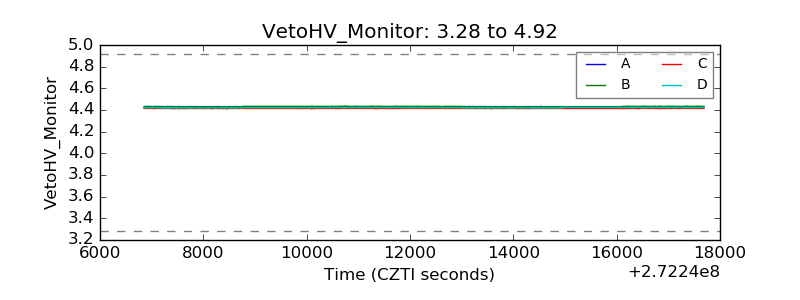 |
| Veto LLD | 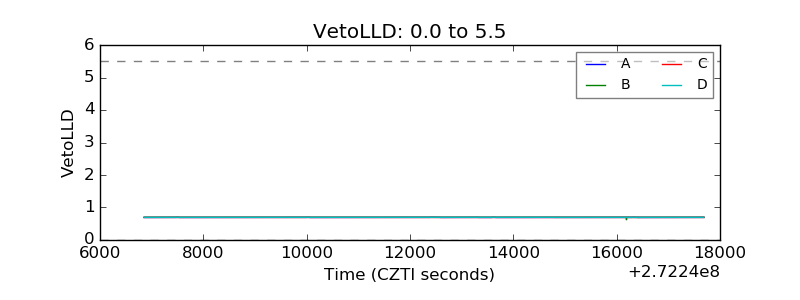 |
| Alpha Counter | 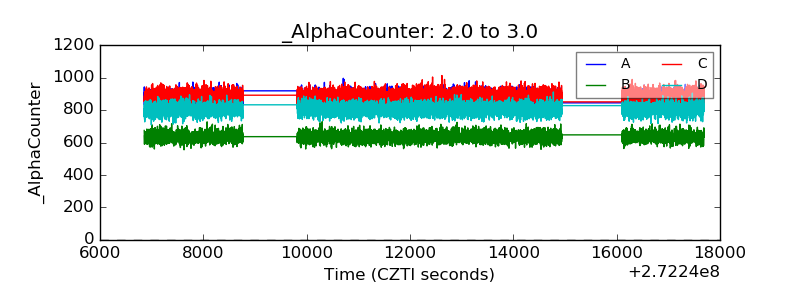 |
| _CPM_Rate | 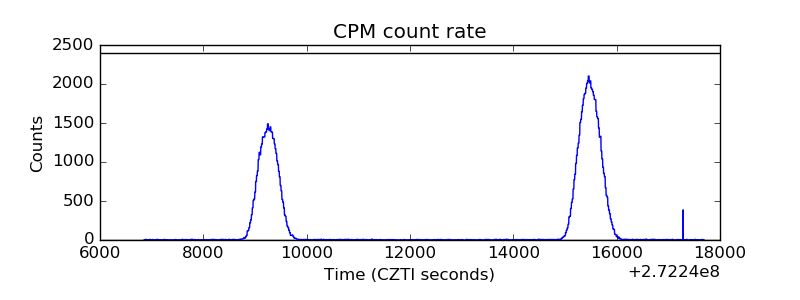 |
| CZT Counter | 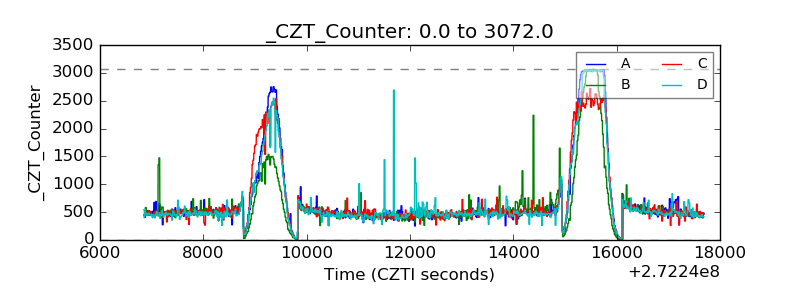 |
| +2.5 Volts monitor | 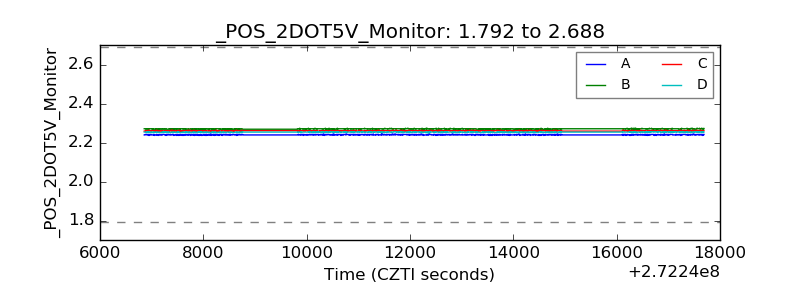 |
| +5 Volts monitor | 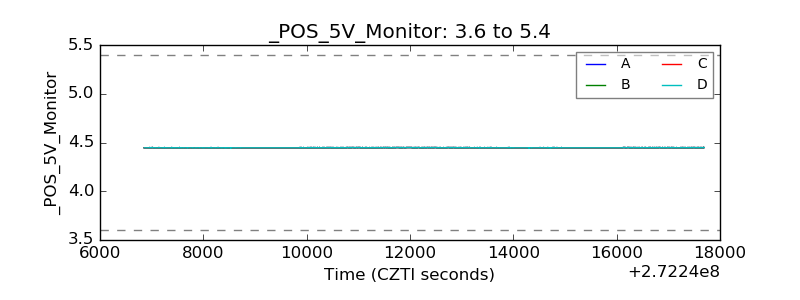 |
| _ROLL_ROT | 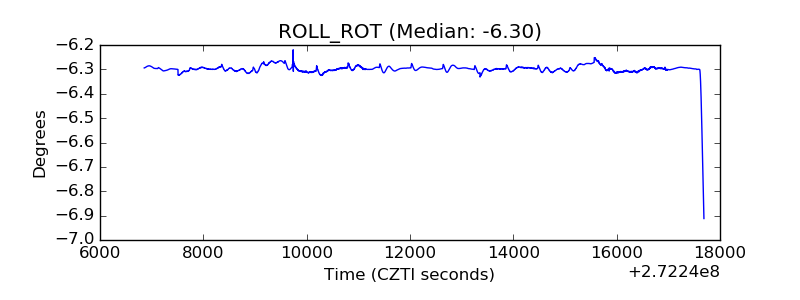 |
| _Roll_DEC | 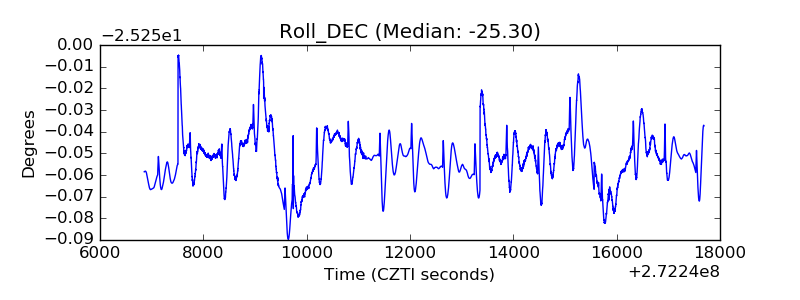 |
| _Roll_RA | 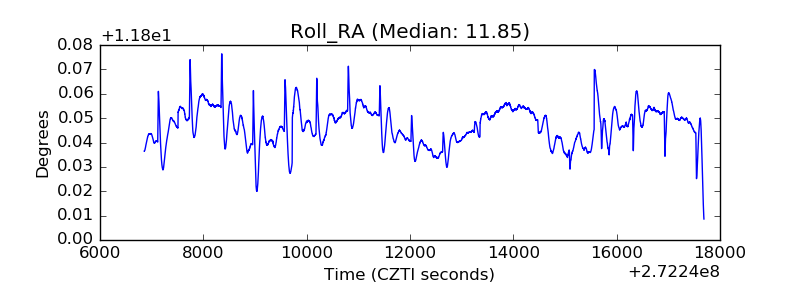 |
| Veto Counter | 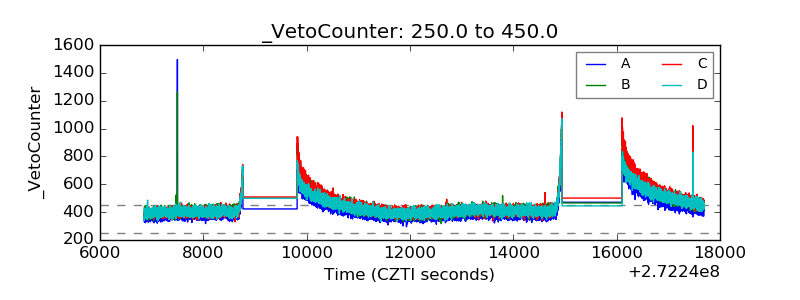 |