| Param | Original file | Final file |
|---|---|---|
| Filename | modeM0/AS1G08_031T01_9000002314_15616cztM0_level2.evt | modeM0/AS1G08_031T01_9000002314_15616cztM0_level2_quad_clean.evt |
| Size (bytes) | 429,410,880 | 90,432,000 |
| Size | 409.5 MB | 86.2 MB |
| Events in quadrant A | 3,104,673 | 585,710 |
| Events in quadrant B | 3,169,379 | 592,958 |
| Events in quadrant C | 3,119,749 | 570,252 |
| Events in quadrant D | 3,193,600 | 560,981 |
| Mode M9 | |||
|---|---|---|---|
| Quadrant | BADHDUFLAG | Total packets | Discarded packets |
| A | 0 | 13 | 0 |
| B | 0 | 13 | 0 |
| C | 0 | 13 | 0 |
| D | 0 | 13 | 0 |
| Mode M0 | |||
|---|---|---|---|
| Quadrant | BADHDUFLAG | Total packets | Discarded packets |
| A | 0 | 12835 | 2 |
| B | 0 | 12936 | 1 |
| C | 0 | 12848 | 1 |
| D | 0 | 13262 | 1 |
| Mode SS | |||
|---|---|---|---|
| Quadrant | BADHDUFLAG | Total packets | Discarded packets |
| A | 0 | 124 | 0 |
| B | 0 | 124 | 0 |
| C | 0 | 124 | 0 |
| D | 0 | 124 | 0 |
| Quadrant | Total seconds | Saturated seconds | Saturation percentage |
|---|---|---|---|
| A | 6143 | 25 | 0.406967% |
| B | 6143 | 40 | 0.651148% |
| C | 6143 | 44 | 0.716262% |
| D | 6143 | 45 | 0.732541% |
Noise dominated data is calculated using 1-second bins in cleaned event files. If a bin has >2000 counts, and if more than 50% of those come from <1% of pixels, then it is considered to be noise-dominated and hence unusable.
| Quadrant | # 1 sec bins | Bins with >0 counts | Bins with >2000 counts | High rate bins dominated by noise | Noise dominated (total time) | Noise dominated (detector-on time) | Marked lightcurve |
|---|---|---|---|---|---|---|---|
| A | 7419 | 6145 | 0 | 0 | 0.00% | 0.00% | 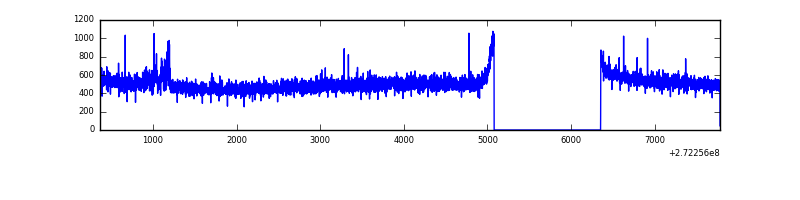 |
| B | 7419 | 6144 | 0 | 0 | 0.00% | 0.00% | 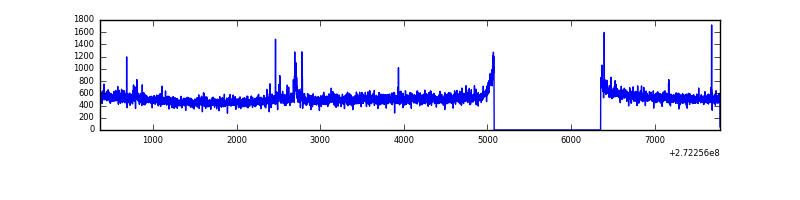 |
| C | 7419 | 6144 | 0 | 0 | 0.00% | 0.00% | 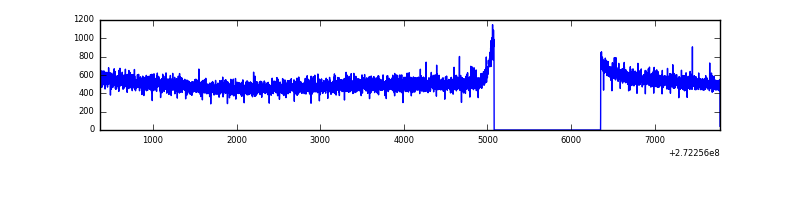 |
| D | 7419 | 6144 | 24 | 24 | 0.32% | 0.39% | 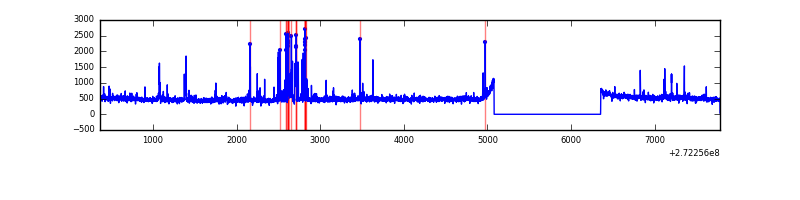 |
Top three noisy pixels from each quadrant. If the there are fewer than three noisy pixels in the level2.evt file, extra rows are filled as -1
| Pixel properties | Quadrant properties | ||||||
|---|---|---|---|---|---|---|---|
| Quadrant | DetID | PixID | Counts | Sigma | Mean | Median | Sigma |
| A | 0 | 253 | 36724 | 225.27 | 796 | 779 | 159.6 |
| A | 0 | 226 | 7077 | 39.47 | 796 | 779 | 159.6 |
| A | 12 | 194 | 5860 | 31.84 | 796 | 779 | 159.6 |
| B | 3 | 64 | 45278 | 297.71 | 787 | 769 | 149.5 |
| B | 12 | 111 | 16982 | 108.44 | 787 | 769 | 149.5 |
| B | 0 | 214 | 15873 | 101.03 | 787 | 769 | 149.5 |
| C | 14 | 238 | 118988 | 664.9 | 766 | 772 | 177.8 |
| C | 3 | 233 | 9280 | 47.85 | 766 | 772 | 177.8 |
| C | 7 | 247 | 5289 | 25.41 | 766 | 772 | 177.8 |
| D | 4 | 95 | 177461 | 925.87 | 782 | 761 | 190.8 |
| D | 10 | 70 | 34494 | 176.75 | 782 | 761 | 190.8 |
| D | 12 | 110 | 28760 | 146.71 | 782 | 761 | 190.8 |
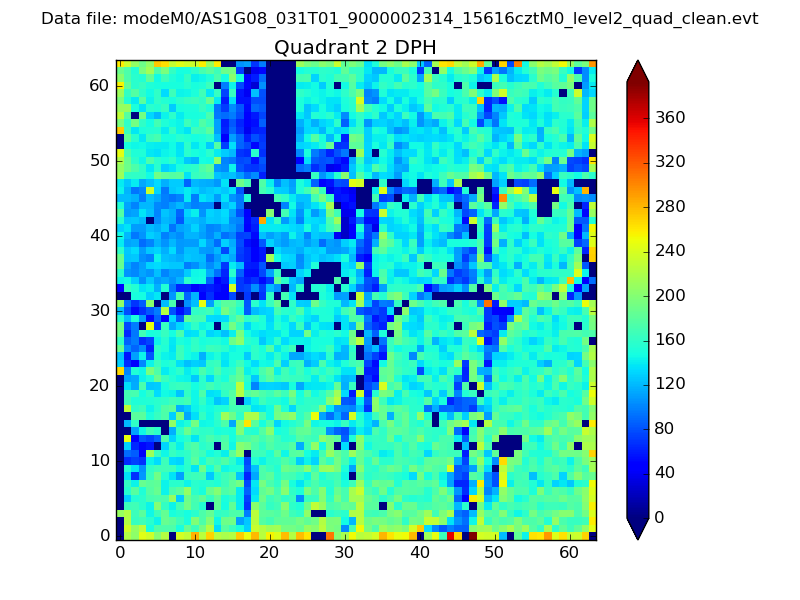
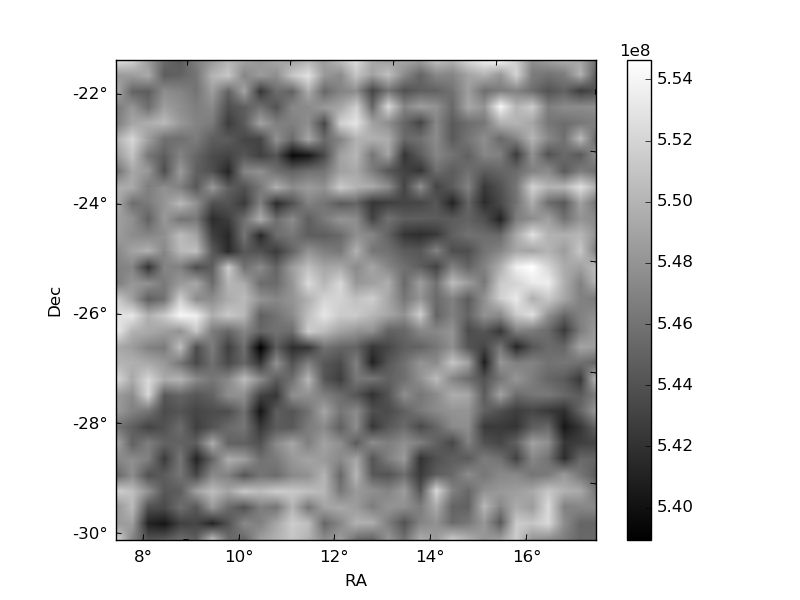
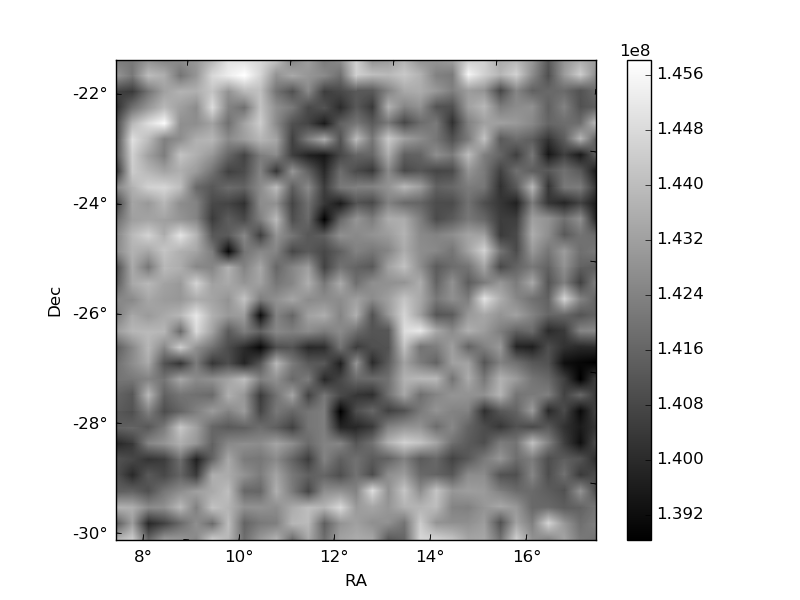
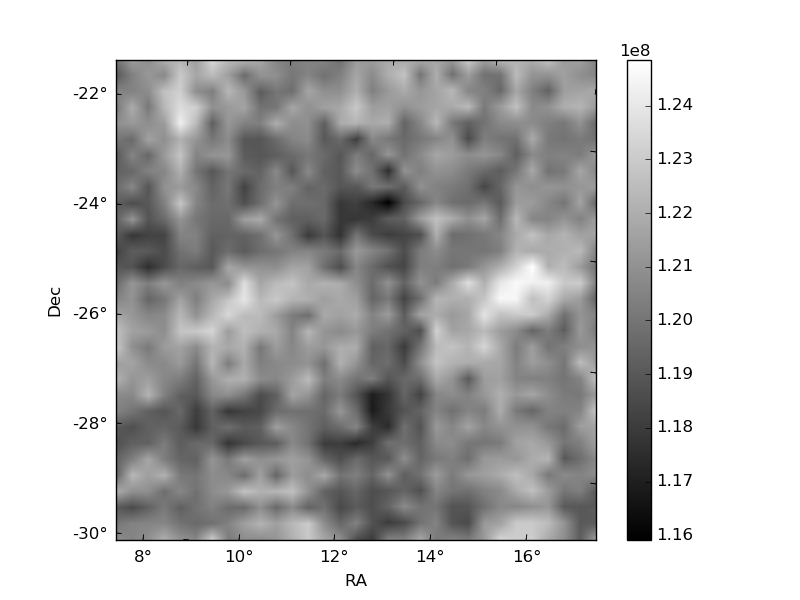
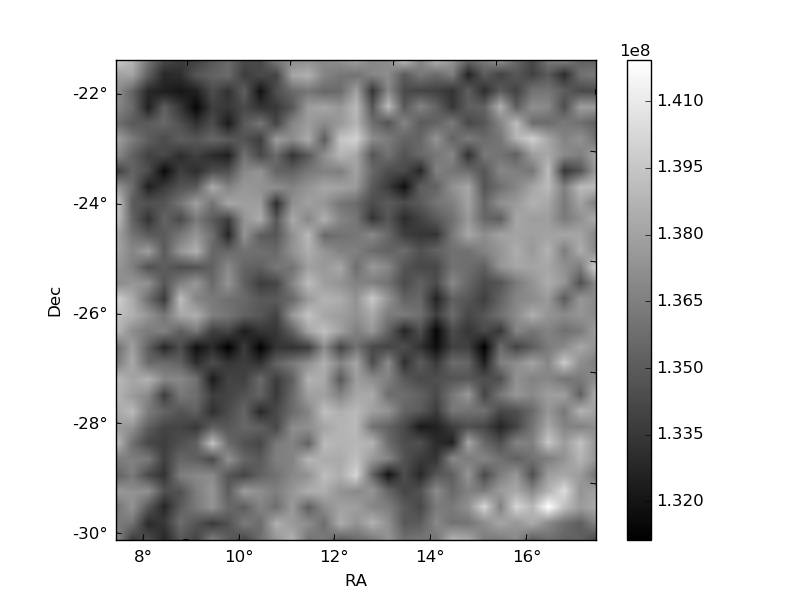
Histogram calculated using DETX and DETY for each event in the final _common_clean file
| Quadrant A | 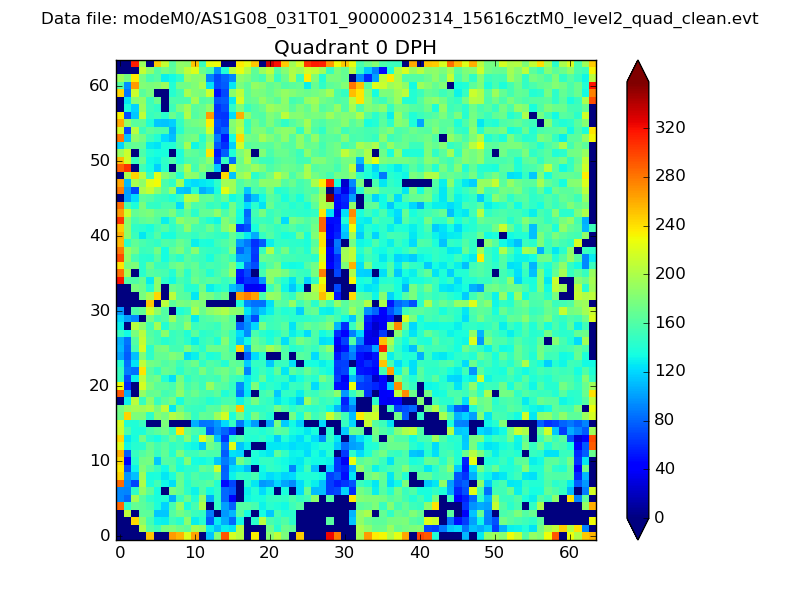 |
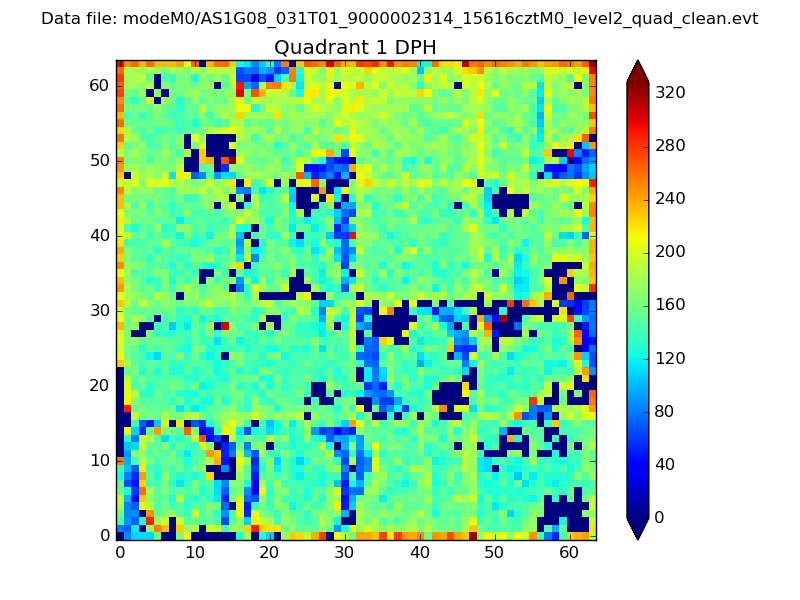 |
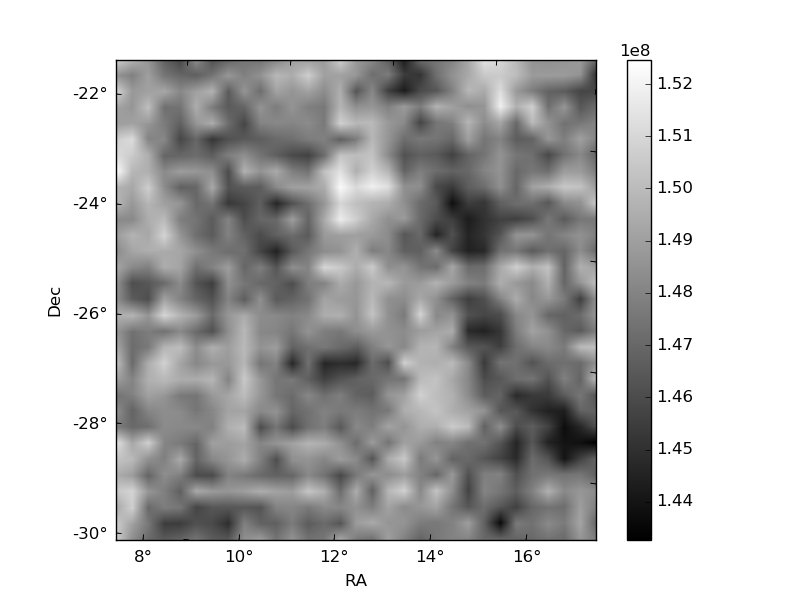
Quadrant B |
|---|---|---|---|
| Quadrant D | 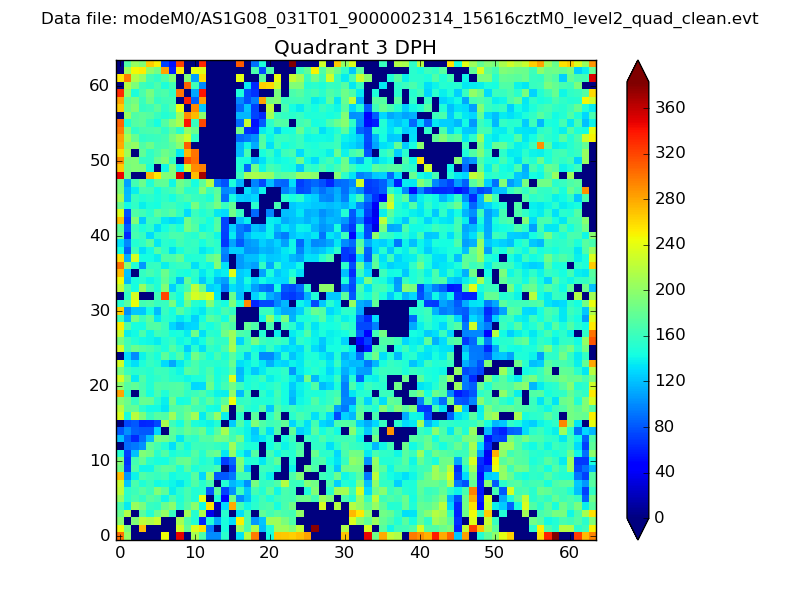 |
 |
Quadrant C |
| Plot type | Count rate plots | Images |
|---|---|---|
| Comparison with Poisson distribution Blue bars denote a histogram of data divided into 1 sec bins. Red curve is a Poisson curve with rate = median count rate of data. |
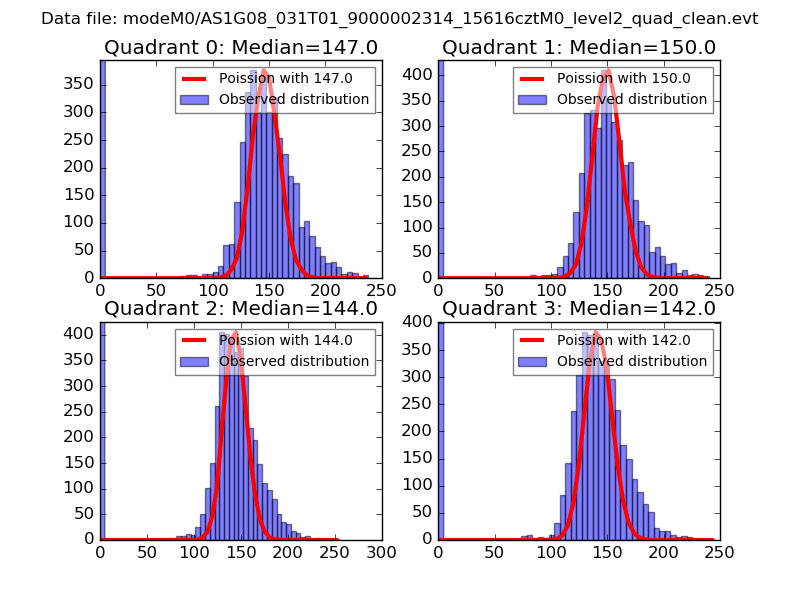 |
 |
| Quadrant-wise count rates Data is divided into 100 sec bins |
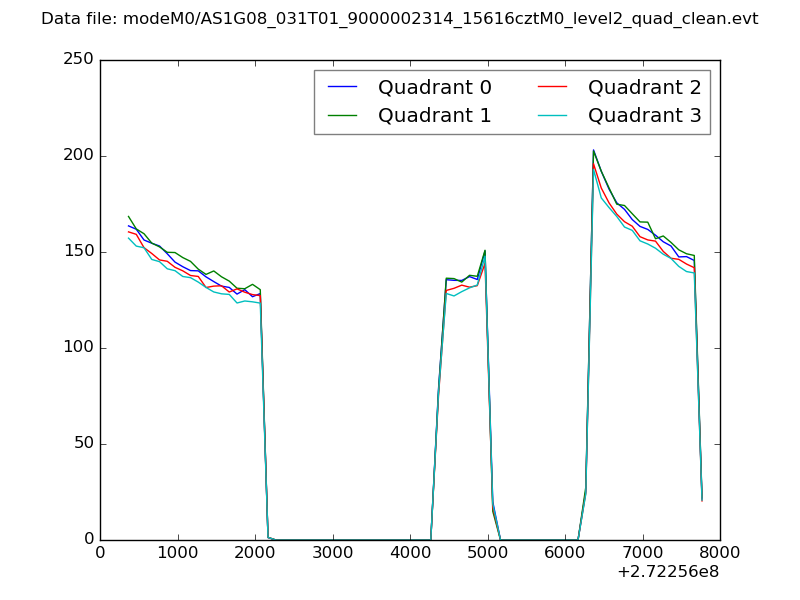 |
|
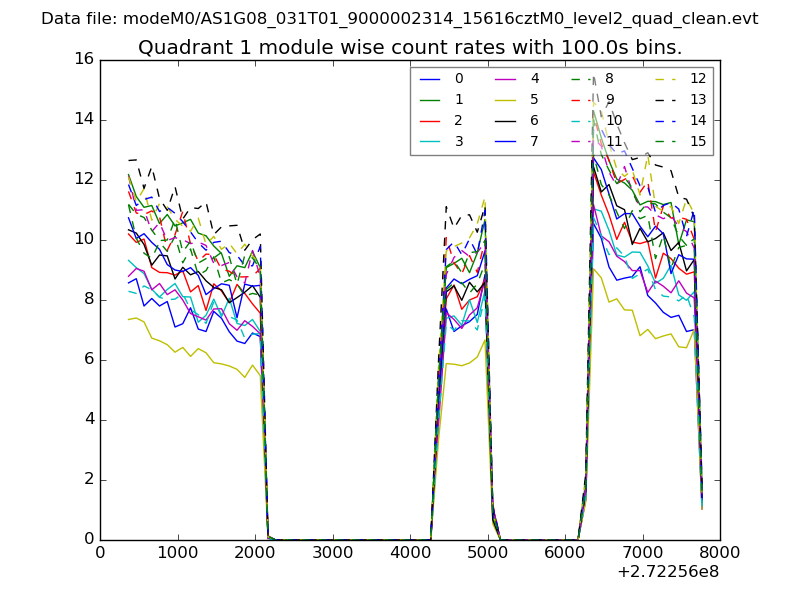
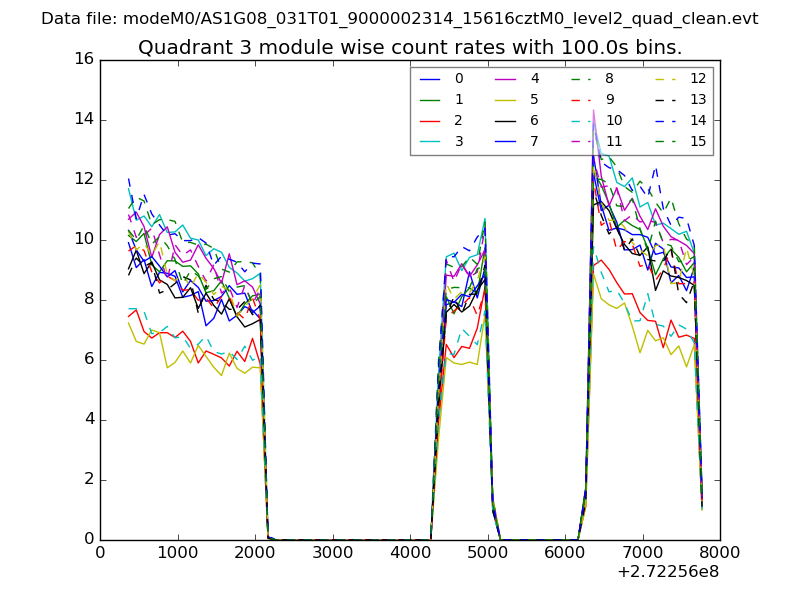
| Module-wise count rates for Quadrant A Data is divided into 100 sec bins |
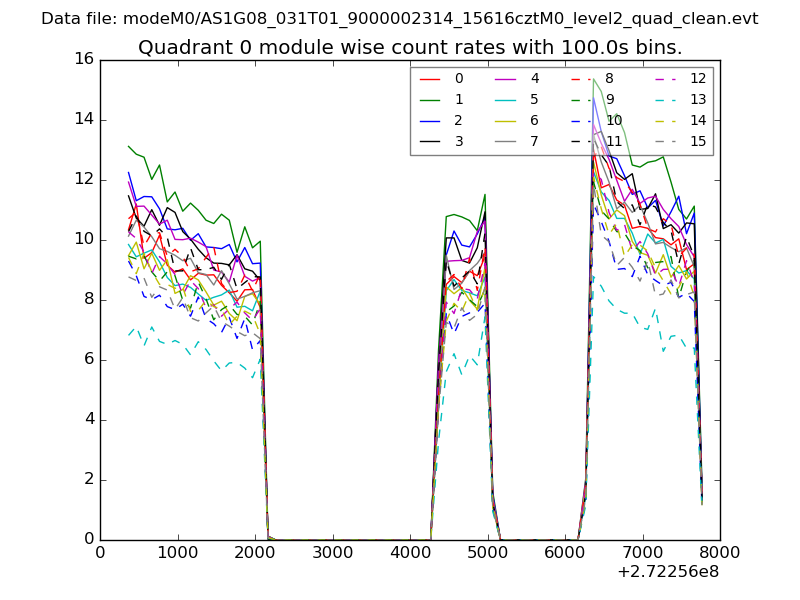 |
 |
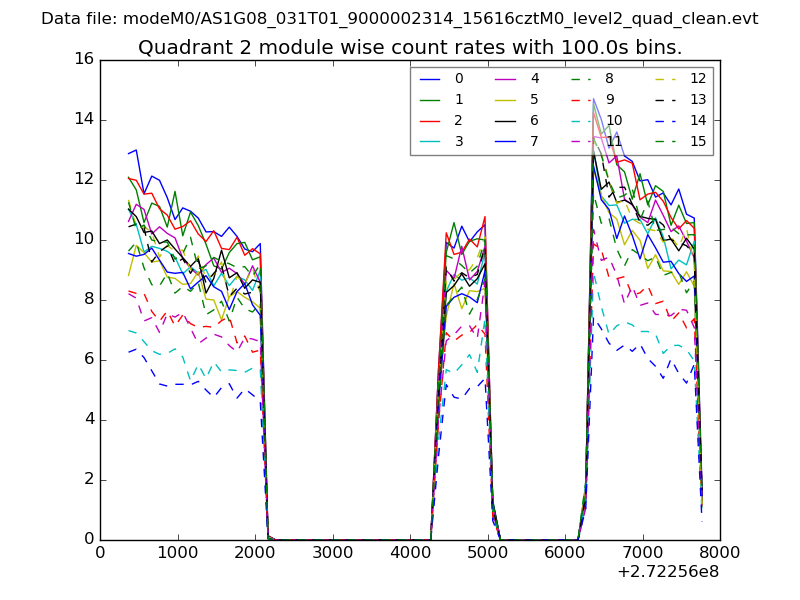
| Module-wise count rates for Quadrant B Data is divided into 100 sec bins |
 |
 |
| Module-wise count rates for Quadrant C Data is divided into 100 sec bins |
 |
 |
| Module-wise count rates for Quadrant D Data is divided into 100 sec bins |
 |
 |
| Parameter | Plot |
|---|---|
| CZT HV Monitor | 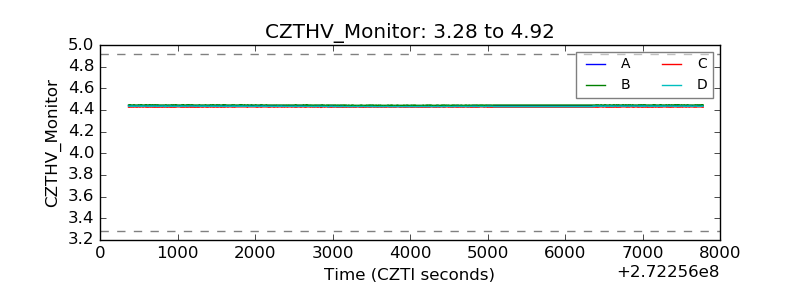 |
| D_VDD | 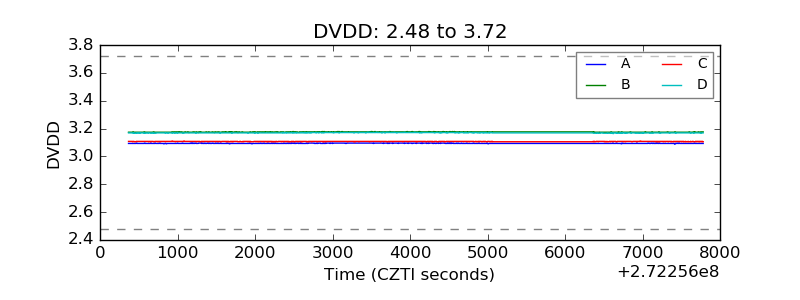 |
| Temperature 1 | 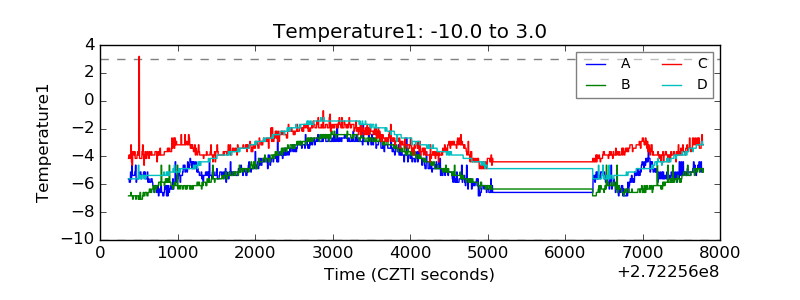 |
| Veto HV Monitor | 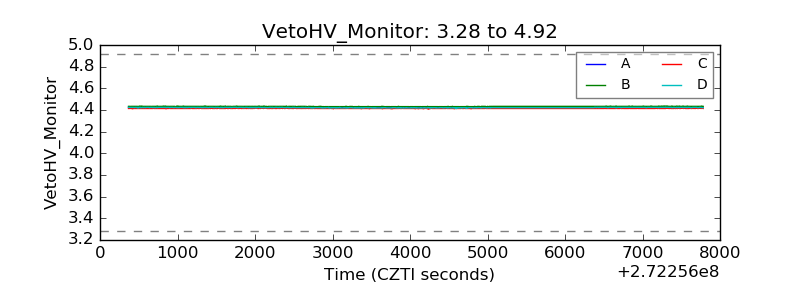 |
| Veto LLD | 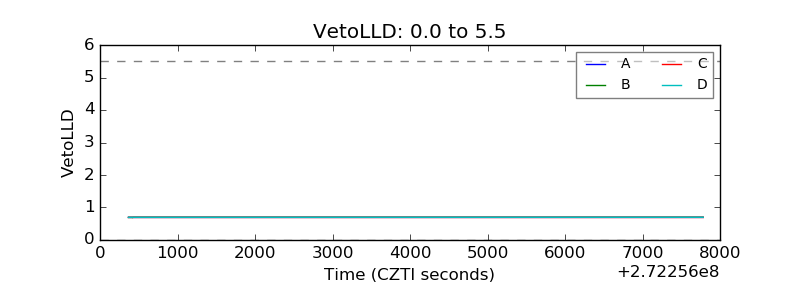 |
| Alpha Counter | 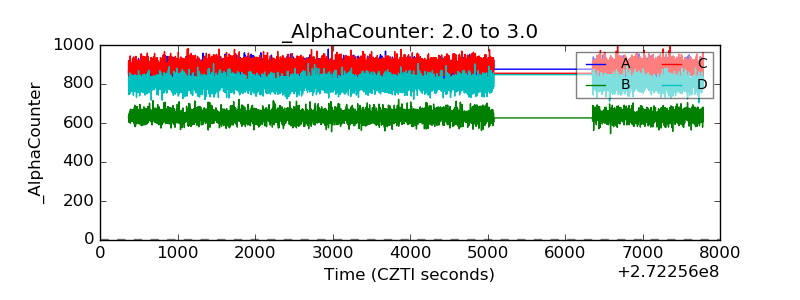 |
| _CPM_Rate | 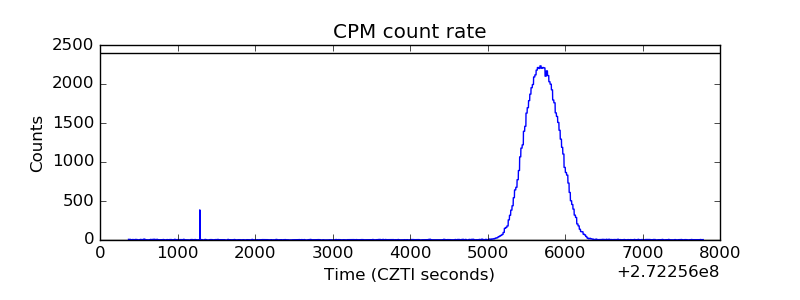 |
| CZT Counter | 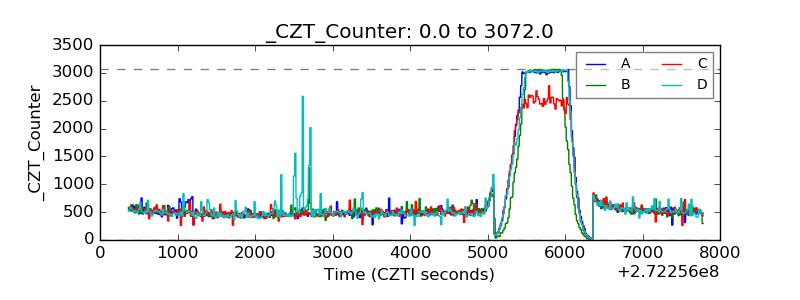 |
| +2.5 Volts monitor | 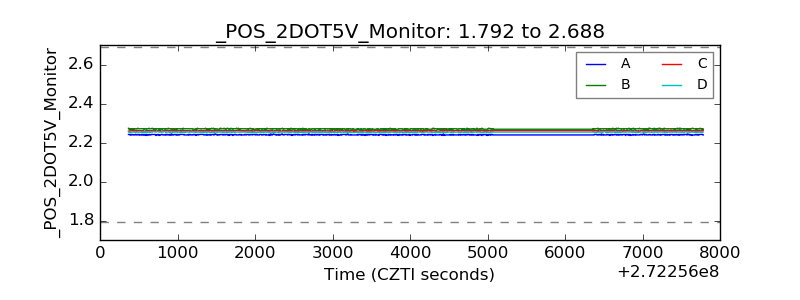 |
| +5 Volts monitor |  |
| _ROLL_ROT | 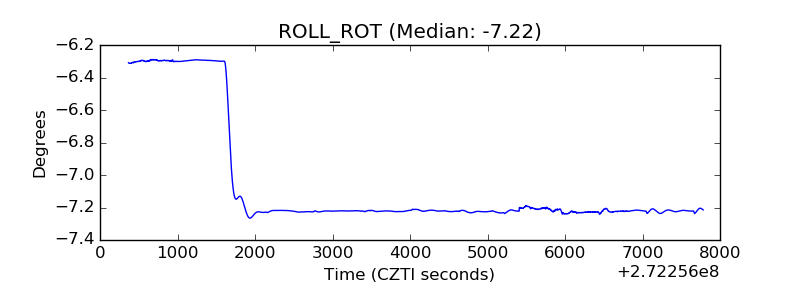 |
| _Roll_DEC | 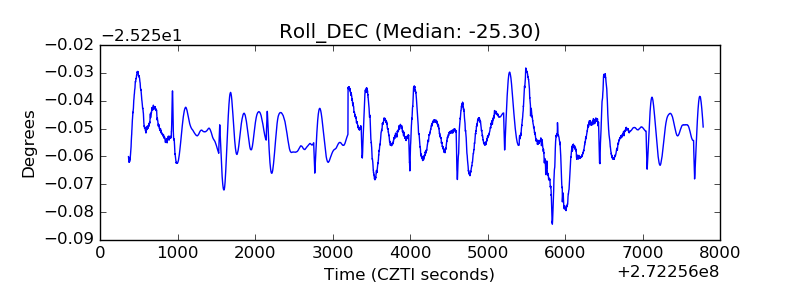 |
| _Roll_RA | 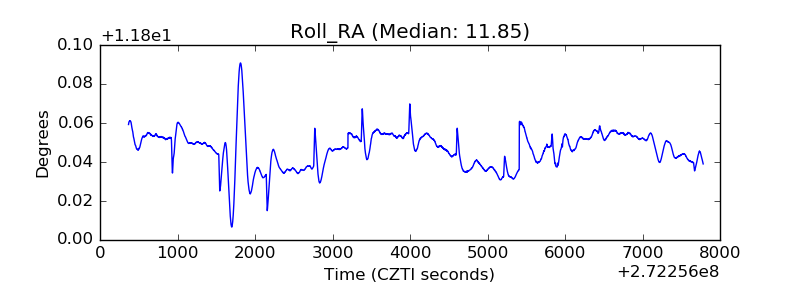 |
| Veto Counter | 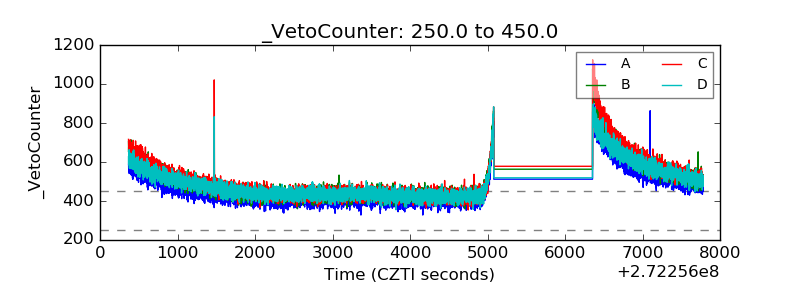 |