| Param | Original file | Final file |
|---|---|---|
| Filename | modeM0/AS1G08_031T01_9000002314_15619cztM0_level2.evt | modeM0/AS1G08_031T01_9000002314_15619cztM0_level2_quad_clean.evt |
| Size (bytes) | 275,388,480 | 39,464,640 |
| Size | 262.6 MB | 37.6 MB |
| Events in quadrant A | 1,931,535 | 237,947 |
| Events in quadrant B | 2,067,362 | 238,342 |
| Events in quadrant C | 1,918,778 | 227,219 |
| Events in quadrant D | 2,163,818 | 223,304 |
| Mode M9 | |||
|---|---|---|---|
| Quadrant | BADHDUFLAG | Total packets | Discarded packets |
| A | 0 | 3 | 0 |
| B | 0 | 3 | 0 |
| C | 0 | 3 | 0 |
| D | 0 | 4 | 0 |
| Mode M0 | |||
|---|---|---|---|
| Quadrant | BADHDUFLAG | Total packets | Discarded packets |
| A | 0 | 7910 | 1 |
| B | 0 | 8444 | 1 |
| C | 0 | 7900 | 1 |
| D | 0 | 8775 | 1 |
| Mode SS | |||
|---|---|---|---|
| Quadrant | BADHDUFLAG | Total packets | Discarded packets |
| A | 0 | 76 | 0 |
| B | 0 | 76 | 0 |
| C | 0 | 76 | 0 |
| D | 0 | 76 | 0 |
| Quadrant | Total seconds | Saturated seconds | Saturation percentage |
|---|---|---|---|
| A | 3786 | 24 | 0.633914% |
| B | 3786 | 28 | 0.739567% |
| C | 3786 | 29 | 0.765980% |
| D | 3786 | 57 | 1.505547% |
Noise dominated data is calculated using 1-second bins in cleaned event files. If a bin has >2000 counts, and if more than 50% of those come from <1% of pixels, then it is considered to be noise-dominated and hence unusable.
| Quadrant | # 1 sec bins | Bins with >0 counts | Bins with >2000 counts | High rate bins dominated by noise | Noise dominated (total time) | Noise dominated (detector-on time) | Marked lightcurve |
|---|---|---|---|---|---|---|---|
| A | 3787 | 3787 | 1 | 1 | 0.03% | 0.03% | 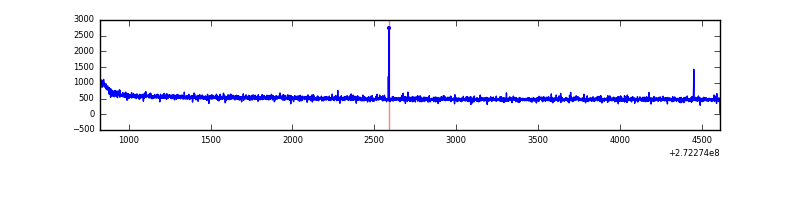 |
| B | 3787 | 3787 | 3 | 3 | 0.08% | 0.08% | 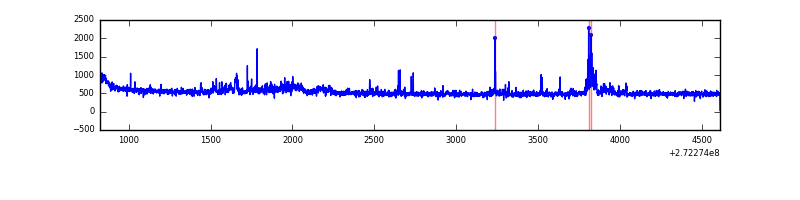 |
| C | 3787 | 3787 | 0 | 0 | 0.00% | 0.00% | 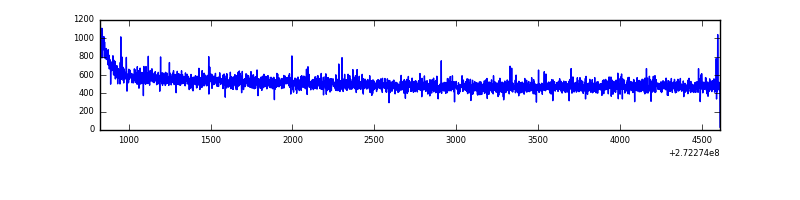 |
| D | 3787 | 3787 | 34 | 34 | 0.90% | 0.90% |  |
Top three noisy pixels from each quadrant. If the there are fewer than three noisy pixels in the level2.evt file, extra rows are filled as -1
| Pixel properties | Quadrant properties | ||||||
|---|---|---|---|---|---|---|---|
| Quadrant | DetID | PixID | Counts | Sigma | Mean | Median | Sigma |
| A | 0 | 226 | 4514 | 39.91 | 498 | 489 | 100.9 |
| A | 13 | 248 | 4490 | 39.67 | 498 | 489 | 100.9 |
| A | 15 | 222 | 4431 | 39.08 | 498 | 489 | 100.9 |
| B | 0 | 189 | 73118 | 777.48 | 490 | 480 | 93.4 |
| B | 0 | 197 | 27782 | 292.23 | 490 | 480 | 93.4 |
| B | 3 | 209 | 16336 | 169.71 | 490 | 480 | 93.4 |
| C | 14 | 238 | 75479 | 681.67 | 470 | 475 | 110.0 |
| C | 3 | 233 | 7027 | 59.55 | 470 | 475 | 110.0 |
| C | 13 | 61 | 3399 | 26.57 | 470 | 475 | 110.0 |
| D | 12 | 110 | 172217 | 1468.01 | 483 | 471 | 117.0 |
| D | 13 | 172 | 83236 | 707.44 | 483 | 471 | 117.0 |
| D | 10 | 70 | 29243 | 245.93 | 483 | 471 | 117.0 |
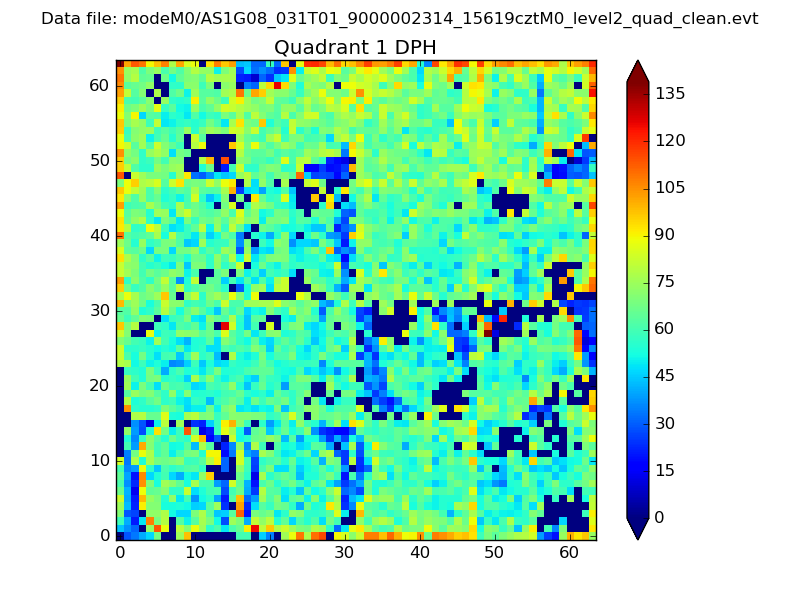
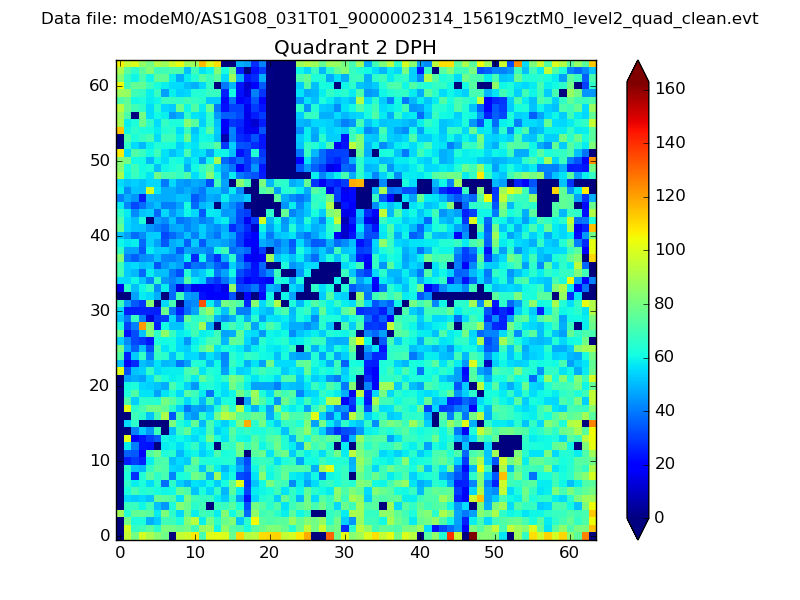
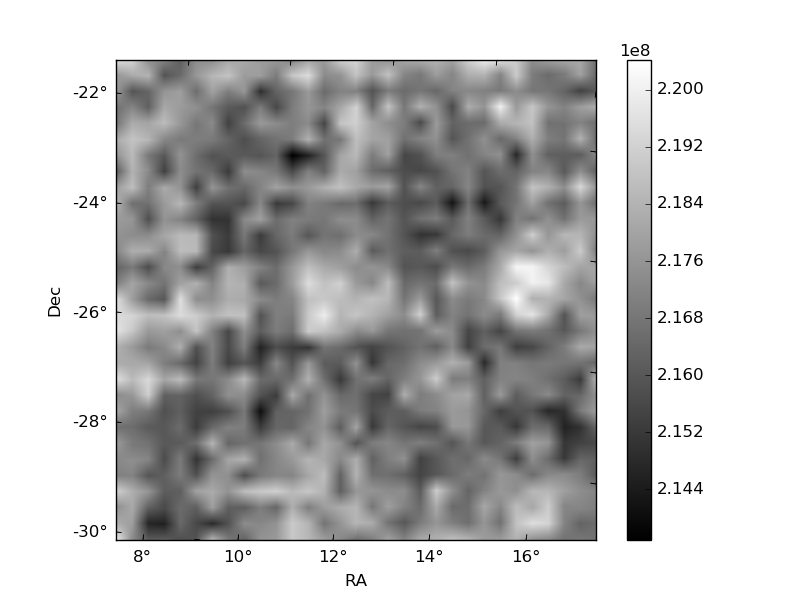
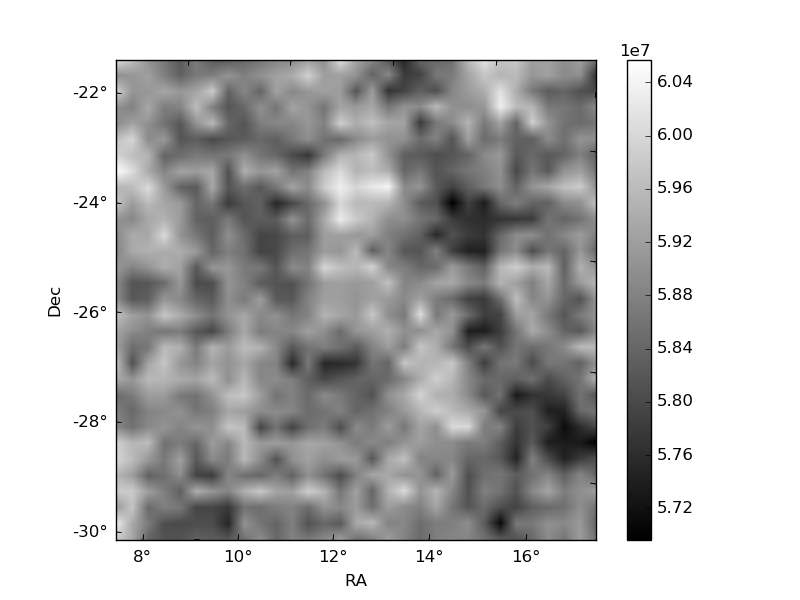
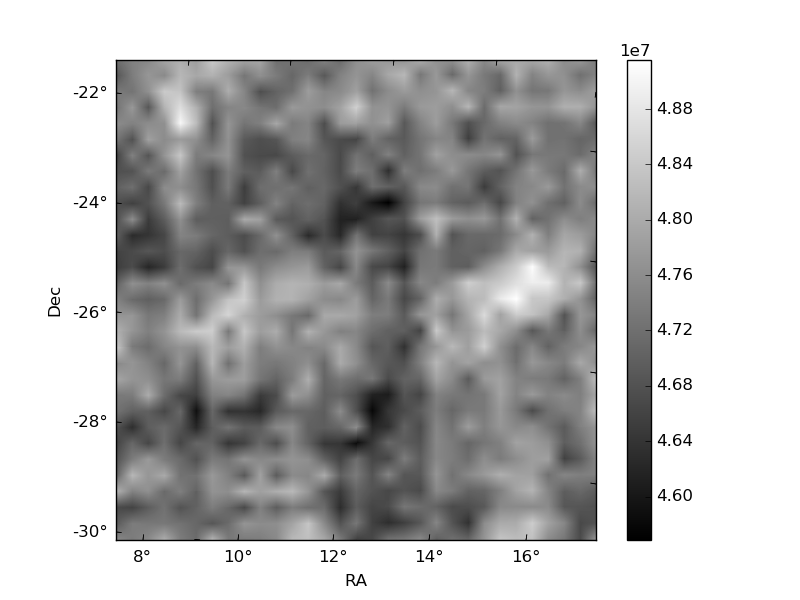
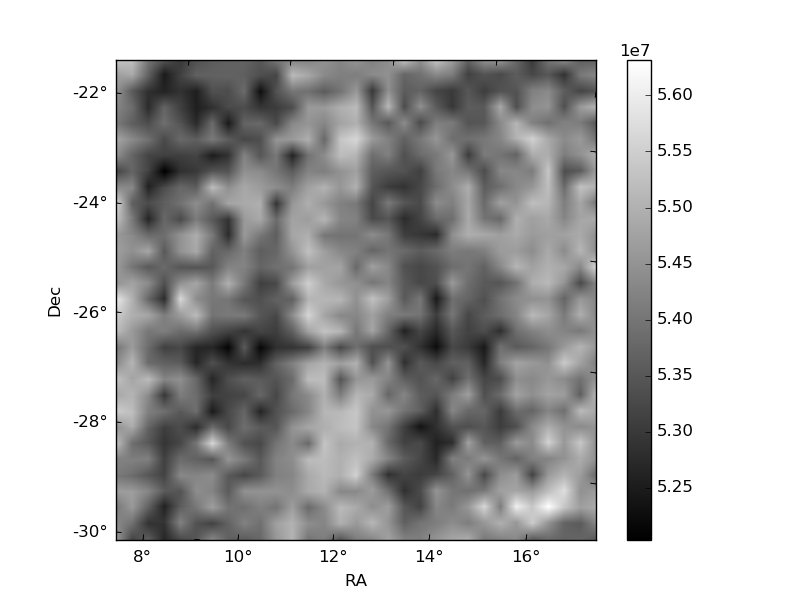
Histogram calculated using DETX and DETY for each event in the final _common_clean file
| Quadrant A | 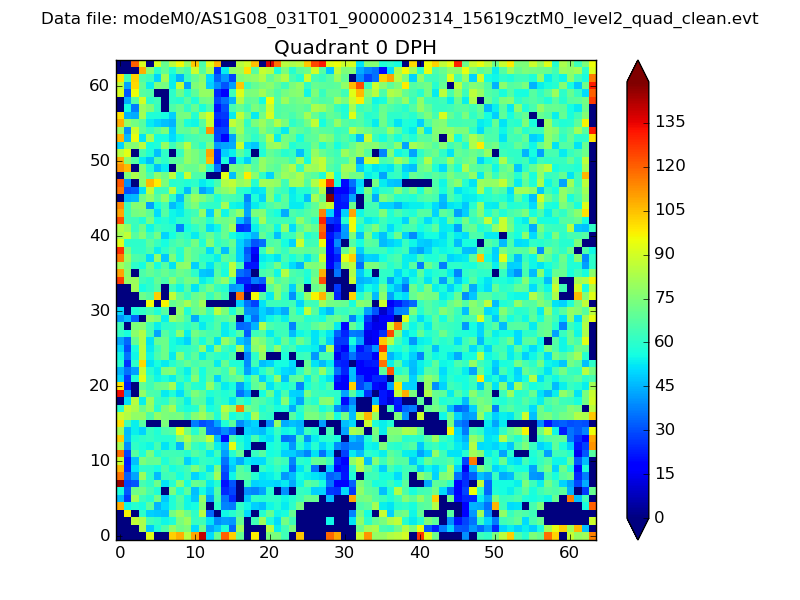 |
 |
Quadrant B |
|---|---|---|---|
| Quadrant D | 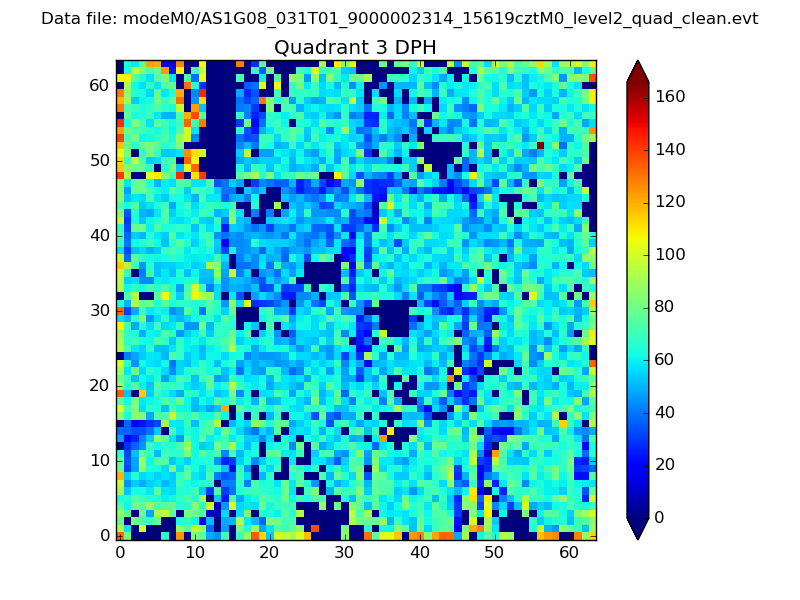 |
 |
Quadrant C |
| Plot type | Count rate plots | Images |
|---|---|---|
| Comparison with Poisson distribution Blue bars denote a histogram of data divided into 1 sec bins. Red curve is a Poisson curve with rate = median count rate of data. |
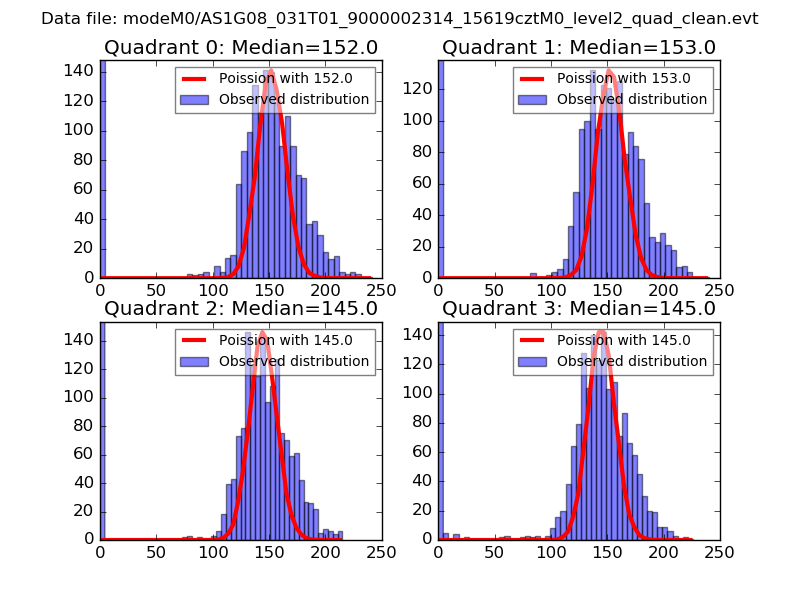 |
 |
| Quadrant-wise count rates Data is divided into 100 sec bins |
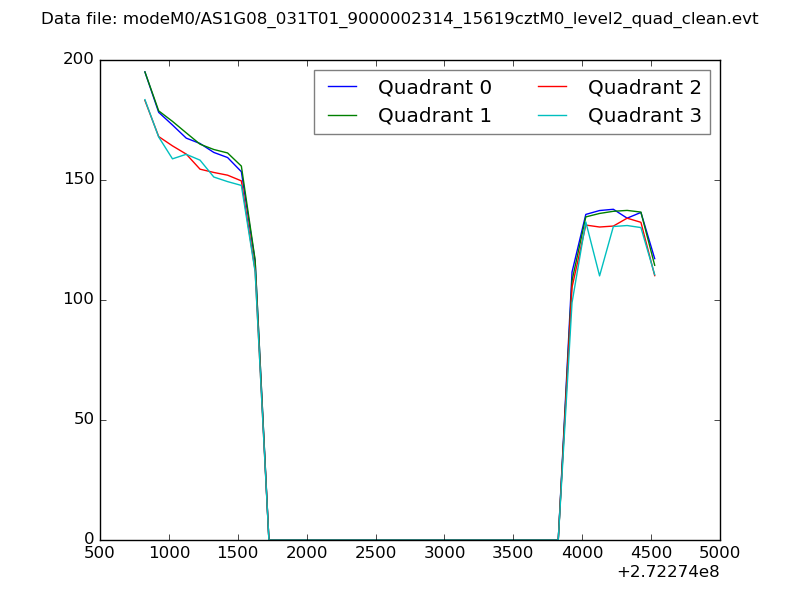 |
|
| Module-wise count rates for Quadrant A Data is divided into 100 sec bins |
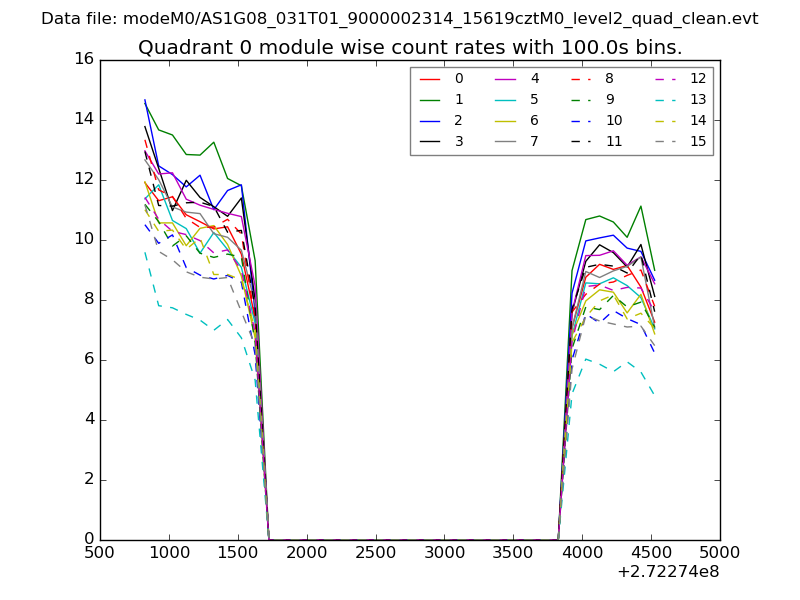 |
 |
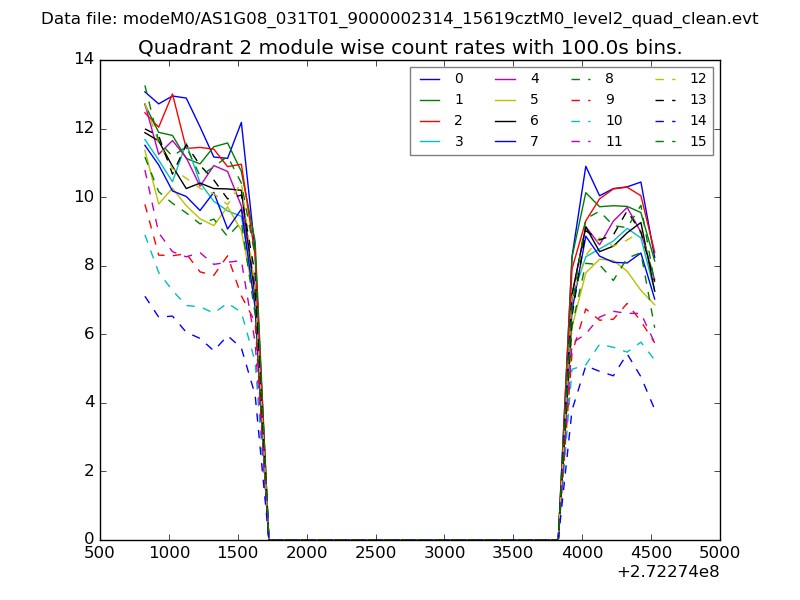
| Module-wise count rates for Quadrant B Data is divided into 100 sec bins |
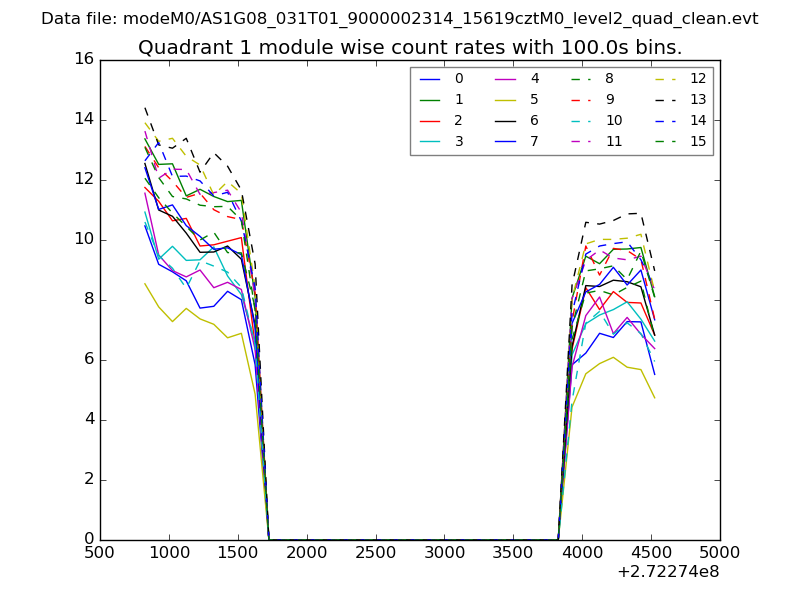 |
 |
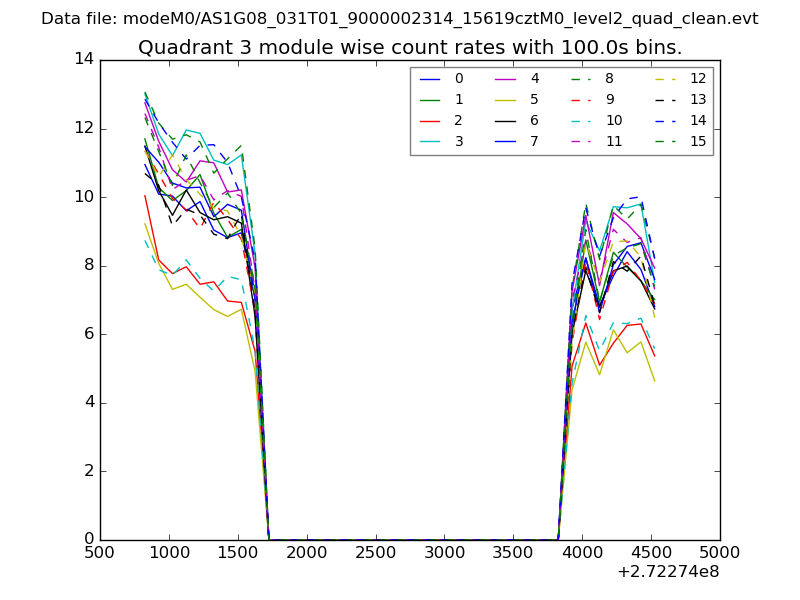
| Module-wise count rates for Quadrant C Data is divided into 100 sec bins |
 |
 |
| Module-wise count rates for Quadrant D Data is divided into 100 sec bins |
 |
 |
| Parameter | Plot |
|---|---|
| CZT HV Monitor | 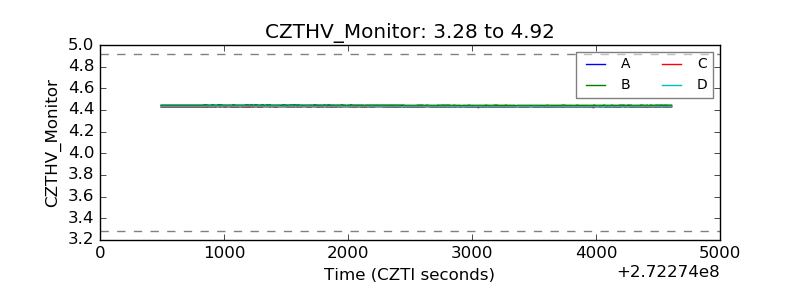 |
| D_VDD |  |
| Temperature 1 | 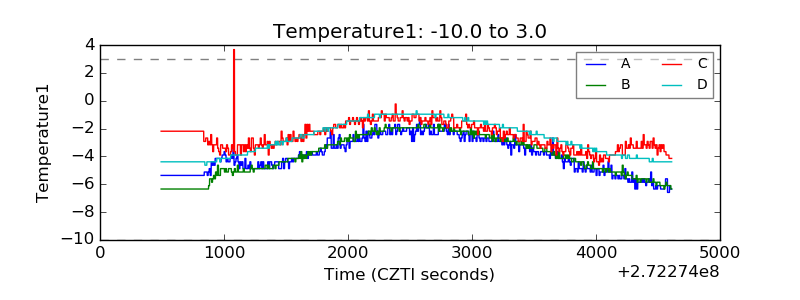 |
| Veto HV Monitor | 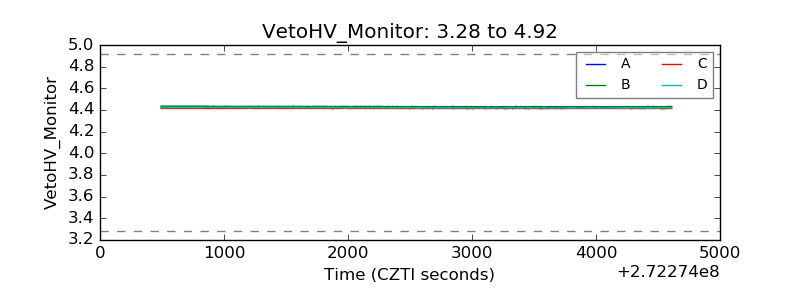 |
| Veto LLD | 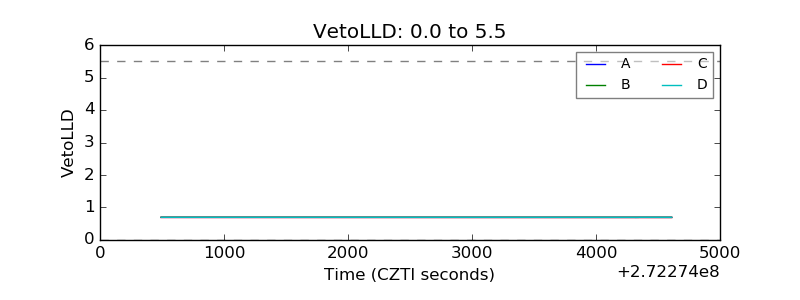 |
| Alpha Counter | 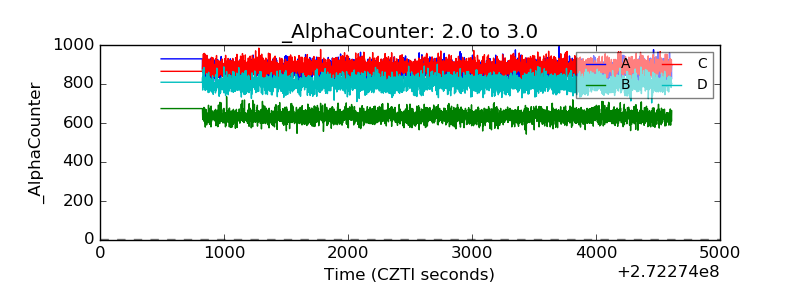 |
| _CPM_Rate | 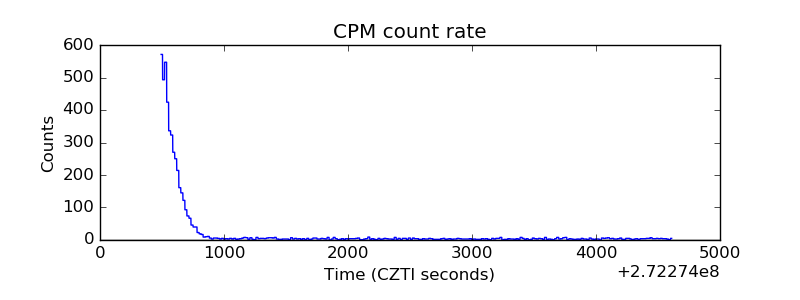 |
| CZT Counter | 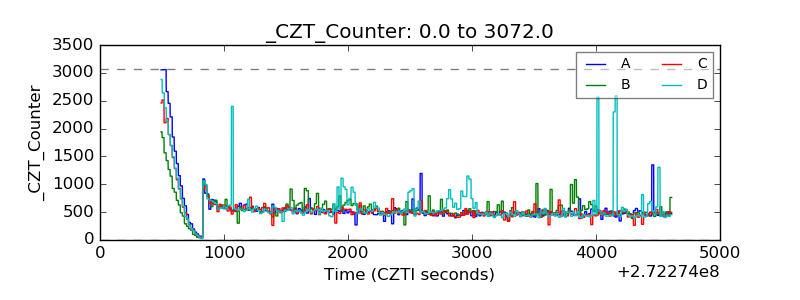 |
| +2.5 Volts monitor |  |
| +5 Volts monitor |  |
| _ROLL_ROT | 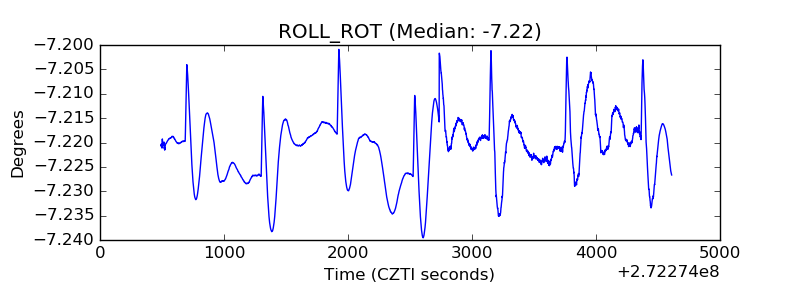 |
| _Roll_DEC | 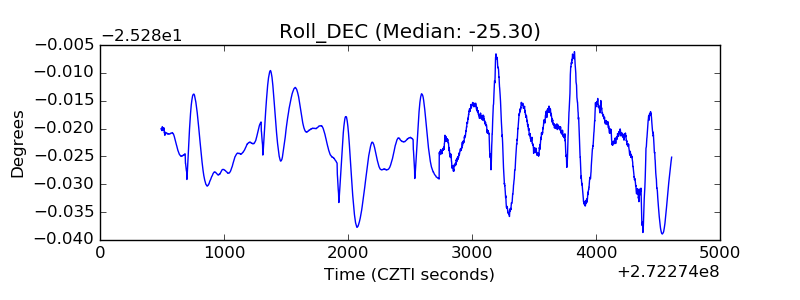 |
| _Roll_RA | 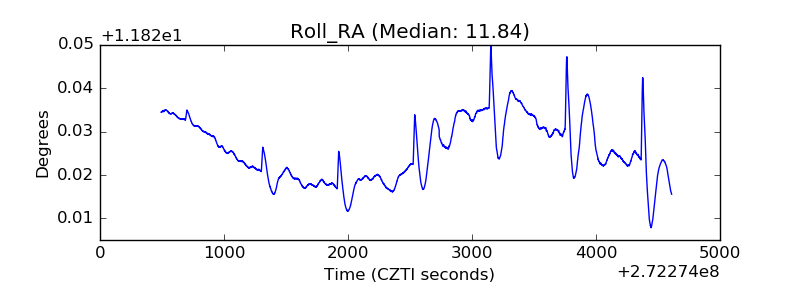 |
| Veto Counter | 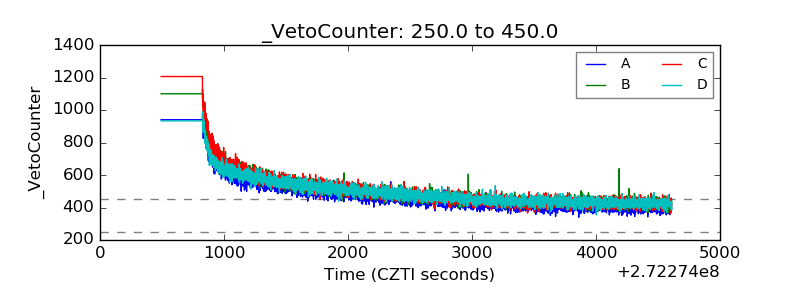 |