| Param | Original file | Final file |
|---|---|---|
| Filename | modeM0/AS1T02_086T01_9000002316cztM0_level2.fits | modeM0/AS1T02_086T01_9000002316cztM0_level2_quad_clean.evt |
| Size (bytes) | 1,791,316,800 | 1,838,361,600 |
| Size | 1.7 GB | 1.7 GB |
| Events in quadrant A | 10,947,302 | 11,201,488 |
| Events in quadrant B | 10,499,330 | 11,192,297 |
| Events in quadrant C | 10,776,172 | 10,902,475 |
| Events in quadrant D | 9,293,928 | 9,650,645 |
| Mode SS | |||
|---|---|---|---|
| Quadrant | BADHDUFLAG | Total packets | Discarded packets |
| A | 0 | 3778 | 0 |
| B | 0 | 3778 | 0 |
| C | 0 | 3778 | 0 |
| D | 0 | 3778 | 0 |
| Mode M9 | |||
|---|---|---|---|
| Quadrant | BADHDUFLAG | Total packets | Discarded packets |
| A | 0 | 277 | 0 |
| B | 0 | 277 | 0 |
| C | 0 | 277 | 0 |
| D | 0 | 277 | 0 |
| Mode M0 | |||
|---|---|---|---|
| Quadrant | BADHDUFLAG | Total packets | Discarded packets |
| A | 0 | 388381 | 0 |
| B | 0 | 392716 | 0 |
| C | 0 | 397525 | 0 |
| D | 0 | 475876 | 0 |
| Quadrant | Total seconds | Saturated seconds | Saturation percentage |
|---|---|---|---|
| A | 185866 | 2427 | 1.305779% |
| B | 185866 | 2654 | 1.427910% |
| C | 185866 | 3241 | 1.743729% |
| D | 185866 | 8719 | 4.691014% |
Noise dominated data is calculated using 1-second bins in cleaned event files. If a bin has >2000 counts, and if more than 50% of those come from <1% of pixels, then it is considered to be noise-dominated and hence unusable.
| Quadrant | # 1 sec bins | Bins with >0 counts | Bins with >2000 counts | High rate bins dominated by noise | Noise dominated (total time) | Noise dominated (detector-on time) | Marked lightcurve |
|---|---|---|---|---|---|---|---|
| A | 213200 | 185823 | 0 | 0 | 0.00% | 0.00% | 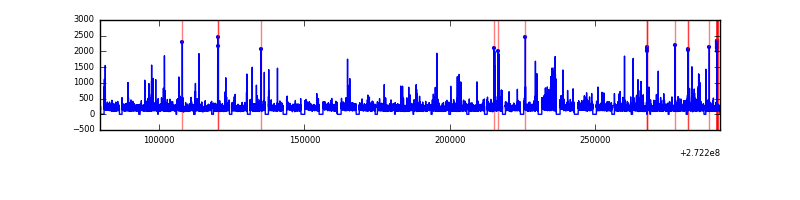 |
| B | 213200 | 185836 | 0 | 0 | 0.00% | 0.00% |  |
| C | 213201 | 185833 | 0 | 0 | 0.00% | 0.00% | 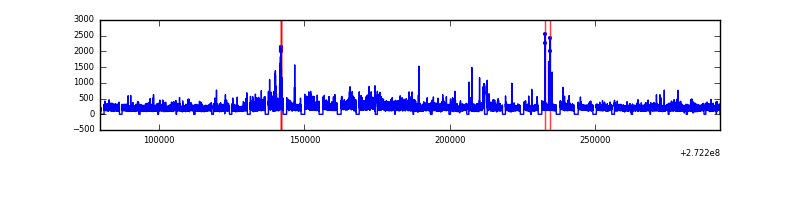 |
| D | 213200 | 185706 | 0 | 0 | 0.00% | 0.00% | 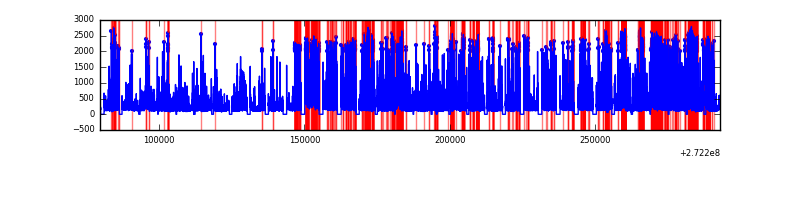 |
Top three noisy pixels from each quadrant. If the there are fewer than three noisy pixels in the level2.evt file, extra rows are filled as -1
| Pixel properties | Quadrant properties | ||||||
|---|---|---|---|---|---|---|---|
| Quadrant | DetID | PixID | Counts | Sigma | Mean | Median | Sigma |
| A | 0 | 29 | 10368 | 11.08 | 2851 | 2683 | 693.4 |
| A | 7 | 110 | 8706 | 8.69 | 2851 | 2683 | 693.4 |
| A | 9 | 19 | 8233 | 8.0 | 2851 | 2683 | 693.4 |
| B | 2 | 9 | 8325 | 10.6 | 2780 | 2662 | 534.5 |
| B | 2 | 8 | 7170 | 8.43 | 2780 | 2662 | 534.5 |
| B | 3 | 17 | 7012 | 8.14 | 2780 | 2662 | 534.5 |
| C | 12 | 241 | 7379 | 6.53 | 2849 | 2661 | 722.5 |
| C | 2 | 191 | 7184 | 6.26 | 2849 | 2661 | 722.5 |
| C | 3 | 126 | 7156 | 6.22 | 2849 | 2661 | 722.5 |
| D | 6 | 231 | 6715 | 6.17 | 2651 | 2414 | 697.0 |
| D | 3 | 14 | 6683 | 6.12 | 2651 | 2414 | 697.0 |
| D | 10 | 189 | 6481 | 5.84 | 2651 | 2414 | 697.0 |
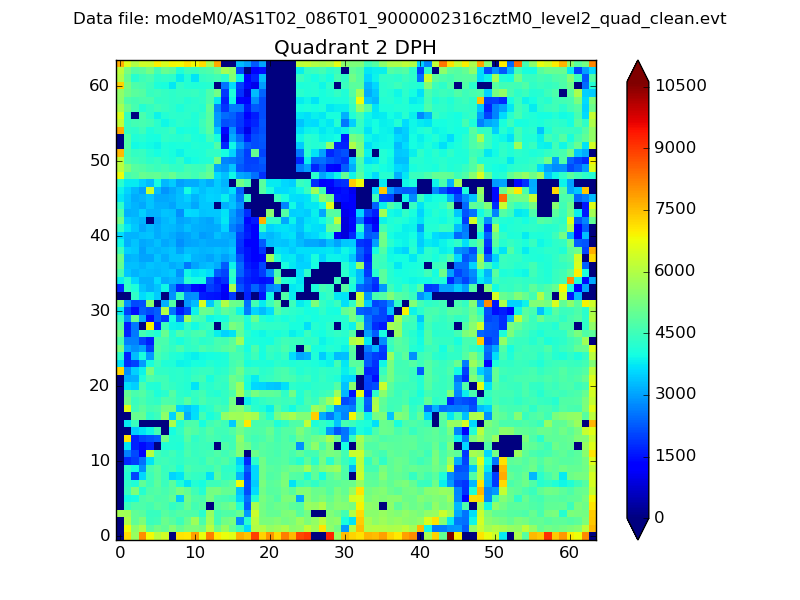
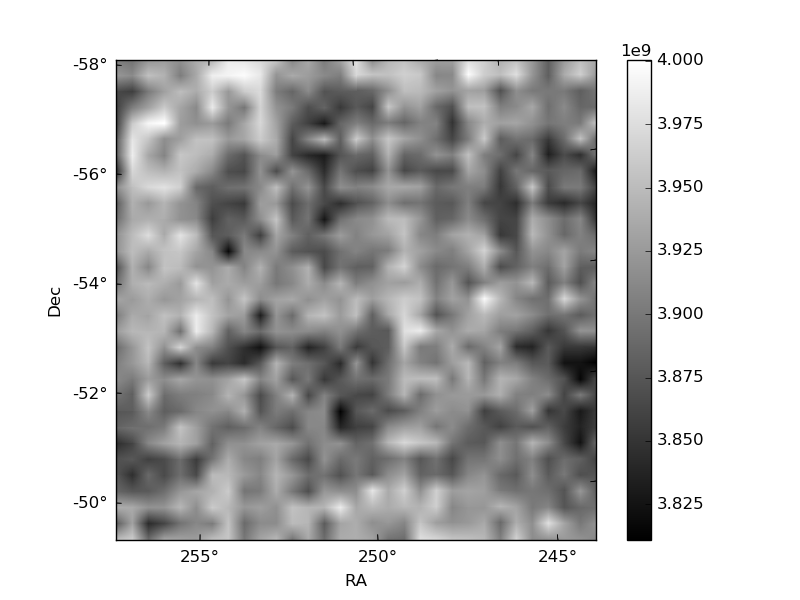
Histogram calculated using DETX and DETY for each event in the final _common_clean file
| Quadrant A | 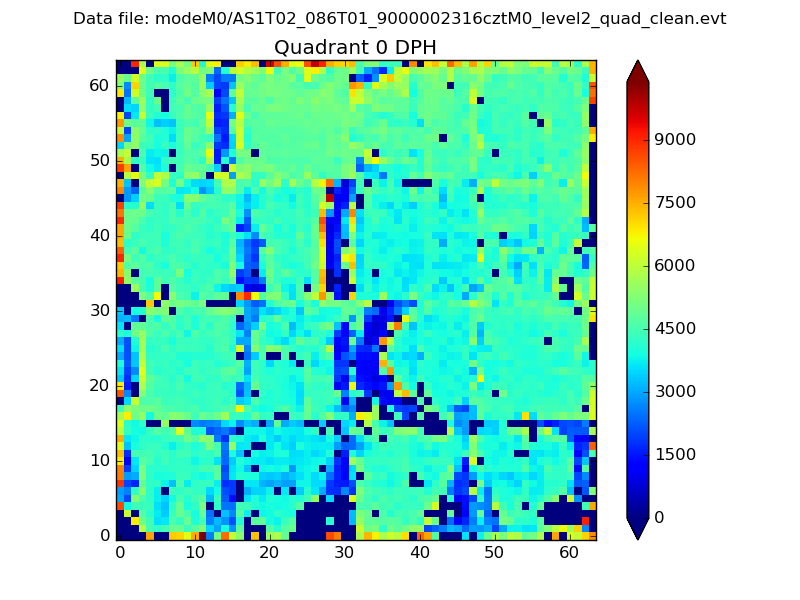 |
 |
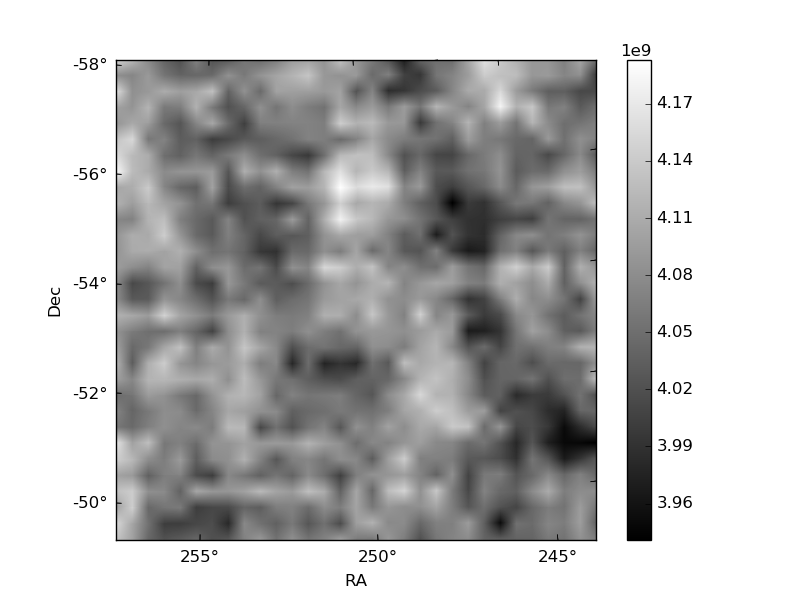
Quadrant B |
|---|---|---|---|
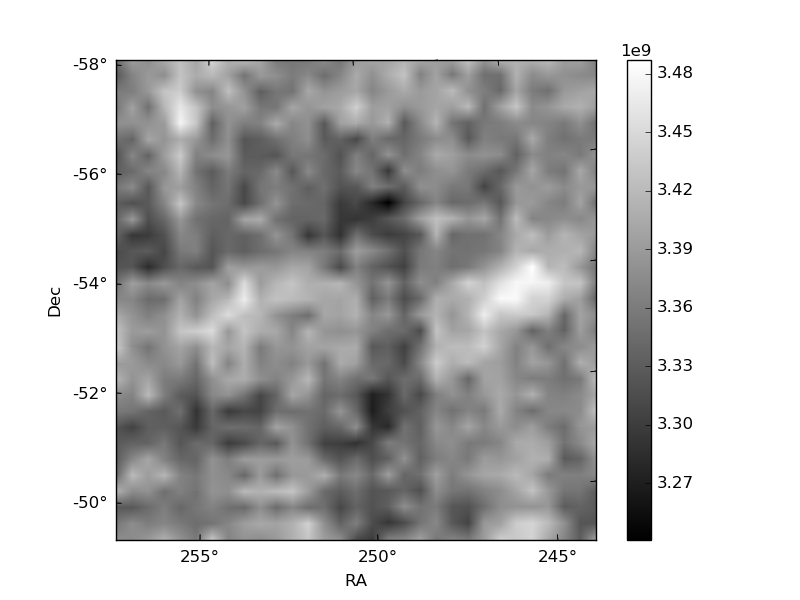
| Quadrant D | 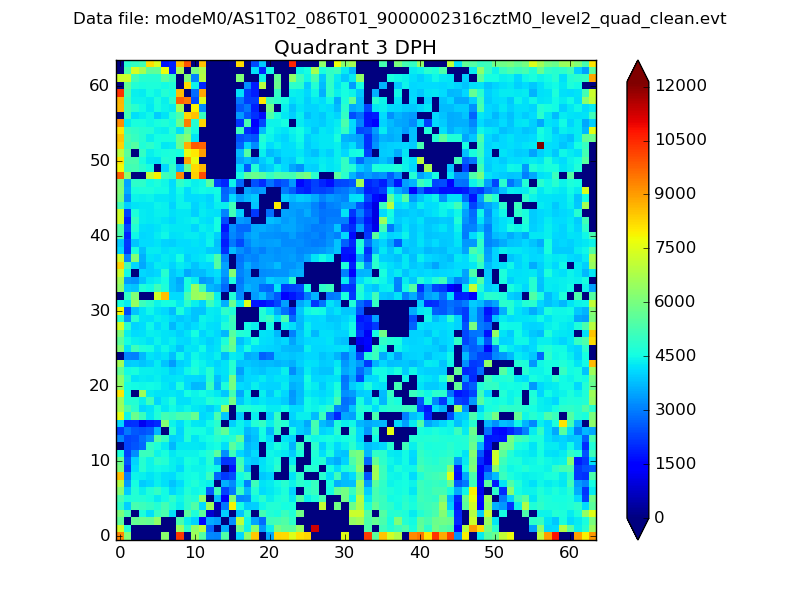 |
 |
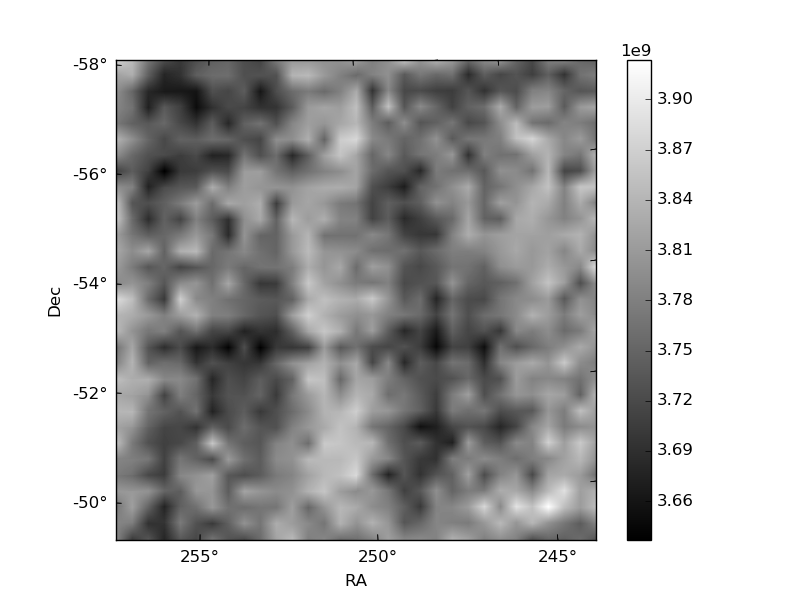
Quadrant C |
| Plot type | Count rate plots | Images |
|---|---|---|
| Comparison with Poisson distribution Blue bars denote a histogram of data divided into 1 sec bins. Red curve is a Poisson curve with rate = median count rate of data. |
 |
 |
| Quadrant-wise count rates Data is divided into 100 sec bins |
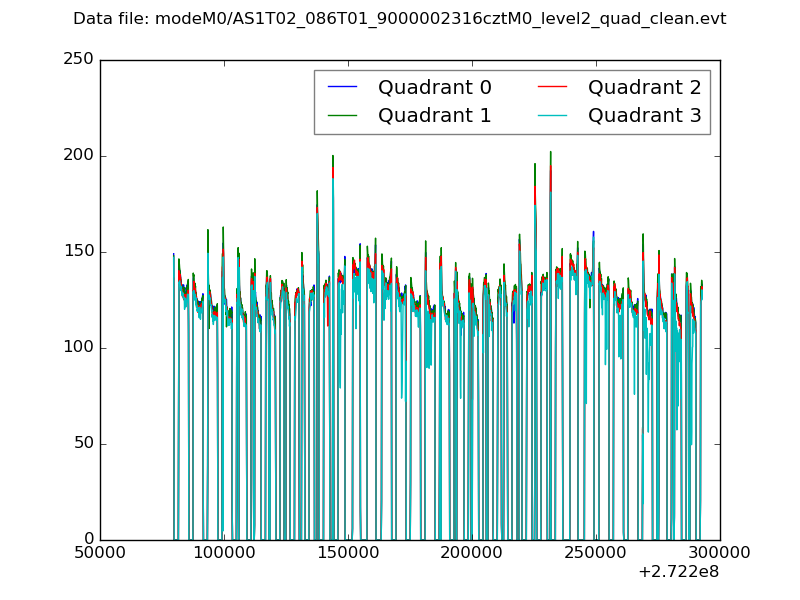 |
|
| Module-wise count rates for Quadrant A Data is divided into 100 sec bins |
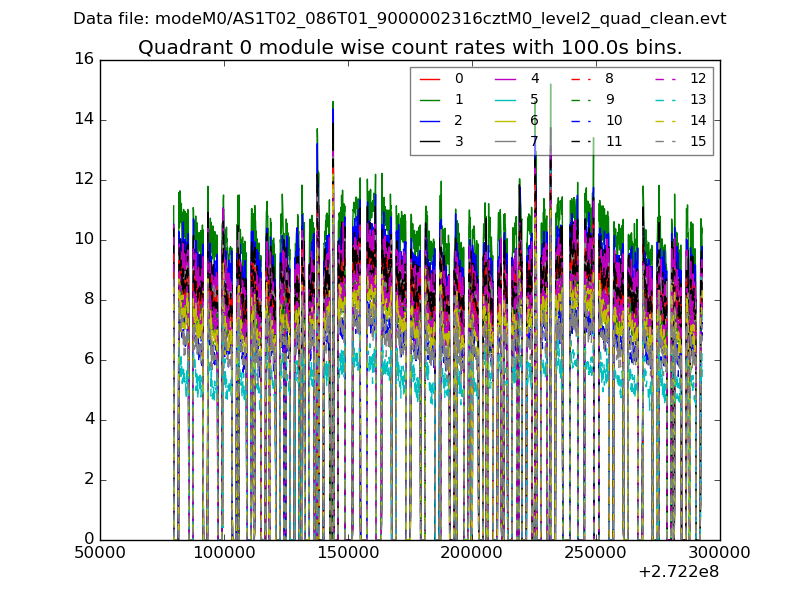 |
 |
| Module-wise count rates for Quadrant B Data is divided into 100 sec bins |
 |
 |
| Module-wise count rates for Quadrant C Data is divided into 100 sec bins |
 |
 |
| Module-wise count rates for Quadrant D Data is divided into 100 sec bins |
 |
 |
| Parameter | Plot |
|---|---|
| CZT HV Monitor |  |
| D_VDD | 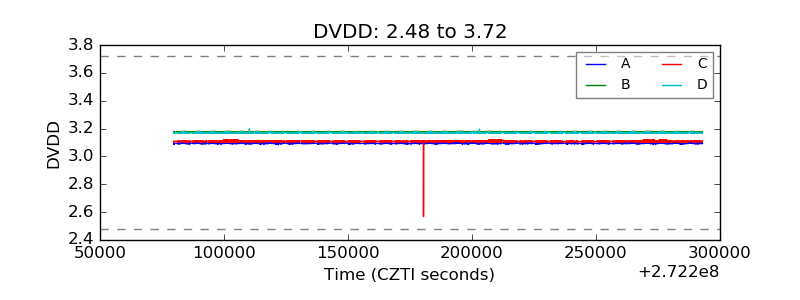 |
| Temperature 1 |  |
| Veto HV Monitor | 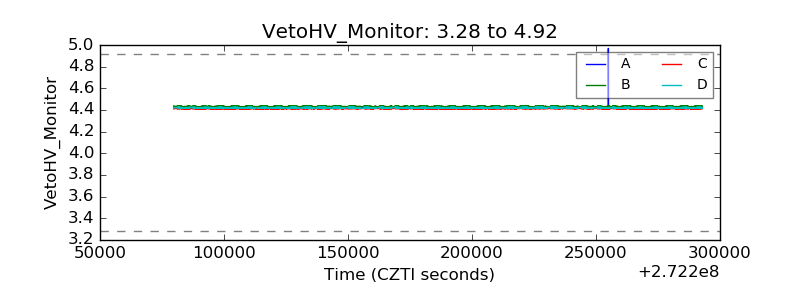 |
| Veto LLD |  |
| Alpha Counter | 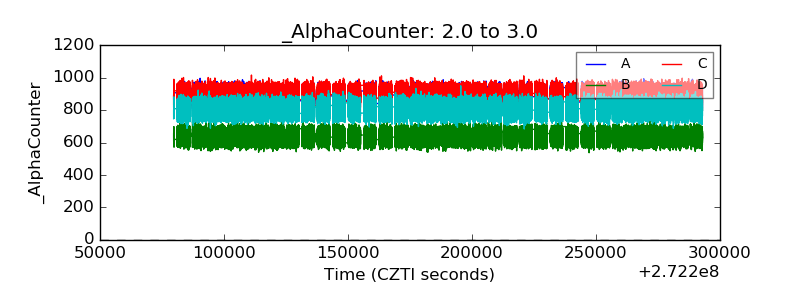 |
| _CPM_Rate | 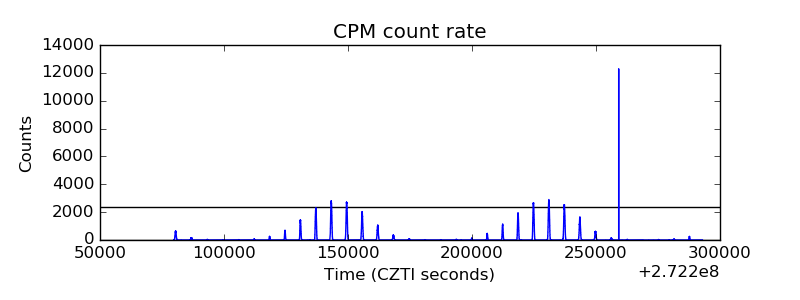 |
| CZT Counter |  |
| +2.5 Volts monitor | 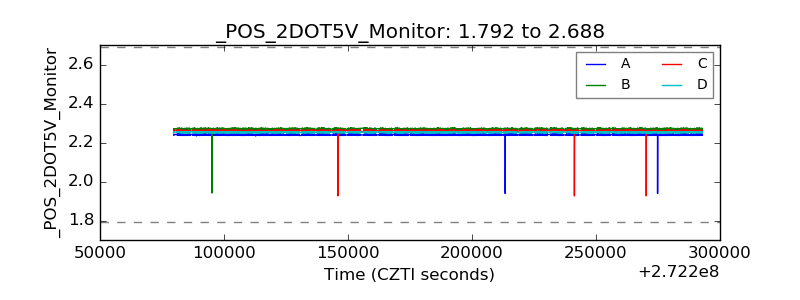 |
| +5 Volts monitor | 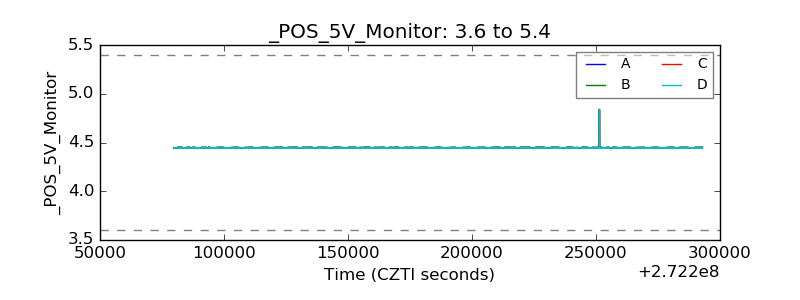 |
| _ROLL_ROT | 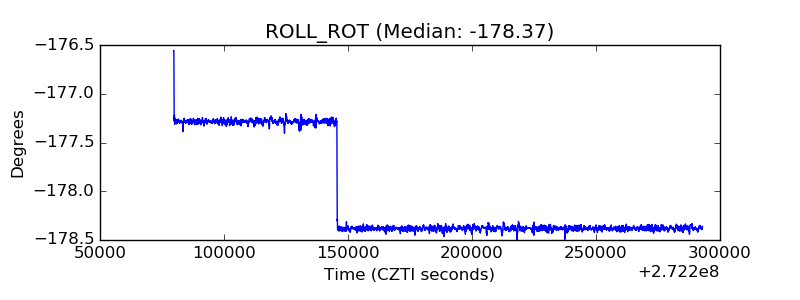 |
| _Roll_DEC | 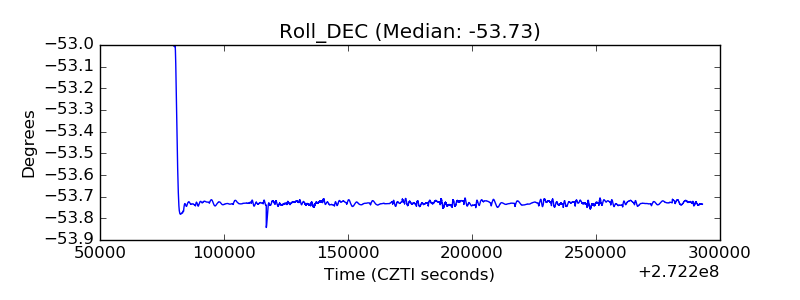 |
| _Roll_RA | 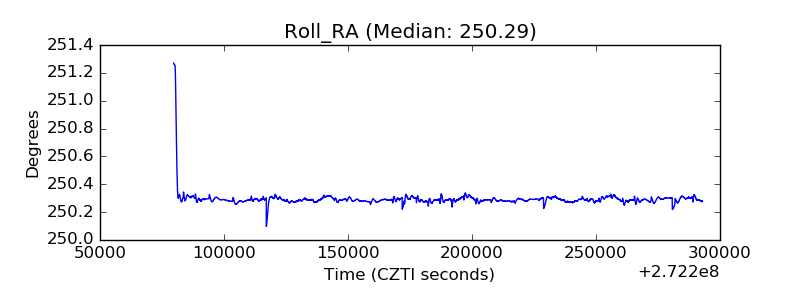 |
| Veto Counter | 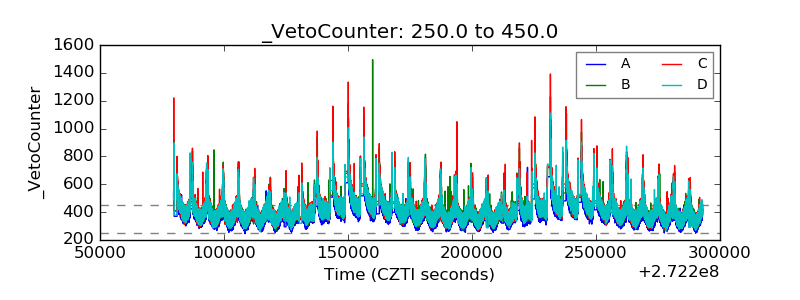 |