| Param | Original file | Final file |
|---|---|---|
| Filename | modeM0/AS1T02_086T01_9000002316_15621cztM0_level2.evt | modeM0/AS1T02_086T01_9000002316_15621cztM0_level2_quad_clean.evt |
| Size (bytes) | 466,179,840 | 107,850,240 |
| Size | 444.6 MB | 102.9 MB |
| Events in quadrant A | 3,267,463 | 702,035 |
| Events in quadrant B | 3,582,294 | 705,914 |
| Events in quadrant C | 3,266,485 | 694,483 |
| Events in quadrant D | 3,530,135 | 680,388 |
| Mode SS | |||
|---|---|---|---|
| Quadrant | BADHDUFLAG | Total packets | Discarded packets |
| A | 0 | 142 | 0 |
| B | 0 | 142 | 0 |
| C | 0 | 142 | 0 |
| D | 0 | 142 | 0 |
| Mode M9 | |||
|---|---|---|---|
| Quadrant | BADHDUFLAG | Total packets | Discarded packets |
| A | 0 | 4 | 0 |
| B | 0 | 4 | 0 |
| C | 0 | 4 | 0 |
| D | 0 | 4 | 0 |
| Mode M0 | |||
|---|---|---|---|
| Quadrant | BADHDUFLAG | Total packets | Discarded packets |
| A | 0 | 14259 | 2 |
| B | 0 | 14992 | 1 |
| C | 0 | 14279 | 1 |
| D | 0 | 14924 | 1 |
| Quadrant | Total seconds | Saturated seconds | Saturation percentage |
|---|---|---|---|
| A | 6937 | 118 | 1.701023% |
| B | 6937 | 178 | 2.565951% |
| C | 6937 | 130 | 1.874009% |
| D | 6937 | 103 | 1.484792% |
Noise dominated data is calculated using 1-second bins in cleaned event files. If a bin has >2000 counts, and if more than 50% of those come from <1% of pixels, then it is considered to be noise-dominated and hence unusable.
| Quadrant | # 1 sec bins | Bins with >0 counts | Bins with >2000 counts | High rate bins dominated by noise | Noise dominated (total time) | Noise dominated (detector-on time) | Marked lightcurve |
|---|---|---|---|---|---|---|---|
| A | 7418 | 6938 | 0 | 0 | 0.00% | 0.00% | 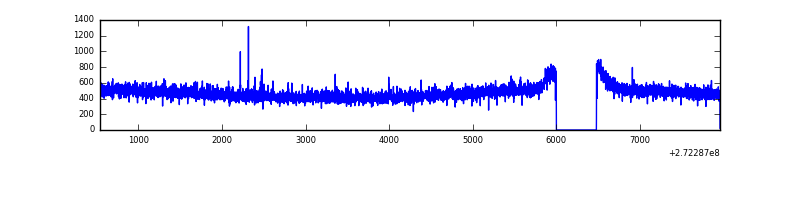 |
| B | 7418 | 6938 | 37 | 37 | 0.50% | 0.53% | 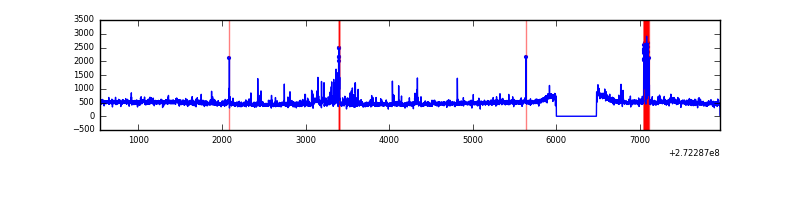 |
| C | 7418 | 6938 | 0 | 0 | 0.00% | 0.00% | 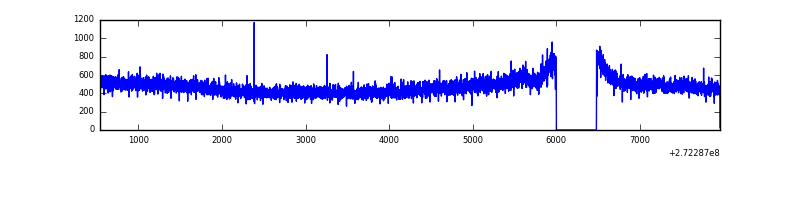 |
| D | 7418 | 6938 | 13 | 13 | 0.18% | 0.19% | 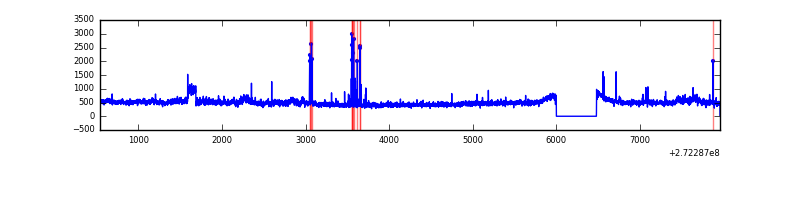 |
Top three noisy pixels from each quadrant. If the there are fewer than three noisy pixels in the level2.evt file, extra rows are filled as -1
| Pixel properties | Quadrant properties | ||||||
|---|---|---|---|---|---|---|---|
| Quadrant | DetID | PixID | Counts | Sigma | Mean | Median | Sigma |
| A | 3 | 80 | 23199 | 131.37 | 840 | 824 | 170.3 |
| A | 0 | 226 | 7511 | 39.26 | 840 | 824 | 170.3 |
| A | 12 | 194 | 6357 | 32.49 | 840 | 824 | 170.3 |
| B | 5 | 65 | 136997 | 862.68 | 832 | 814 | 157.9 |
| B | 3 | 209 | 54020 | 337.05 | 832 | 814 | 157.9 |
| B | 0 | 197 | 40820 | 253.43 | 832 | 814 | 157.9 |
| C | 14 | 238 | 124297 | 663.29 | 801 | 804 | 186.2 |
| C | 3 | 233 | 12202 | 61.22 | 801 | 804 | 186.2 |
| C | 13 | 61 | 5683 | 26.21 | 801 | 804 | 186.2 |
| D | 1 | 52 | 323629 | 1628.48 | 818 | 791 | 198.2 |
| D | 13 | 172 | 51663 | 256.61 | 818 | 791 | 198.2 |
| D | 2 | 234 | 29986 | 147.27 | 818 | 791 | 198.2 |
Histogram calculated using DETX and DETY for each event in the final _common_clean file
| Quadrant A | 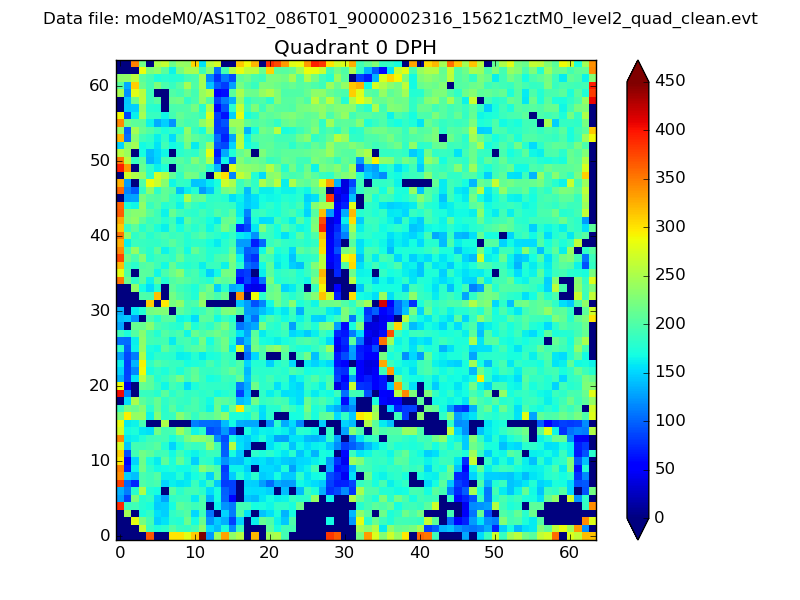 |
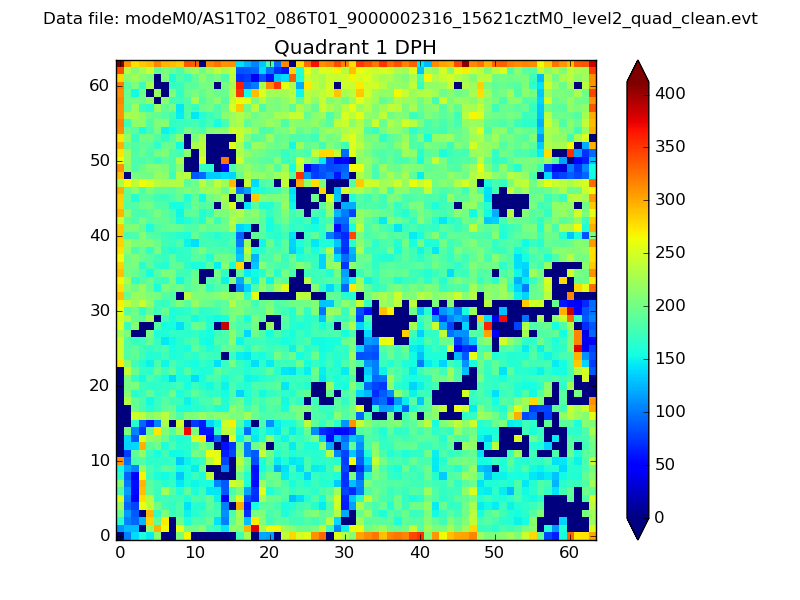 |
Quadrant B |
|---|---|---|---|
| Quadrant D | 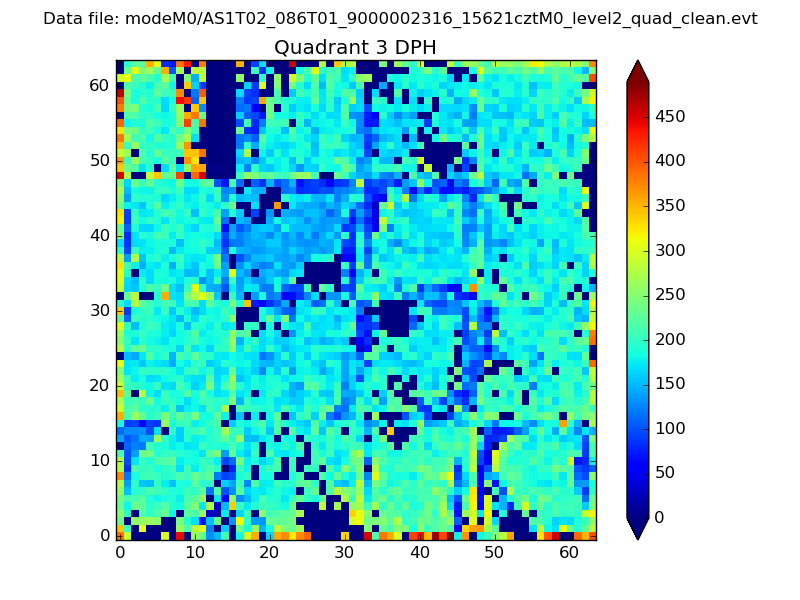 |
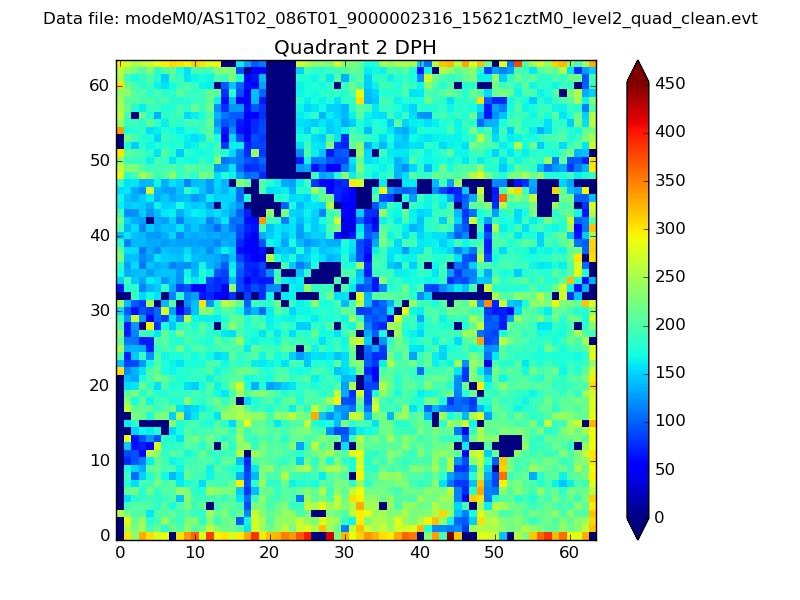 |
Quadrant C |
| Plot type | Count rate plots | Images |
|---|---|---|
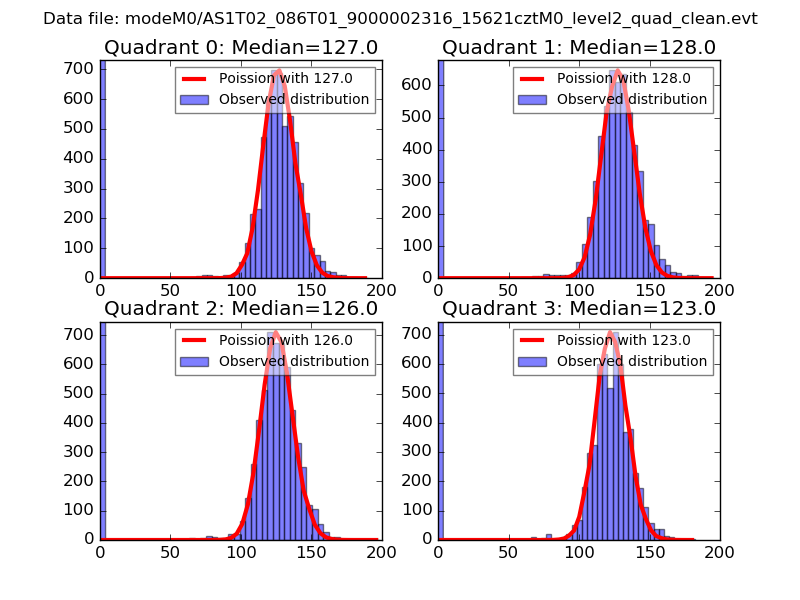
| Comparison with Poisson distribution Blue bars denote a histogram of data divided into 1 sec bins. Red curve is a Poisson curve with rate = median count rate of data. |
 |
 |
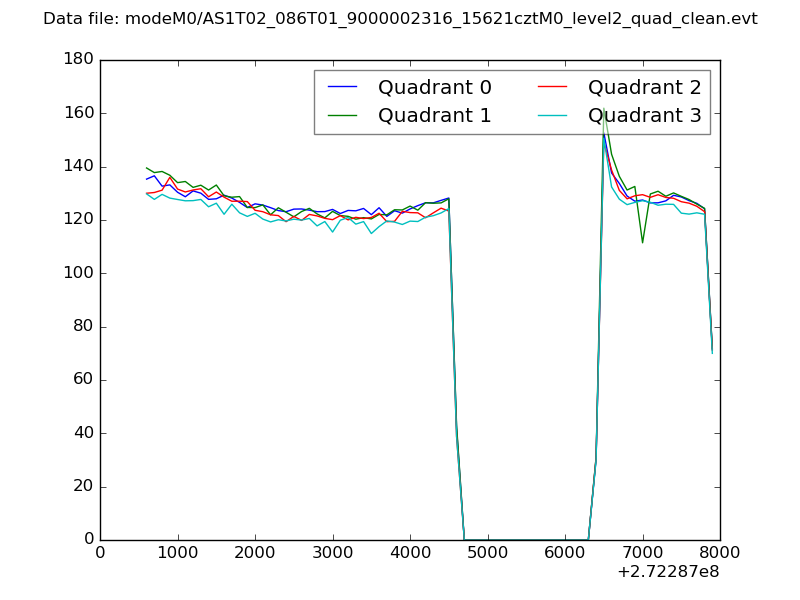
| Quadrant-wise count rates Data is divided into 100 sec bins |
 |
|
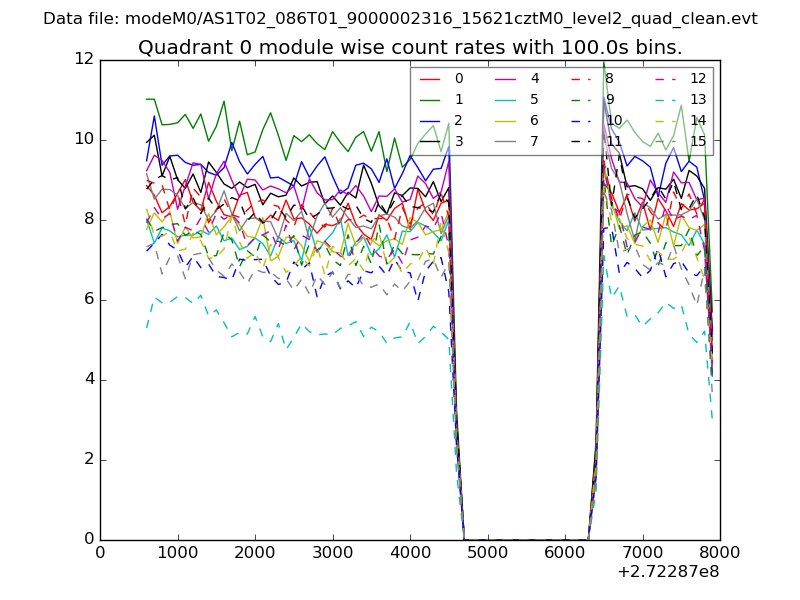
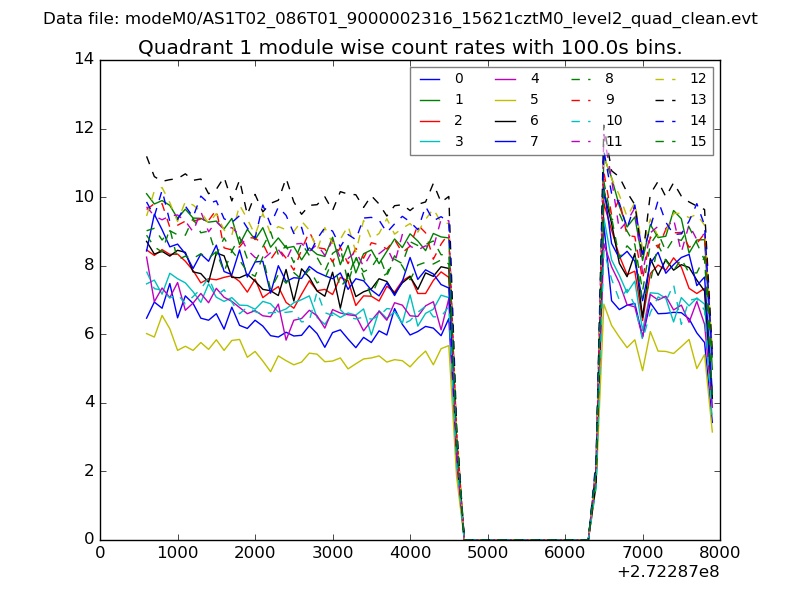
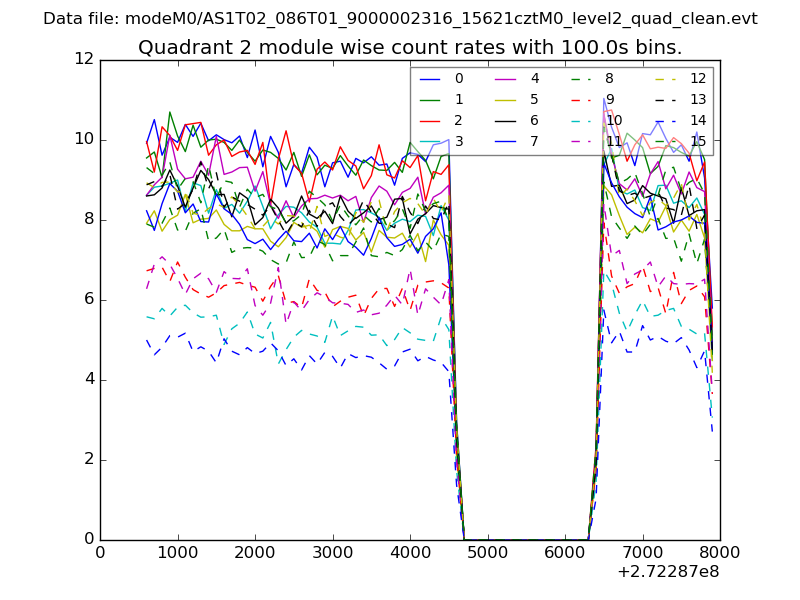
| Module-wise count rates for Quadrant A Data is divided into 100 sec bins |
 |
 |
| Module-wise count rates for Quadrant B Data is divided into 100 sec bins |
 |
 |
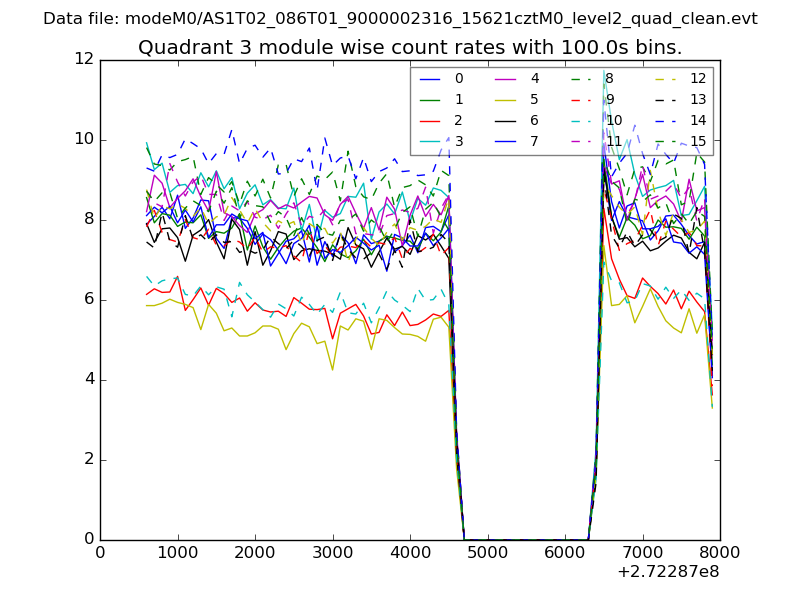
| Module-wise count rates for Quadrant C Data is divided into 100 sec bins |
 |
 |
| Module-wise count rates for Quadrant D Data is divided into 100 sec bins |
 |
 |
| Parameter | Plot |
|---|---|
| CZT HV Monitor | 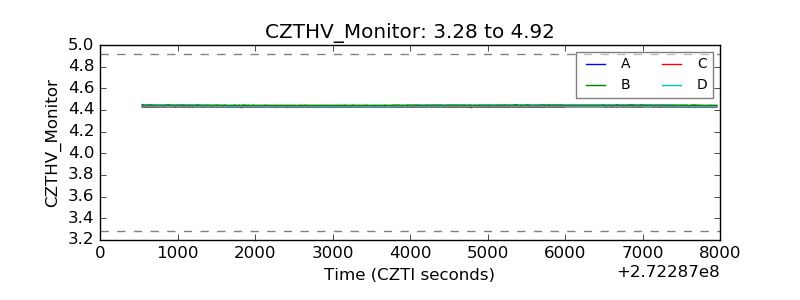 |
| D_VDD | 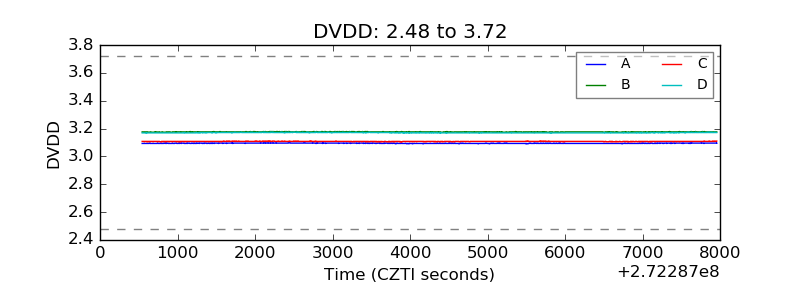 |
| Temperature 1 | 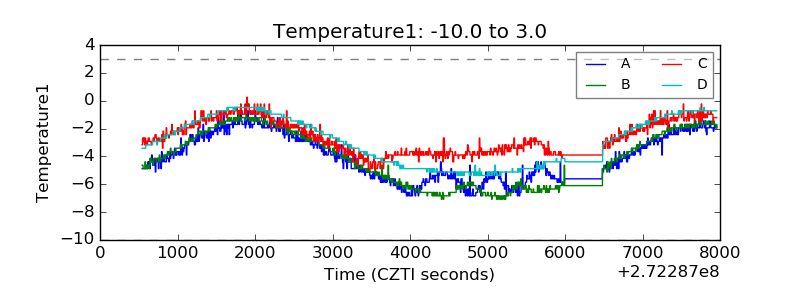 |
| Veto HV Monitor | 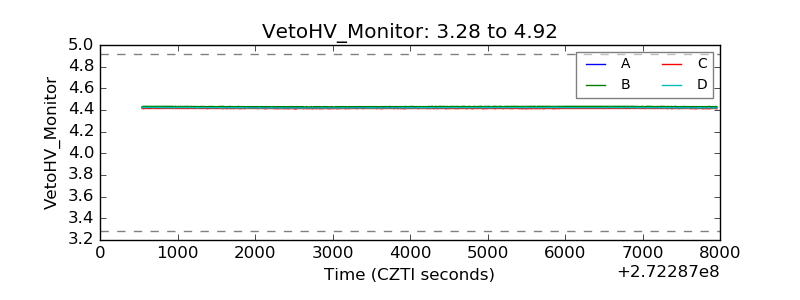 |
| Veto LLD | 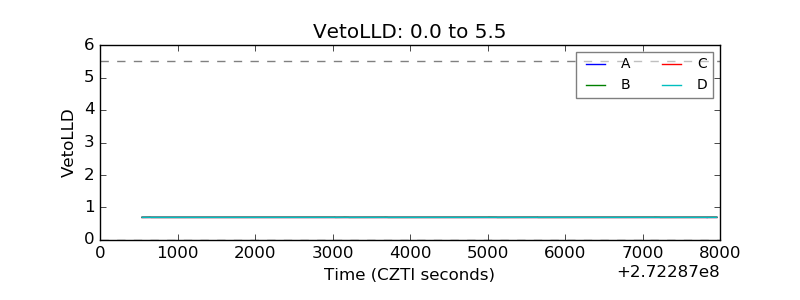 |
| Alpha Counter | 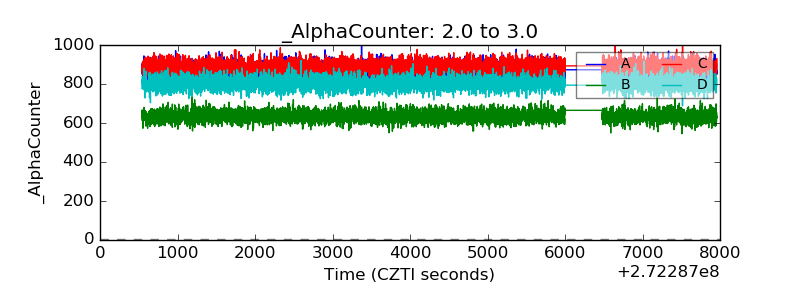 |
| _CPM_Rate | 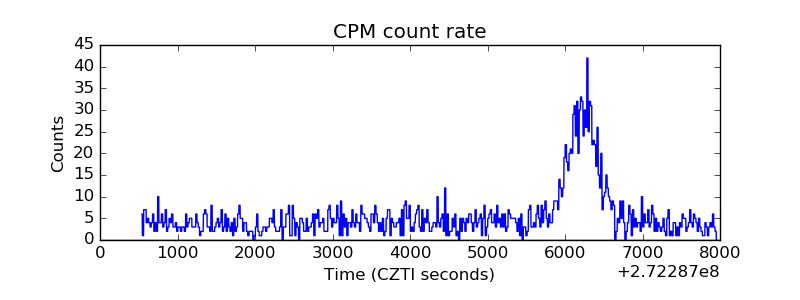 |
| CZT Counter | 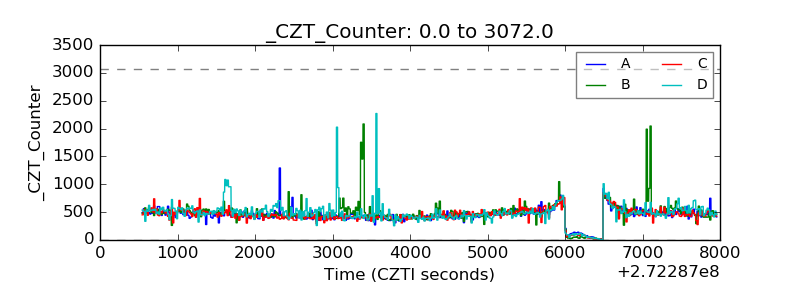 |
| +2.5 Volts monitor |  |
| +5 Volts monitor |  |
| _ROLL_ROT | 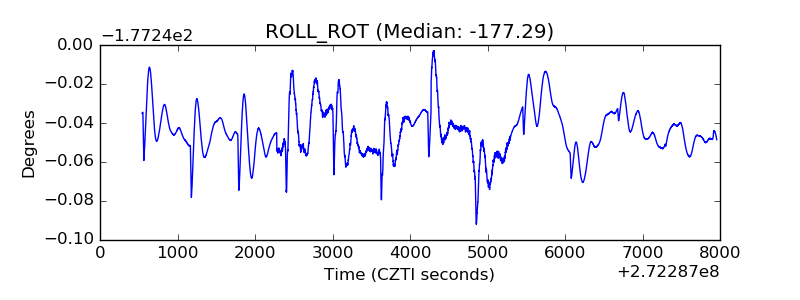 |
| _Roll_DEC | 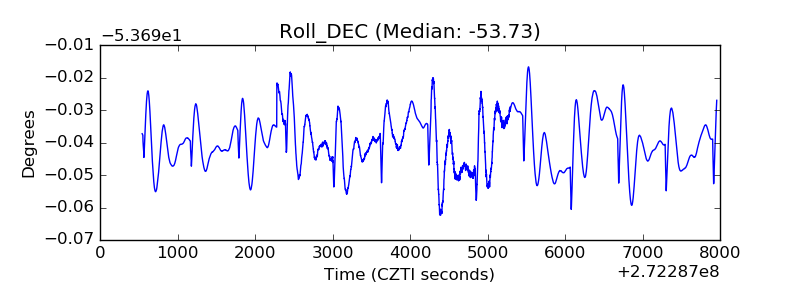 |
| _Roll_RA | 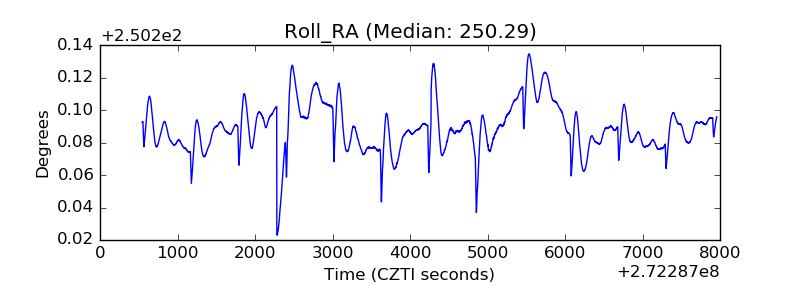 |
| Veto Counter | 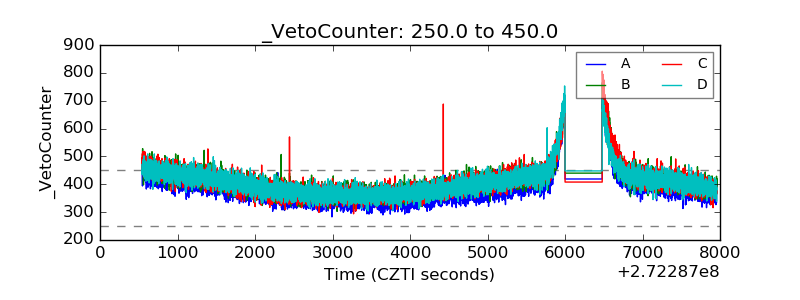 |