| Param | Original file | Final file |
|---|---|---|
| Filename | modeM0/AS1T02_086T01_9000002316_15622cztM0_level2.evt | modeM0/AS1T02_086T01_9000002316_15622cztM0_level2_quad_clean.evt |
| Size (bytes) | 530,006,400 | 114,410,880 |
| Size | 505.5 MB | 109.1 MB |
| Events in quadrant A | 3,727,411 | 740,495 |
| Events in quadrant B | 4,170,898 | 743,367 |
| Events in quadrant C | 3,642,914 | 731,239 |
| Events in quadrant D | 3,988,275 | 715,444 |
| Mode SS | |||
|---|---|---|---|
| Quadrant | BADHDUFLAG | Total packets | Discarded packets |
| A | 0 | 154 | 0 |
| B | 0 | 154 | 0 |
| C | 0 | 154 | 0 |
| D | 0 | 154 | 0 |
| Mode M9 | |||
|---|---|---|---|
| Quadrant | BADHDUFLAG | Total packets | Discarded packets |
| A | 0 | 2 | 0 |
| B | 0 | 2 | 0 |
| C | 0 | 2 | 0 |
| D | 0 | 2 | 0 |
| Mode M0 | |||
|---|---|---|---|
| Quadrant | BADHDUFLAG | Total packets | Discarded packets |
| A | 0 | 16124 | 2 |
| B | 0 | 17327 | 1 |
| C | 0 | 15997 | 1 |
| D | 0 | 16833 | 1 |
| Quadrant | Total seconds | Saturated seconds | Saturation percentage |
|---|---|---|---|
| A | 7690 | 126 | 1.638492% |
| B | 7690 | 219 | 2.847854% |
| C | 7690 | 144 | 1.872562% |
| D | 7690 | 94 | 1.222367% |
Noise dominated data is calculated using 1-second bins in cleaned event files. If a bin has >2000 counts, and if more than 50% of those come from <1% of pixels, then it is considered to be noise-dominated and hence unusable.
| Quadrant | # 1 sec bins | Bins with >0 counts | Bins with >2000 counts | High rate bins dominated by noise | Noise dominated (total time) | Noise dominated (detector-on time) | Marked lightcurve |
|---|---|---|---|---|---|---|---|
| A | 7841 | 7691 | 1 | 1 | 0.01% | 0.01% | 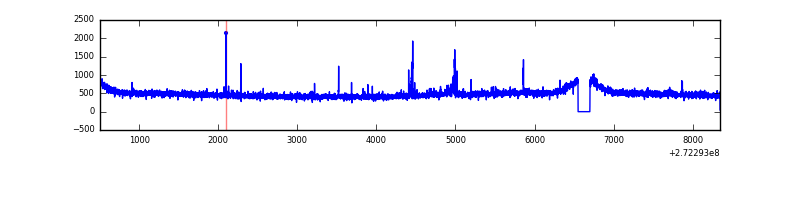 |
| B | 7841 | 7692 | 71 | 71 | 0.91% | 0.92% | 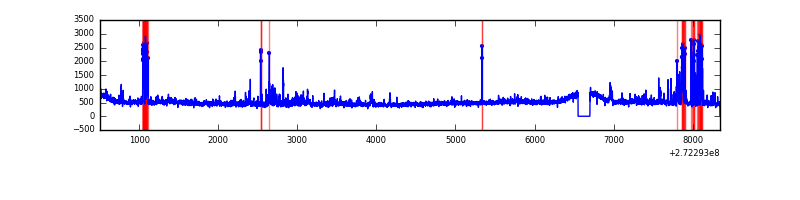 |
| C | 7841 | 7691 | 0 | 0 | 0.00% | 0.00% | 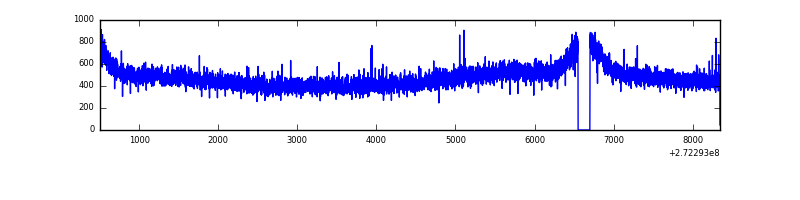 |
| D | 7841 | 7692 | 21 | 21 | 0.27% | 0.27% | 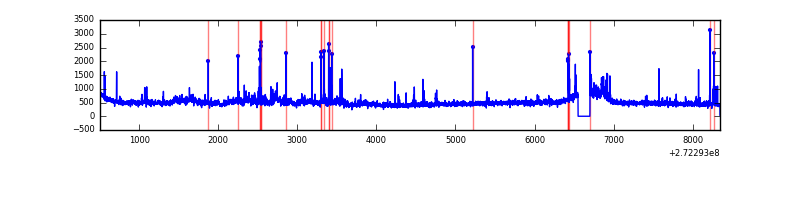 |
Top three noisy pixels from each quadrant. If the there are fewer than three noisy pixels in the level2.evt file, extra rows are filled as -1
| Pixel properties | Quadrant properties | ||||||
|---|---|---|---|---|---|---|---|
| Quadrant | DetID | PixID | Counts | Sigma | Mean | Median | Sigma |
| A | 15 | 157 | 68917 | 355.43 | 939 | 915 | 191.3 |
| A | 3 | 80 | 34529 | 175.69 | 939 | 915 | 191.3 |
| A | 13 | 248 | 9917 | 47.05 | 939 | 915 | 191.3 |
| B | 3 | 209 | 172983 | 970.61 | 928 | 906 | 177.3 |
| B | 5 | 65 | 161015 | 903.1 | 928 | 906 | 177.3 |
| B | 0 | 85 | 86646 | 483.62 | 928 | 906 | 177.3 |
| C | 14 | 238 | 136715 | 651.86 | 891 | 894 | 208.4 |
| C | 3 | 233 | 19768 | 90.58 | 891 | 894 | 208.4 |
| C | 13 | 61 | 6541 | 27.1 | 891 | 894 | 208.4 |
| D | 1 | 52 | 303265 | 1368.86 | 910 | 883 | 220.9 |
| D | 12 | 110 | 61269 | 273.36 | 910 | 883 | 220.9 |
| D | 2 | 16 | 45540 | 202.16 | 910 | 883 | 220.9 |
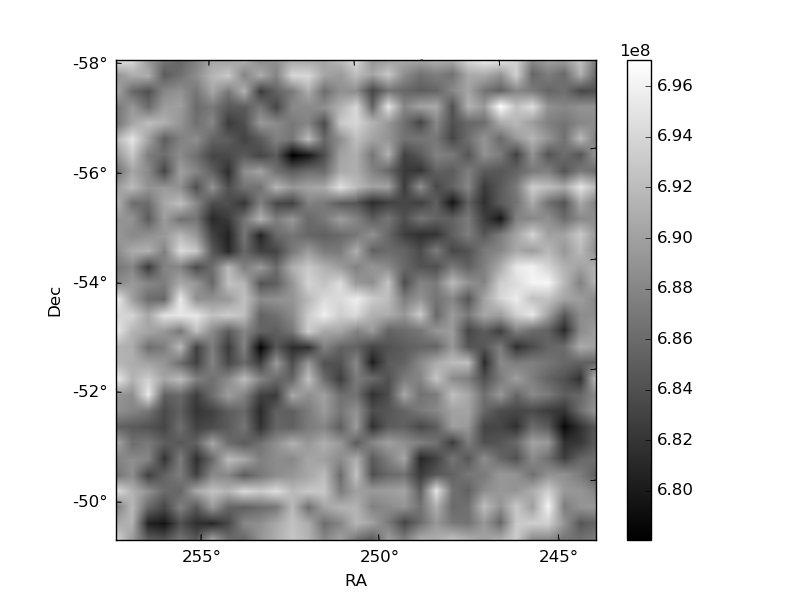
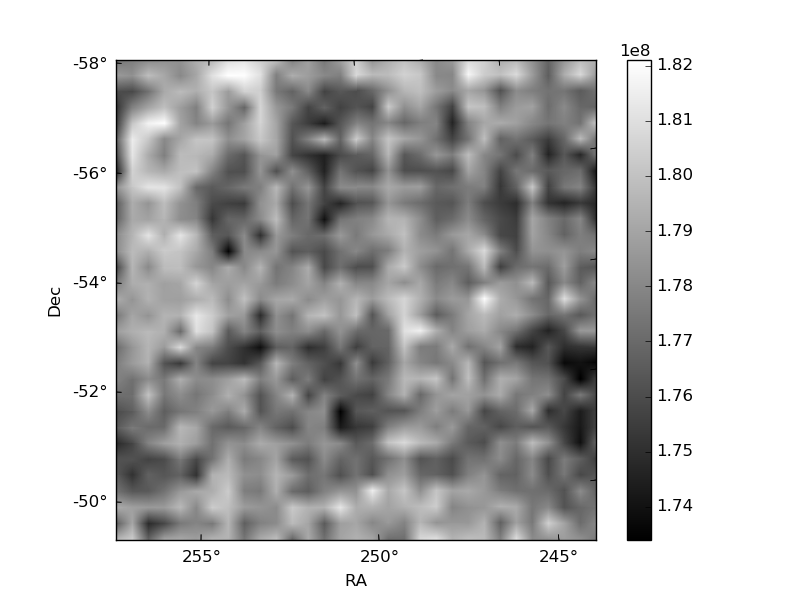
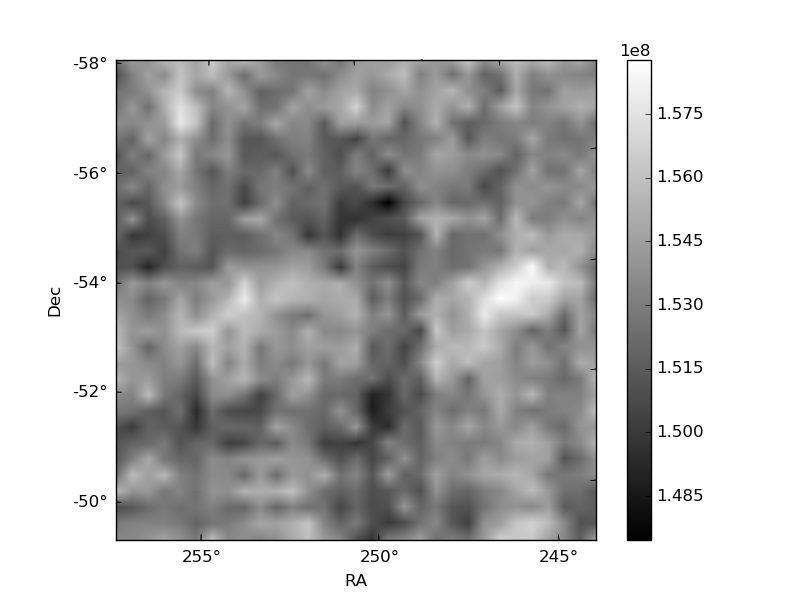
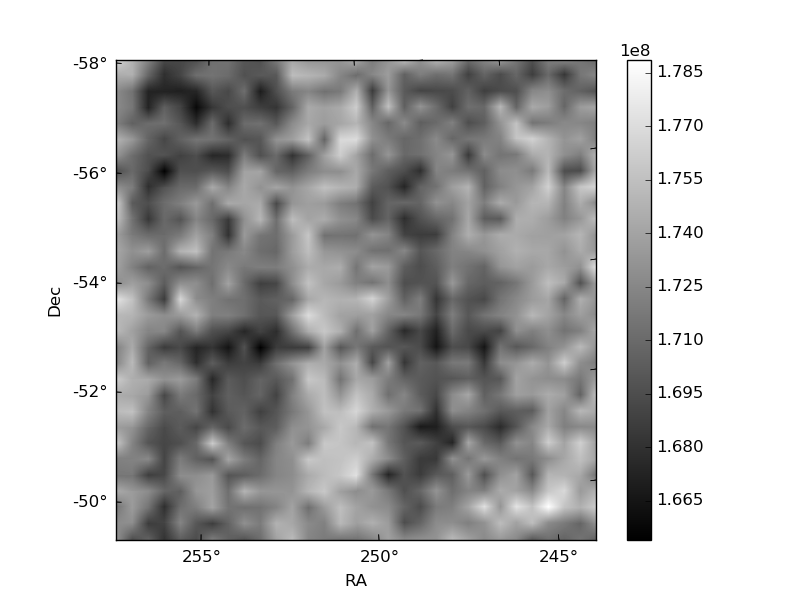
Histogram calculated using DETX and DETY for each event in the final _common_clean file
| Quadrant A | 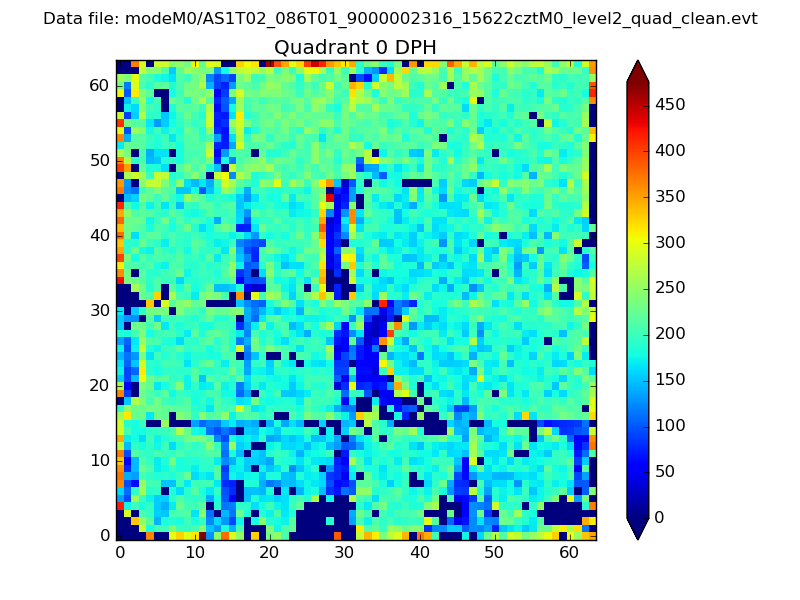 |
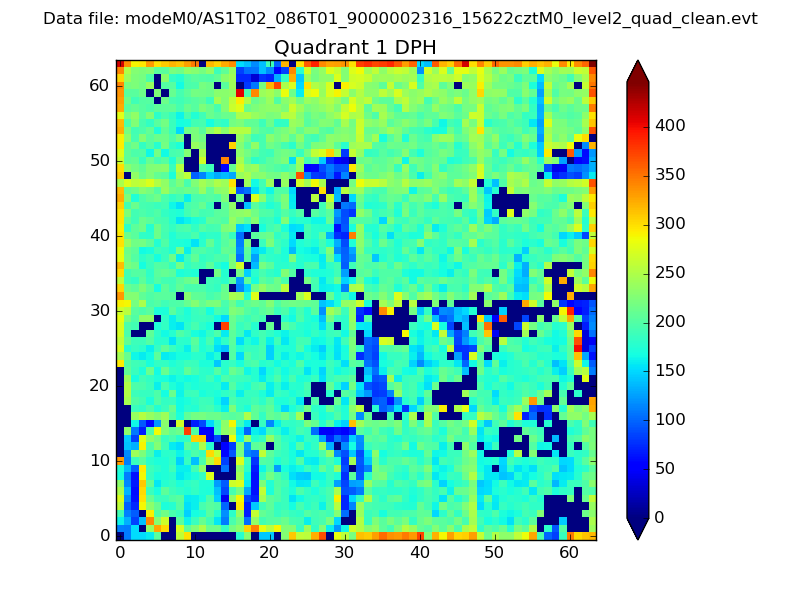 |
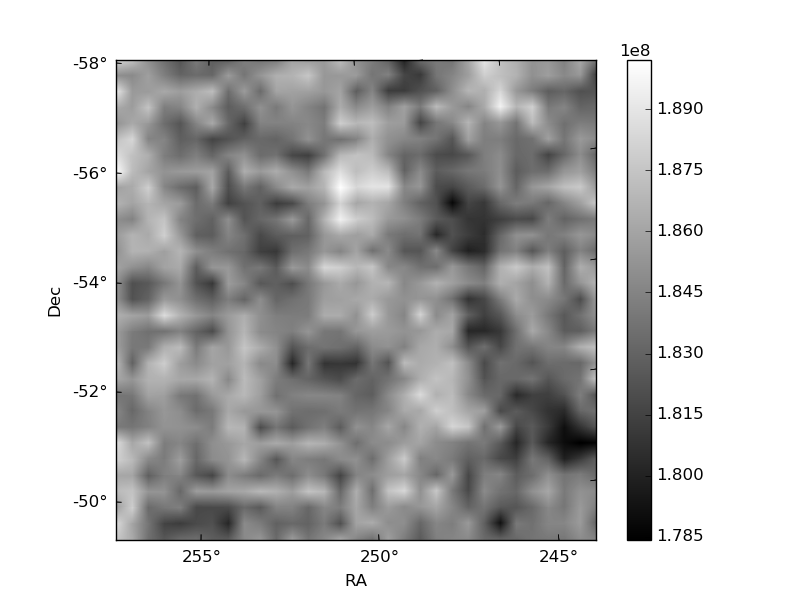
Quadrant B |
|---|---|---|---|
| Quadrant D | 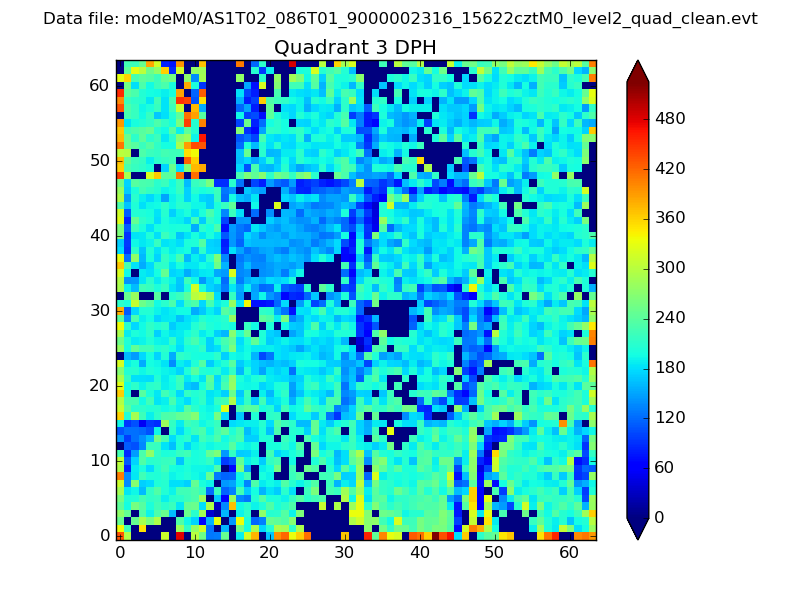 |
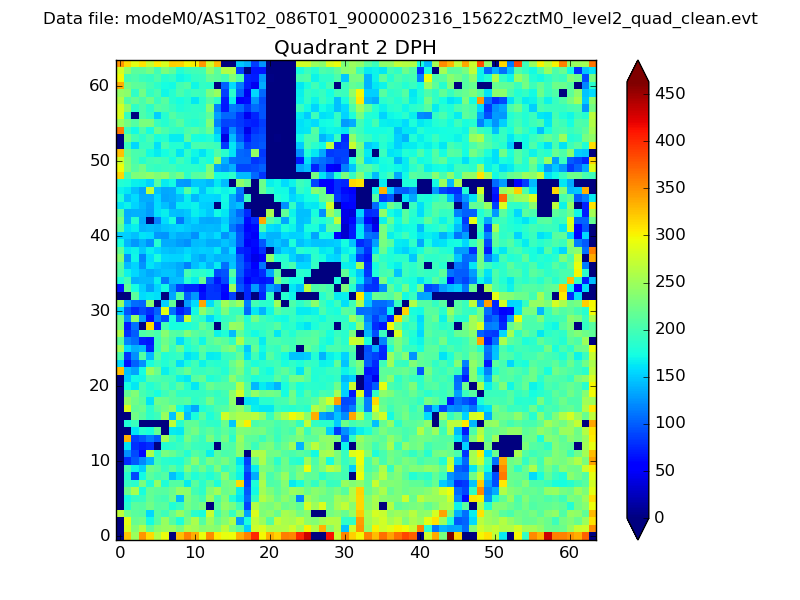 |
Quadrant C |
| Plot type | Count rate plots | Images |
|---|---|---|
| Comparison with Poisson distribution Blue bars denote a histogram of data divided into 1 sec bins. Red curve is a Poisson curve with rate = median count rate of data. |
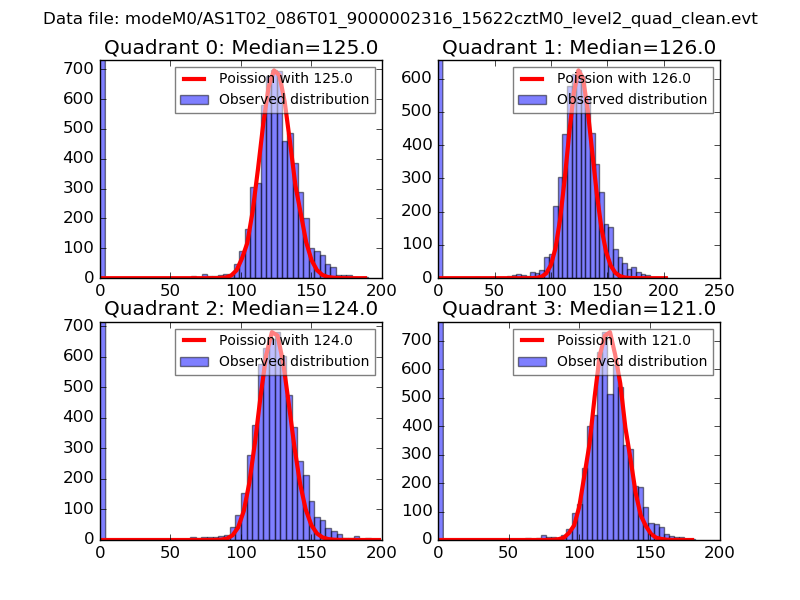 |
 |
| Quadrant-wise count rates Data is divided into 100 sec bins |
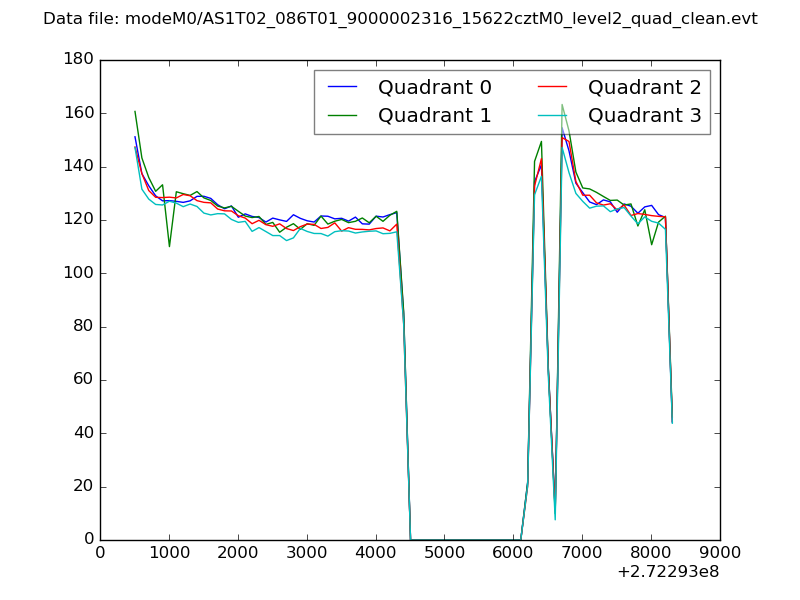 |
|
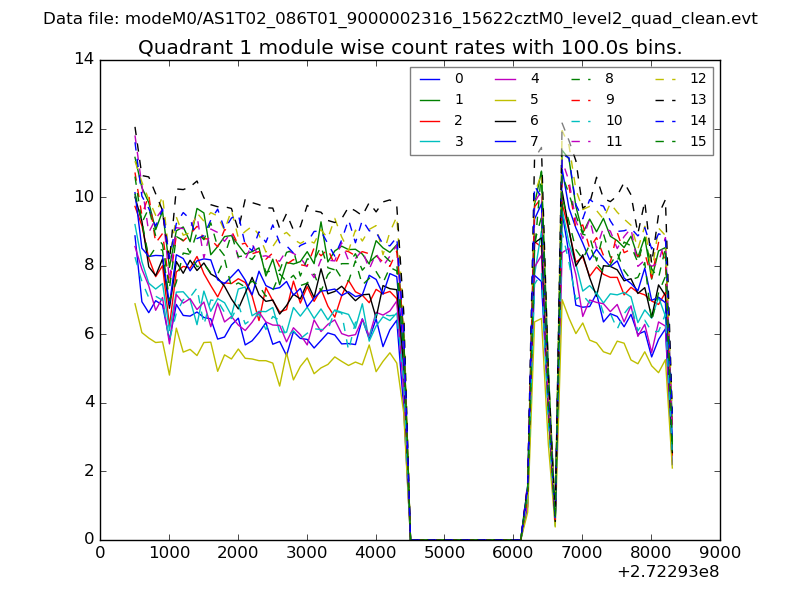
| Module-wise count rates for Quadrant A Data is divided into 100 sec bins |
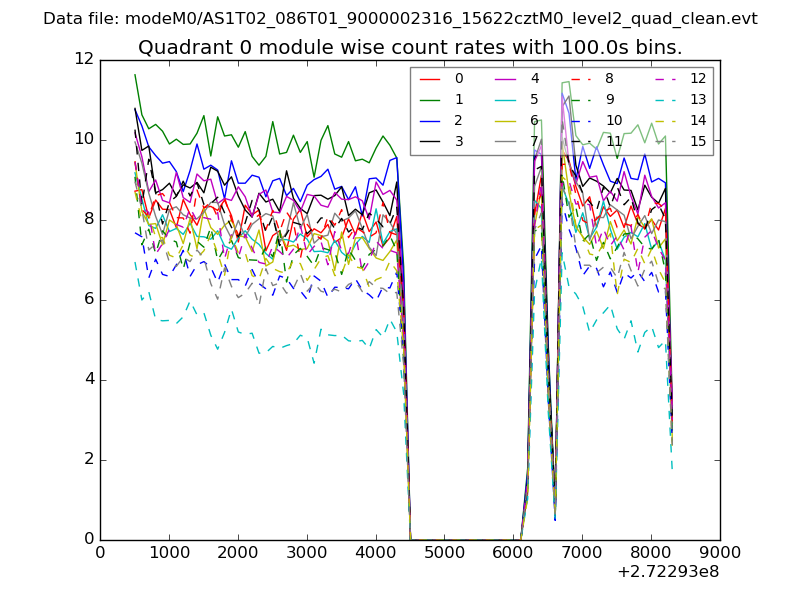 |
 |
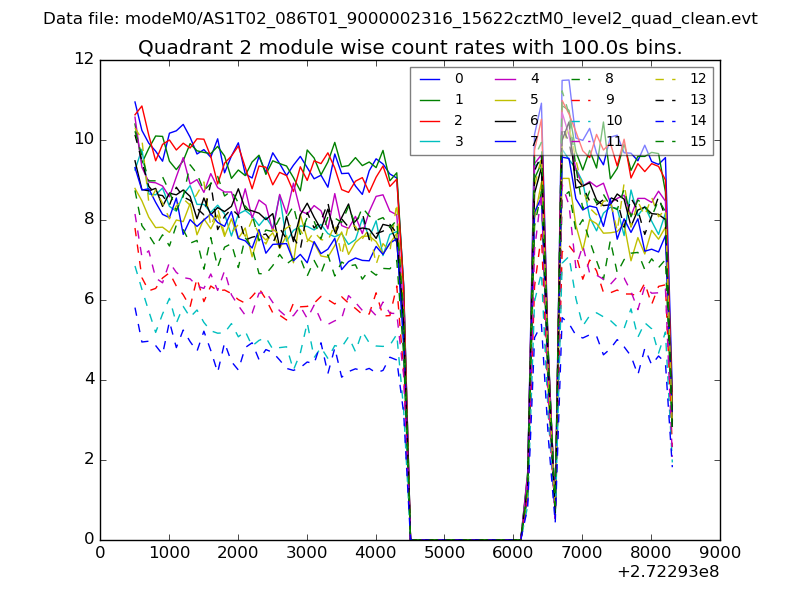
| Module-wise count rates for Quadrant B Data is divided into 100 sec bins |
 |
 |
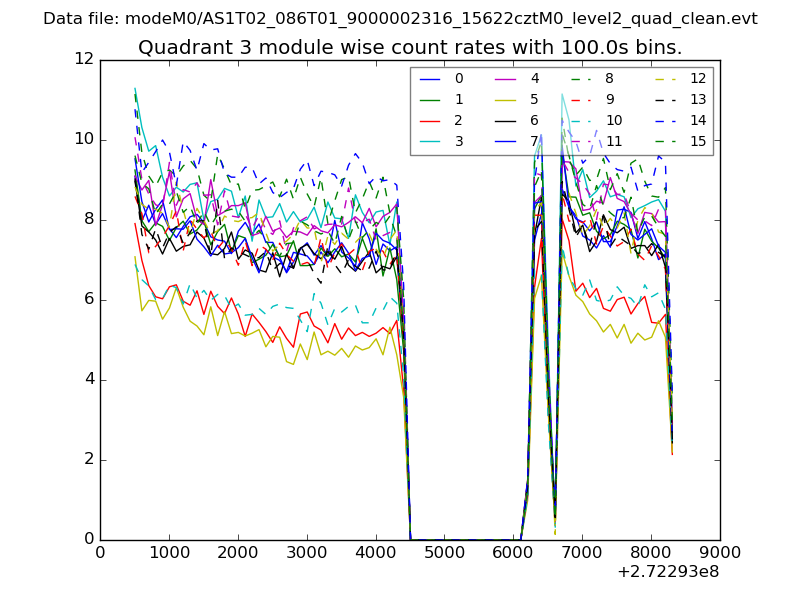
| Module-wise count rates for Quadrant C Data is divided into 100 sec bins |
 |
 |
| Module-wise count rates for Quadrant D Data is divided into 100 sec bins |
 |
 |
| Parameter | Plot |
|---|---|
| CZT HV Monitor | 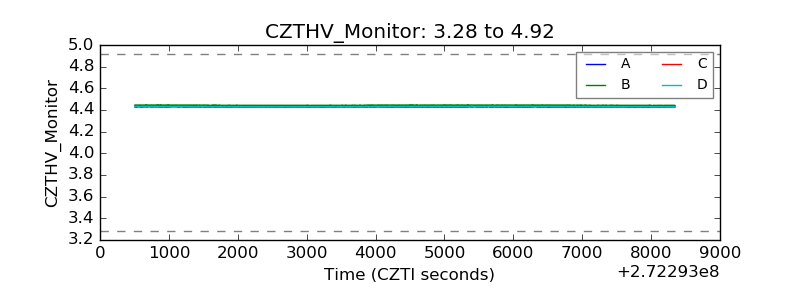 |
| D_VDD | 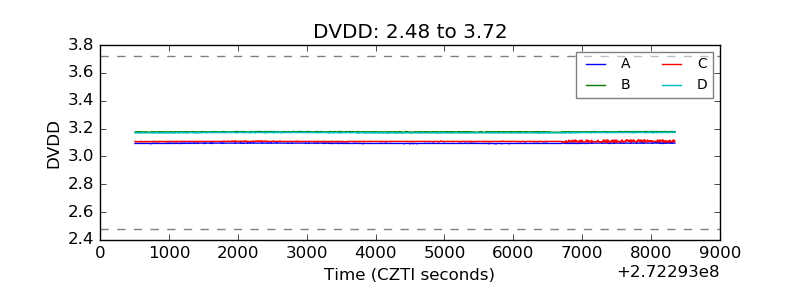 |
| Temperature 1 | 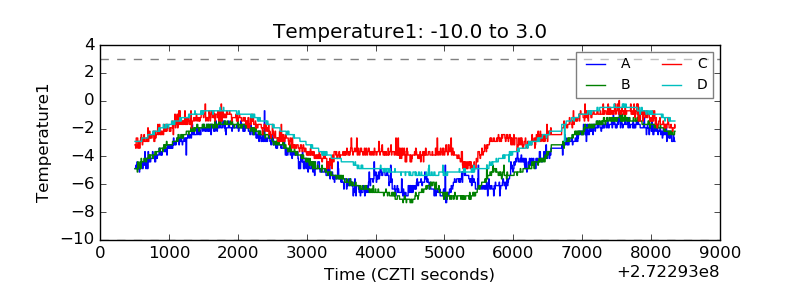 |
| Veto HV Monitor | 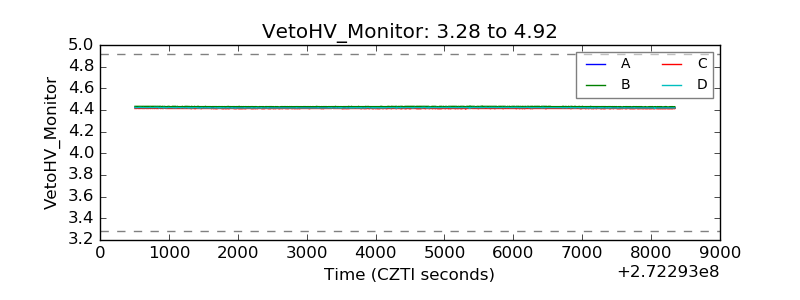 |
| Veto LLD | 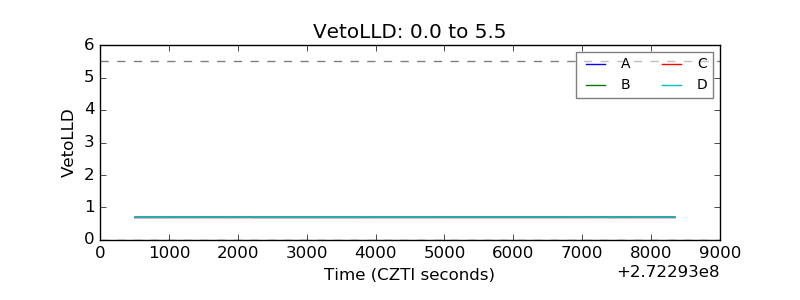 |
| Alpha Counter | 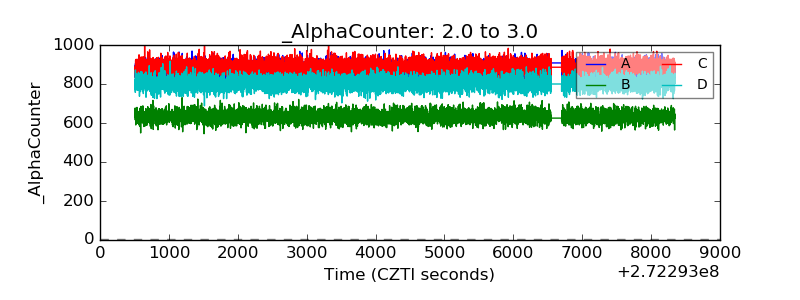 |
| _CPM_Rate | 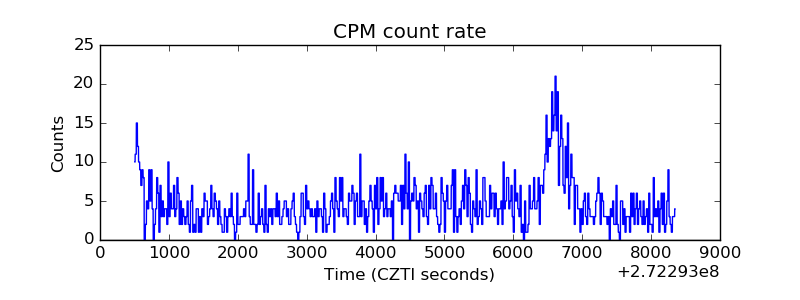 |
| CZT Counter | 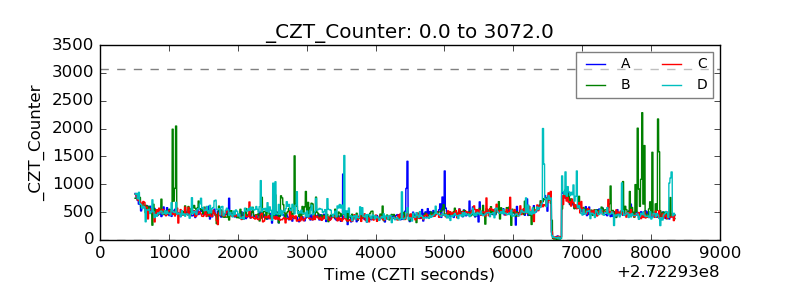 |
| +2.5 Volts monitor |  |
| +5 Volts monitor |  |
| _ROLL_ROT | 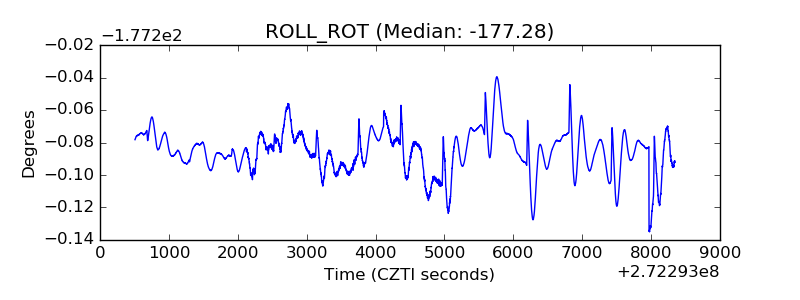 |
| _Roll_DEC | 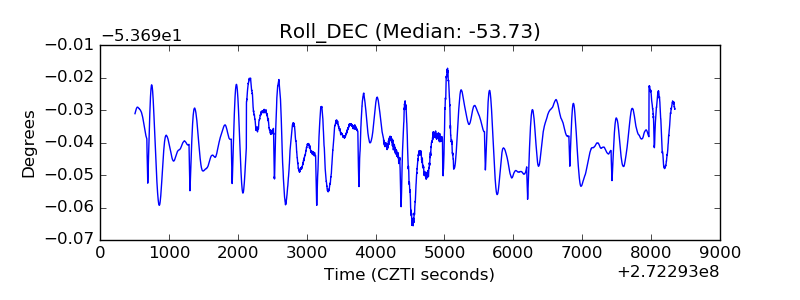 |
| _Roll_RA | 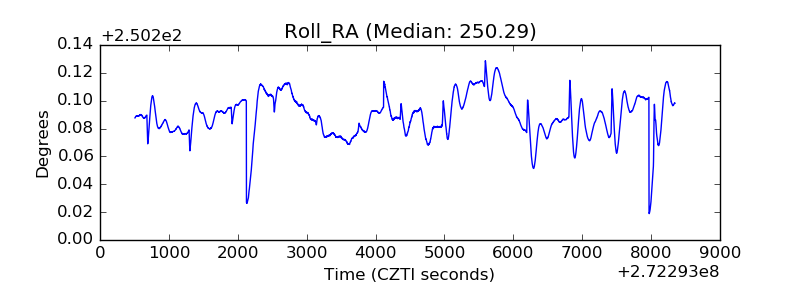 |
| Veto Counter | 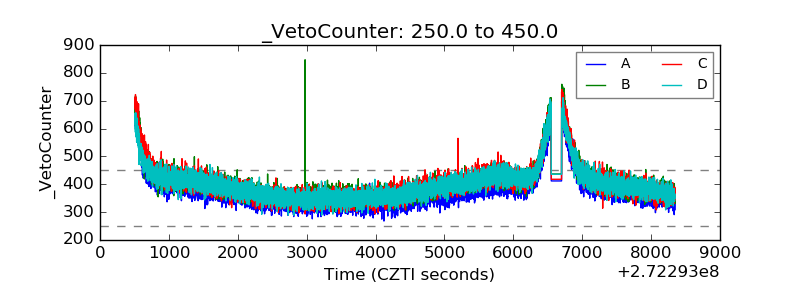 |