| Param | Original file | Final file |
|---|---|---|
| Filename | modeM0/AS1T02_086T01_9000002316_15626cztM0_level2.evt | modeM0/AS1T02_086T01_9000002316_15626cztM0_level2_quad_clean.evt |
| Size (bytes) | 1,182,329,280 | 255,179,520 |
| Size | 1.1 GB | 243.4 MB |
| Events in quadrant A | 8,478,355 | 1,628,984 |
| Events in quadrant B | 9,080,705 | 1,644,338 |
| Events in quadrant C | 8,490,282 | 1,600,548 |
| Events in quadrant D | 8,502,257 | 1,576,963 |
| Mode SS | |||
|---|---|---|---|
| Quadrant | BADHDUFLAG | Total packets | Discarded packets |
| A | 0 | 376 | 0 |
| B | 0 | 376 | 0 |
| C | 0 | 376 | 0 |
| D | 0 | 376 | 0 |
| Mode M9 | |||
|---|---|---|---|
| Quadrant | BADHDUFLAG | Total packets | Discarded packets |
| A | 0 | 20 | 0 |
| B | 0 | 20 | 0 |
| C | 0 | 20 | 0 |
| D | 0 | 20 | 0 |
| Mode M0 | |||
|---|---|---|---|
| Quadrant | BADHDUFLAG | Total packets | Discarded packets |
| A | 0 | 37945 | 5 |
| B | 0 | 39055 | 4 |
| C | 0 | 37794 | 4 |
| D | 0 | 38473 | 4 |
| Quadrant | Total seconds | Saturated seconds | Saturation percentage |
|---|---|---|---|
| A | 18553 | 60 | 0.323398% |
| B | 18553 | 85 | 0.458147% |
| C | 18553 | 114 | 0.614456% |
| D | 18553 | 50 | 0.269498% |
Noise dominated data is calculated using 1-second bins in cleaned event files. If a bin has >2000 counts, and if more than 50% of those come from <1% of pixels, then it is considered to be noise-dominated and hence unusable.
| Quadrant | # 1 sec bins | Bins with >0 counts | Bins with >2000 counts | High rate bins dominated by noise | Noise dominated (total time) | Noise dominated (detector-on time) | Marked lightcurve |
|---|---|---|---|---|---|---|---|
| A | 20464 | 18557 | 12 | 12 | 0.06% | 0.06% | 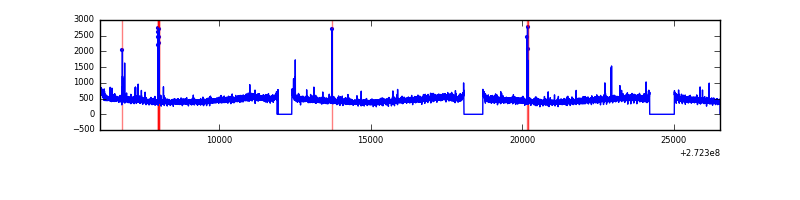 |
| B | 20464 | 18557 | 6 | 6 | 0.03% | 0.03% | 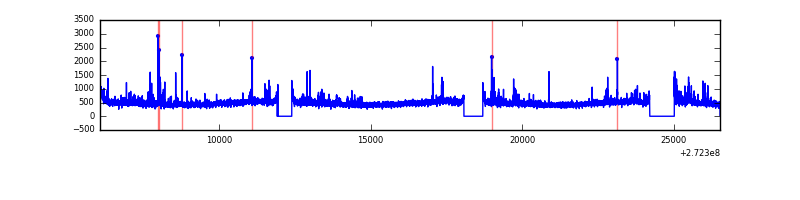 |
| C | 20464 | 18558 | 0 | 0 | 0.00% | 0.00% |  |
| D | 20464 | 18558 | 25 | 25 | 0.12% | 0.13% | 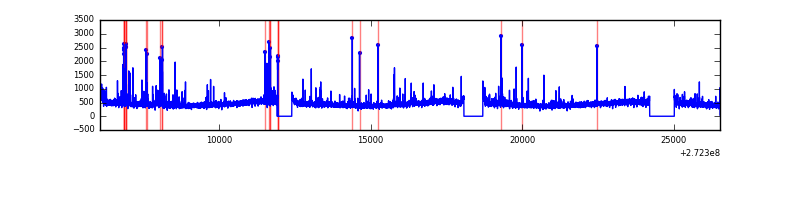 |
Top three noisy pixels from each quadrant. If the there are fewer than three noisy pixels in the level2.evt file, extra rows are filled as -1
| Pixel properties | Quadrant properties | ||||||
|---|---|---|---|---|---|---|---|
| Quadrant | DetID | PixID | Counts | Sigma | Mean | Median | Sigma |
| A | 4 | 2 | 45675 | 99.53 | 2169 | 2122 | 437.6 |
| A | 3 | 80 | 30407 | 64.64 | 2169 | 2122 | 437.6 |
| A | 15 | 174 | 20563 | 42.14 | 2169 | 2122 | 437.6 |
| B | 5 | 65 | 150556 | 361.91 | 2172 | 2119 | 410.1 |
| B | 0 | 189 | 109073 | 260.77 | 2172 | 2119 | 410.1 |
| B | 0 | 197 | 83023 | 197.25 | 2172 | 2119 | 410.1 |
| C | 14 | 238 | 316219 | 644.71 | 2077 | 2085 | 487.2 |
| C | 3 | 233 | 69262 | 137.87 | 2077 | 2085 | 487.2 |
| C | 13 | 61 | 15085 | 26.68 | 2077 | 2085 | 487.2 |
| D | 1 | 52 | 163667 | 315.94 | 2103 | 2037 | 511.6 |
| D | 5 | 51 | 96344 | 184.34 | 2103 | 2037 | 511.6 |
| D | 2 | 234 | 76991 | 146.51 | 2103 | 2037 | 511.6 |
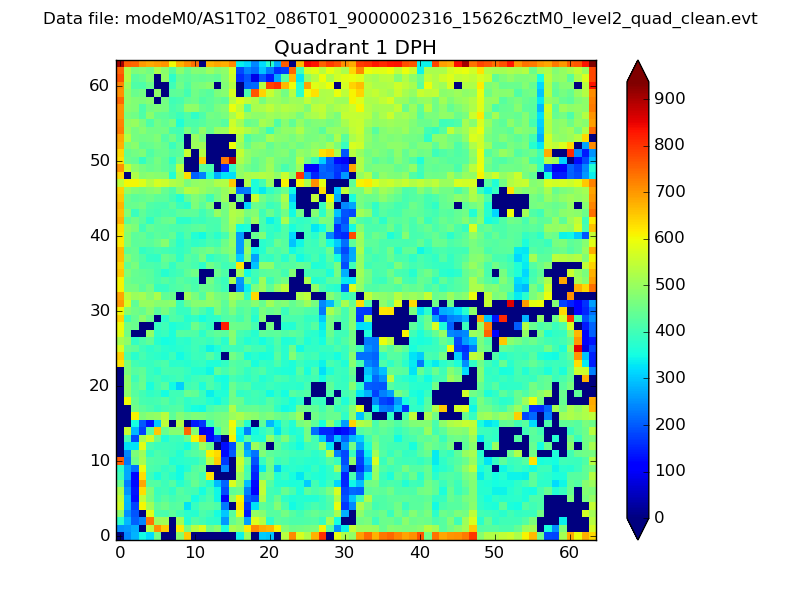
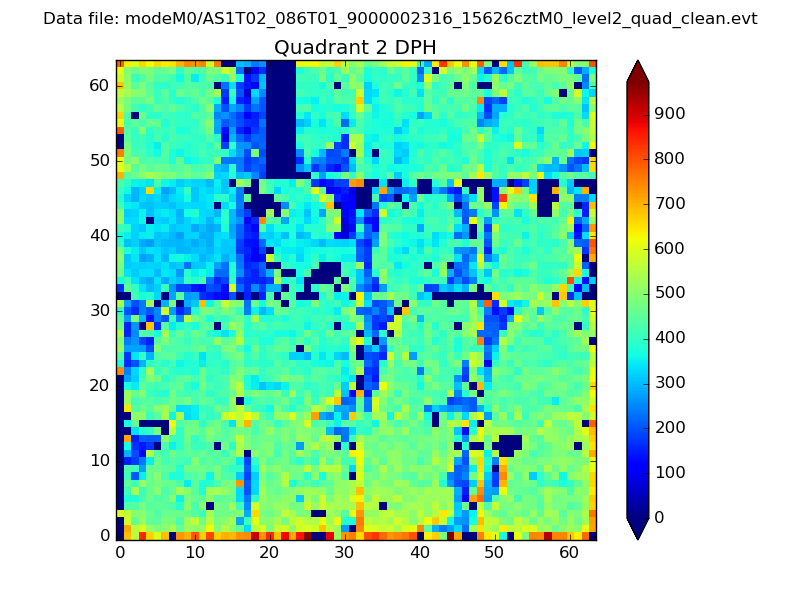
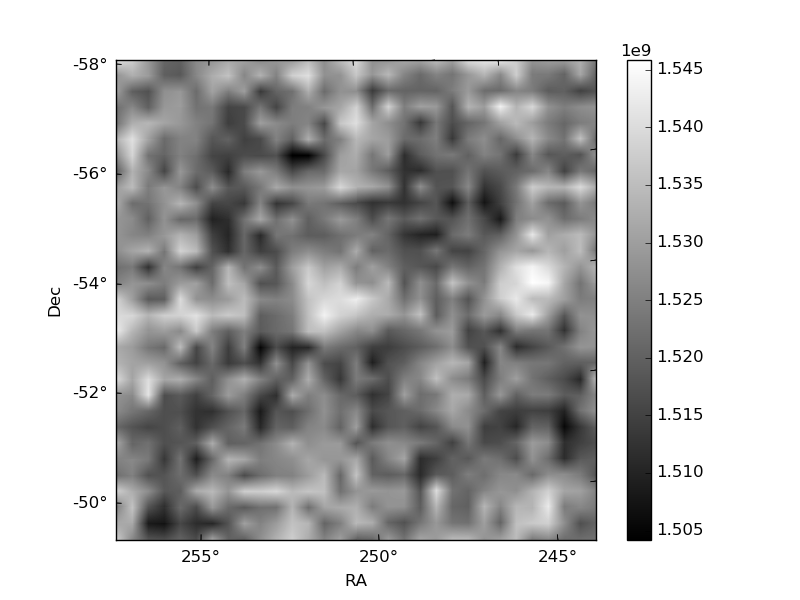
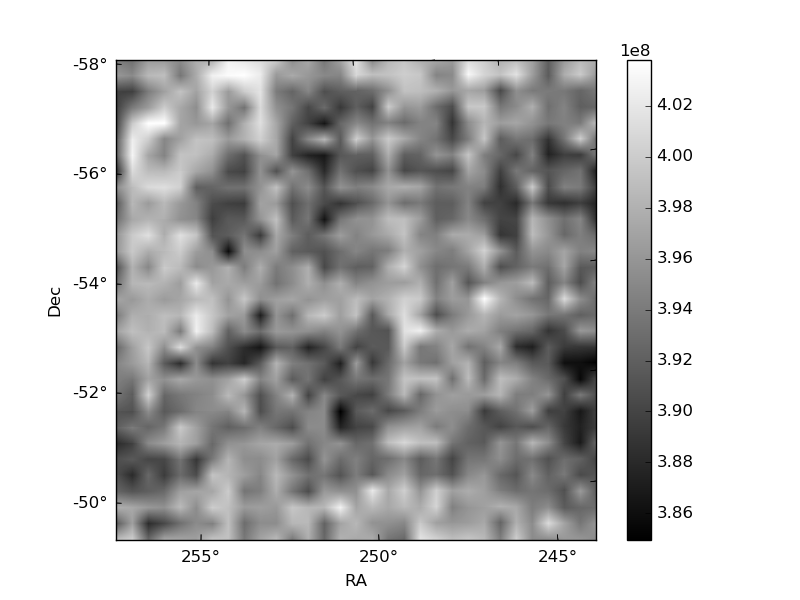
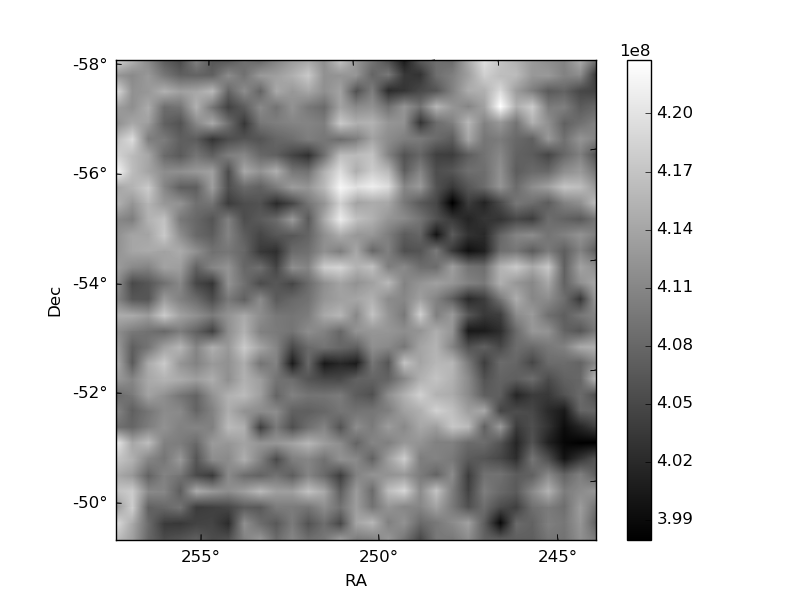
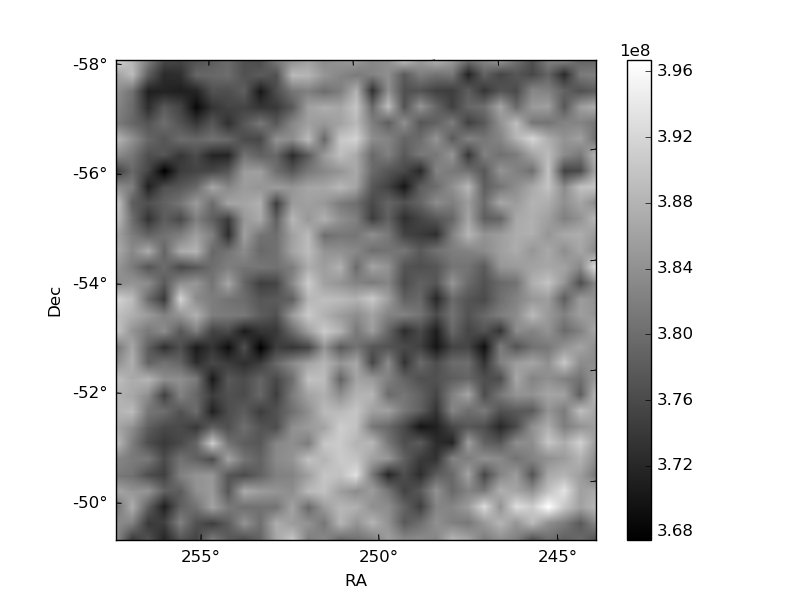
Histogram calculated using DETX and DETY for each event in the final _common_clean file
| Quadrant A | 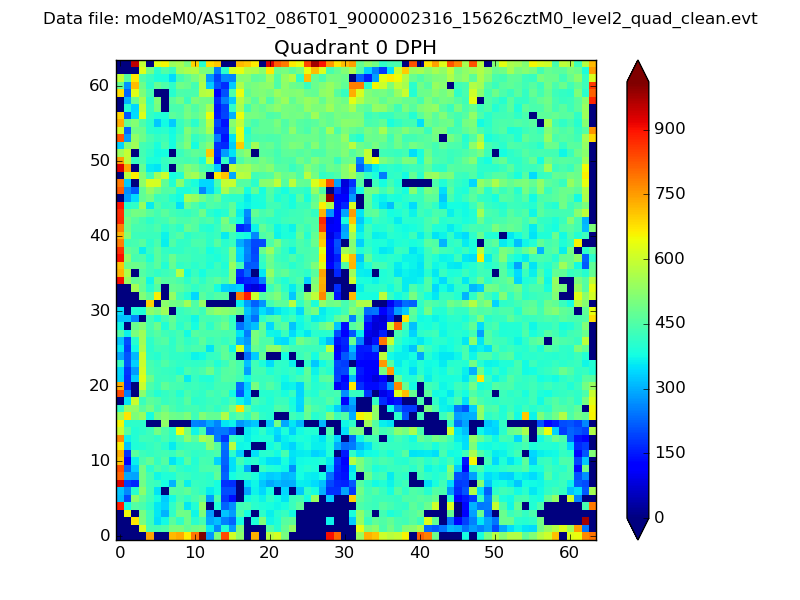 |
 |
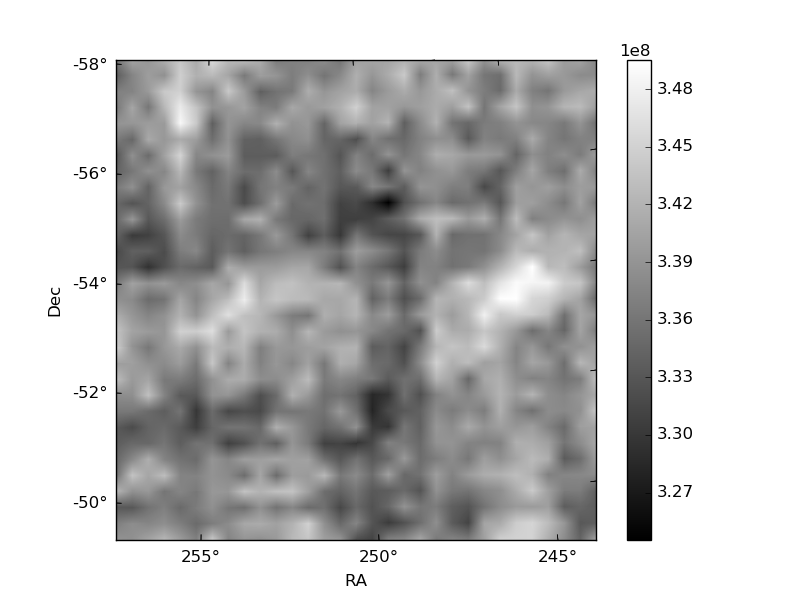
Quadrant B |
|---|---|---|---|
| Quadrant D | 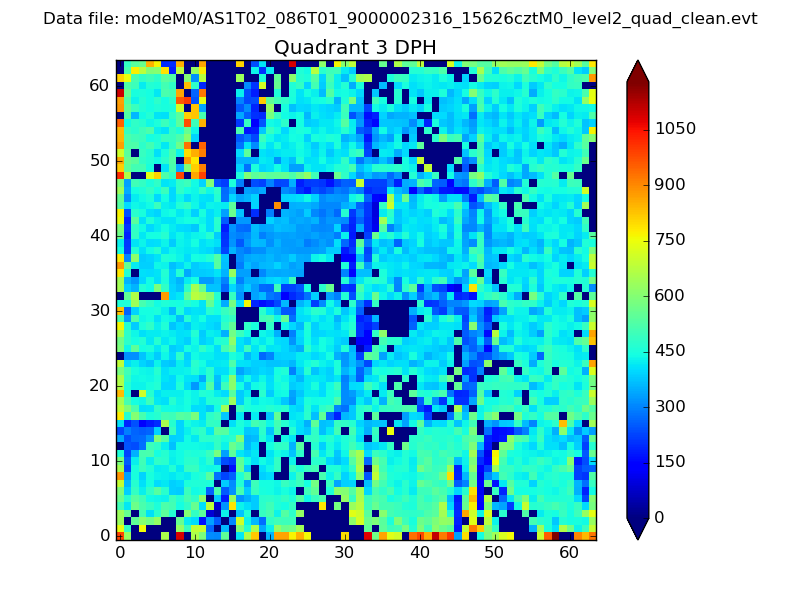 |
 |
Quadrant C |
| Plot type | Count rate plots | Images |
|---|---|---|
| Comparison with Poisson distribution Blue bars denote a histogram of data divided into 1 sec bins. Red curve is a Poisson curve with rate = median count rate of data. |
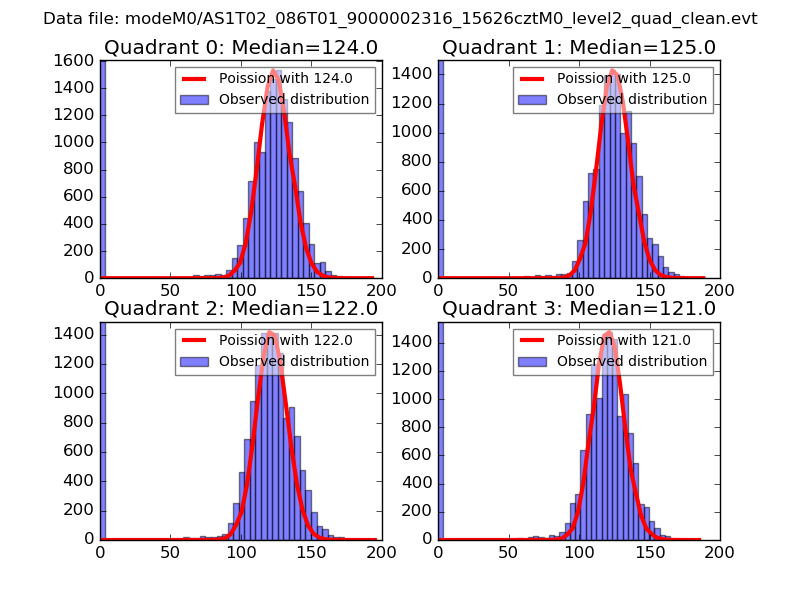 |
 |
| Quadrant-wise count rates Data is divided into 100 sec bins |
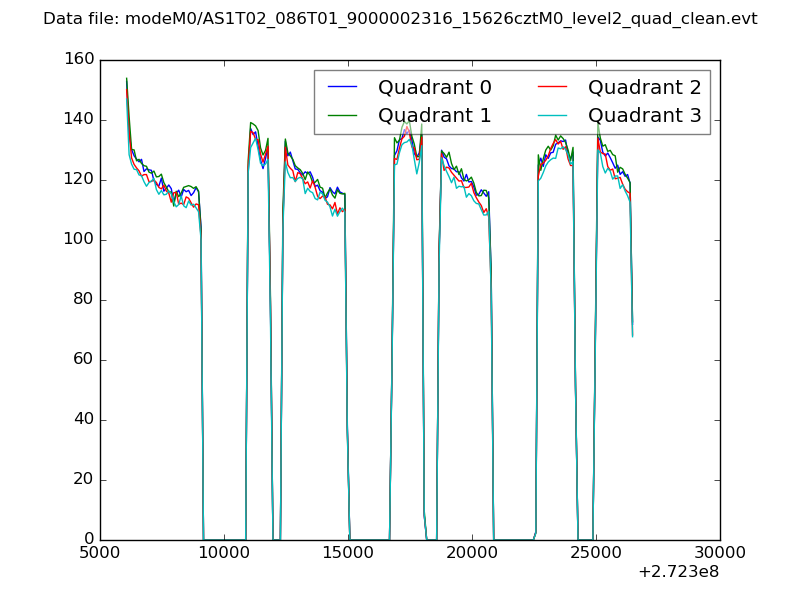 |
|
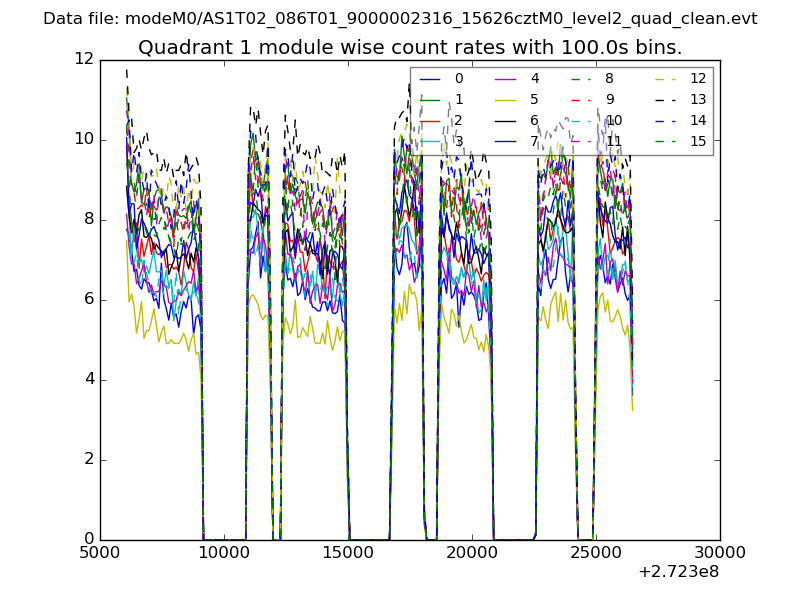
| Module-wise count rates for Quadrant A Data is divided into 100 sec bins |
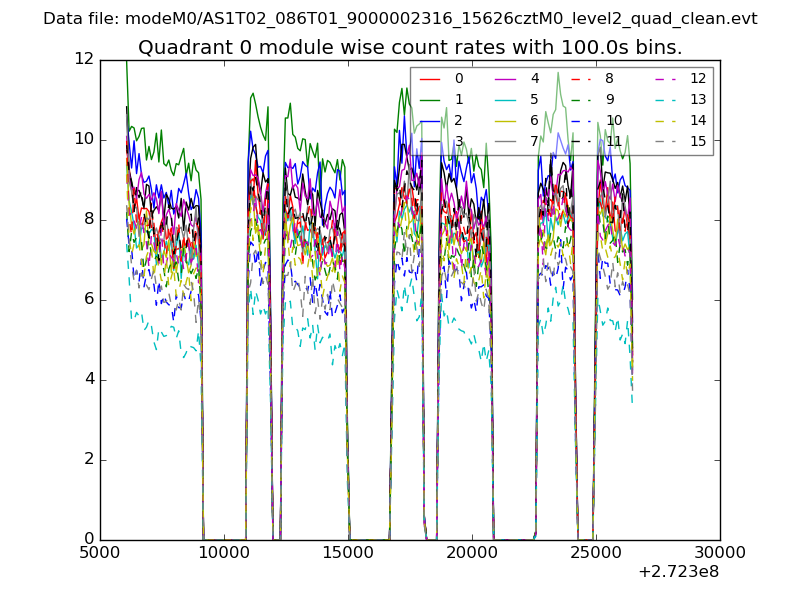 |
 |
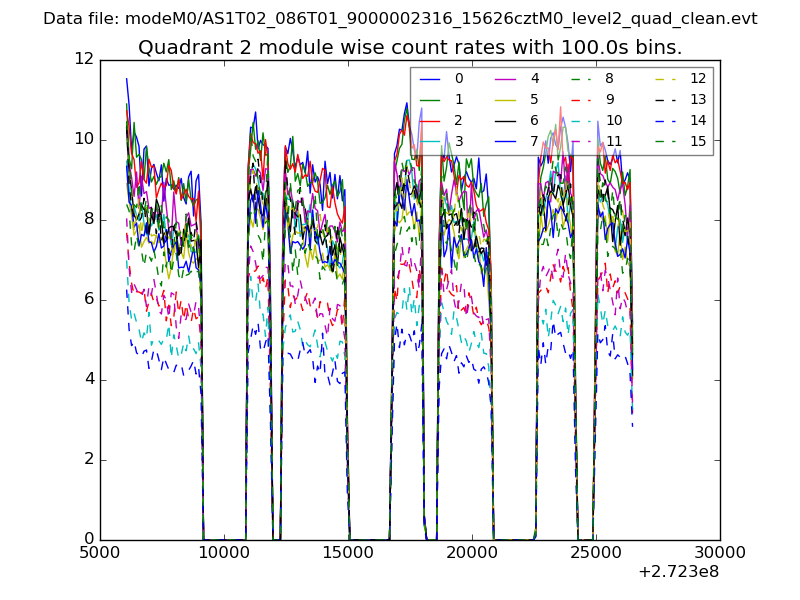
| Module-wise count rates for Quadrant B Data is divided into 100 sec bins |
 |
 |
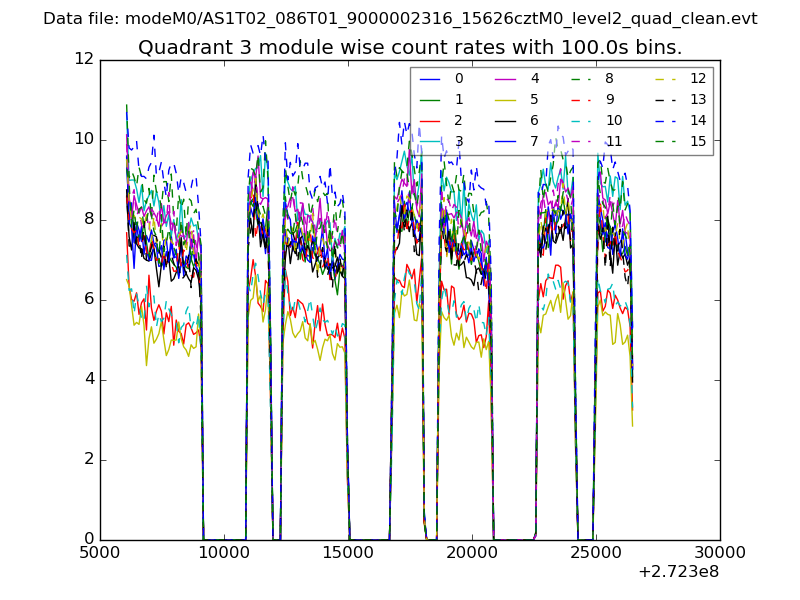
| Module-wise count rates for Quadrant C Data is divided into 100 sec bins |
 |
 |
| Module-wise count rates for Quadrant D Data is divided into 100 sec bins |
 |
 |
| Parameter | Plot |
|---|---|
| CZT HV Monitor | 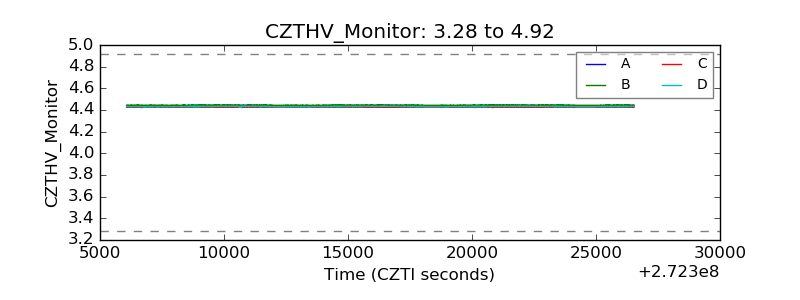 |
| D_VDD | 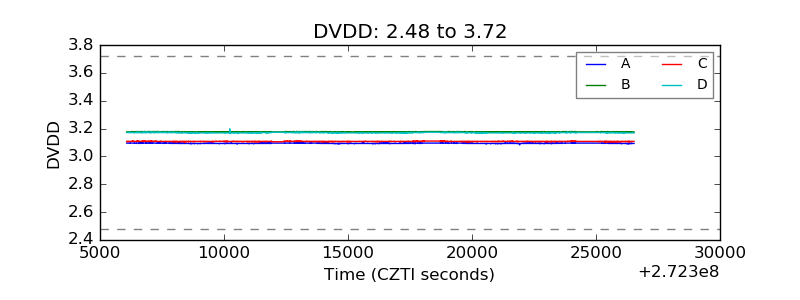 |
| Temperature 1 | 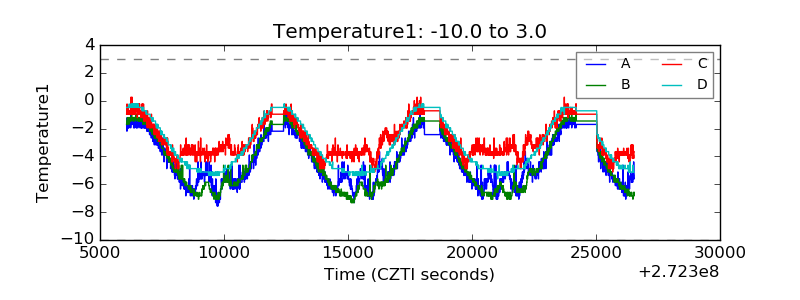 |
| Veto HV Monitor | 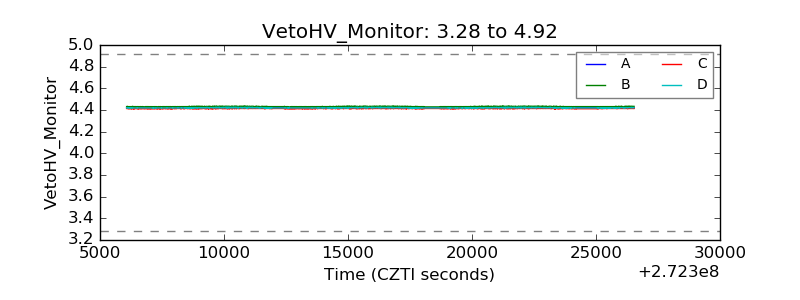 |
| Veto LLD | 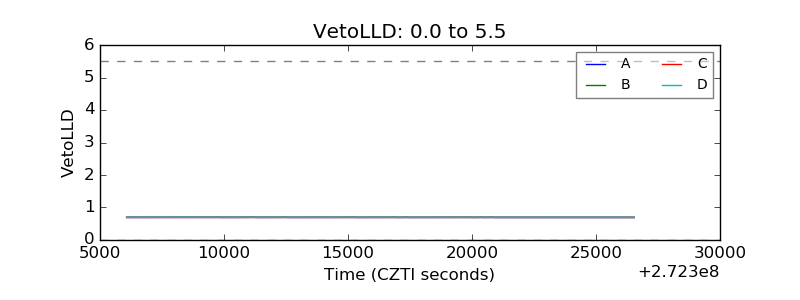 |
| Alpha Counter | 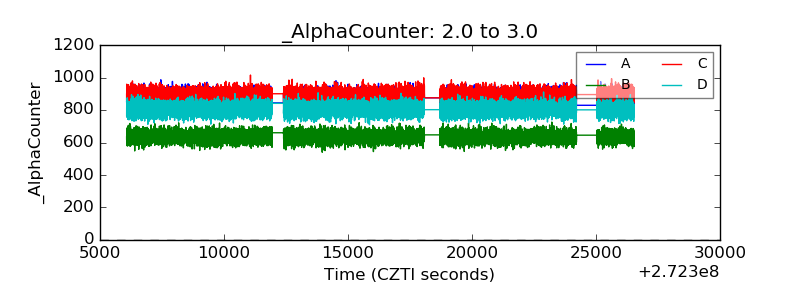 |
| _CPM_Rate | 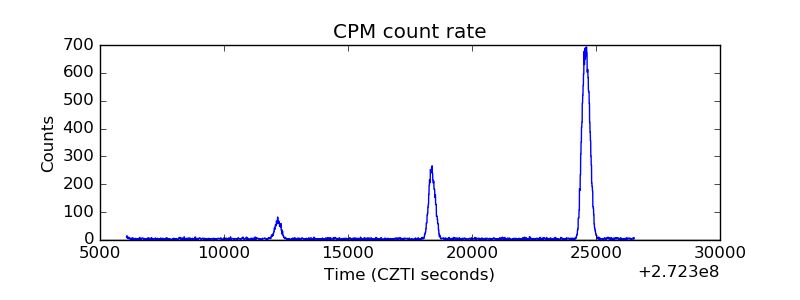 |
| CZT Counter | 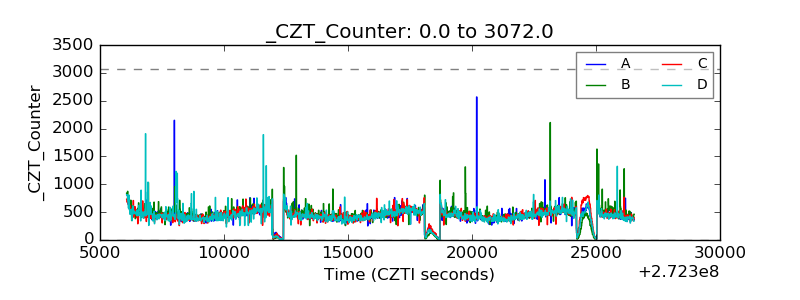 |
| +2.5 Volts monitor |  |
| +5 Volts monitor |  |
| _ROLL_ROT | 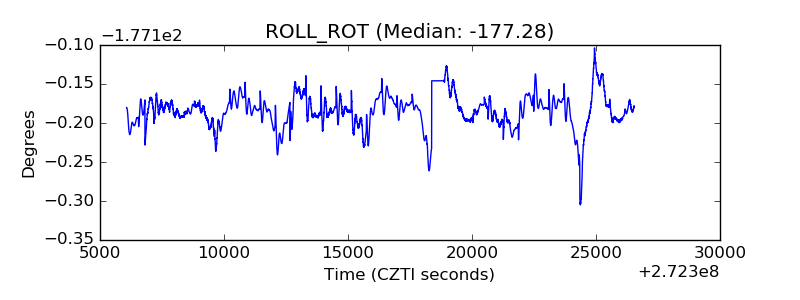 |
| _Roll_DEC | 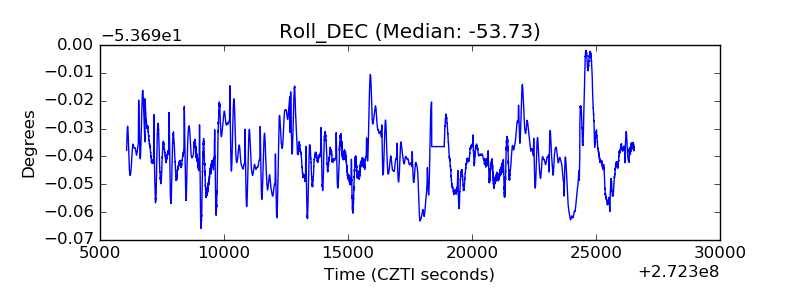 |
| _Roll_RA | 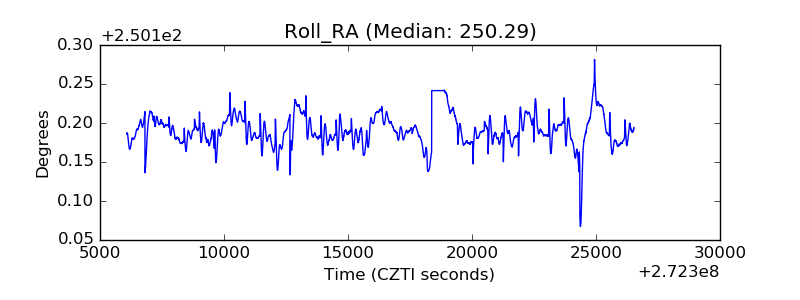 |
| Veto Counter | 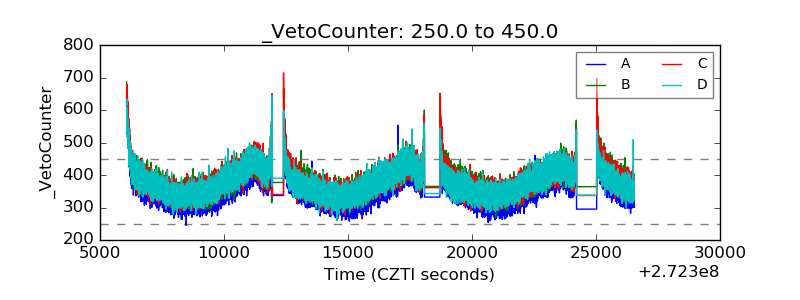 |