| Param | Original file | Final file |
|---|---|---|
| Filename | modeM0/AS1T02_086T01_9000002316_15627cztM0_level2.evt | modeM0/AS1T02_086T01_9000002316_15627cztM0_level2_quad_clean.evt |
| Size (bytes) | 469,183,680 | 99,656,640 |
| Size | 447.4 MB | 95.0 MB |
| Events in quadrant A | 3,142,374 | 640,213 |
| Events in quadrant B | 3,527,737 | 649,596 |
| Events in quadrant C | 3,177,422 | 632,357 |
| Events in quadrant D | 3,893,884 | 616,118 |
| Mode SS | |||
|---|---|---|---|
| Quadrant | BADHDUFLAG | Total packets | Discarded packets |
| A | 0 | 142 | 0 |
| B | 0 | 142 | 0 |
| C | 0 | 142 | 0 |
| D | 0 | 142 | 0 |
| Mode M9 | |||
|---|---|---|---|
| Quadrant | BADHDUFLAG | Total packets | Discarded packets |
| A | 0 | 18 | 0 |
| B | 0 | 18 | 0 |
| C | 0 | 18 | 0 |
| D | 0 | 18 | 0 |
| Mode M0 | |||
|---|---|---|---|
| Quadrant | BADHDUFLAG | Total packets | Discarded packets |
| A | 0 | 13975 | 3 |
| B | 0 | 14935 | 2 |
| C | 0 | 13933 | 2 |
| D | 0 | 16499 | 2 |
| Quadrant | Total seconds | Saturated seconds | Saturation percentage |
|---|---|---|---|
| A | 6886 | 16 | 0.232356% |
| B | 6886 | 58 | 0.842289% |
| C | 6886 | 39 | 0.566367% |
| D | 6886 | 21 | 0.304967% |
Noise dominated data is calculated using 1-second bins in cleaned event files. If a bin has >2000 counts, and if more than 50% of those come from <1% of pixels, then it is considered to be noise-dominated and hence unusable.
| Quadrant | # 1 sec bins | Bins with >0 counts | Bins with >2000 counts | High rate bins dominated by noise | Noise dominated (total time) | Noise dominated (detector-on time) | Marked lightcurve |
|---|---|---|---|---|---|---|---|
| A | 8702 | 6888 | 1 | 1 | 0.01% | 0.01% | 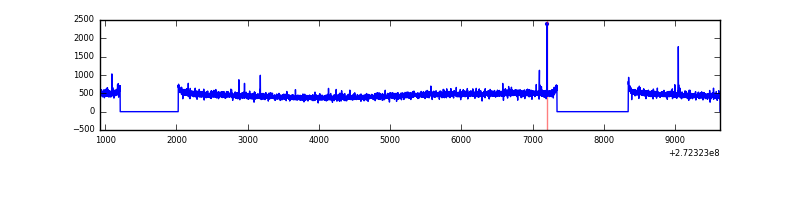 |
| B | 8702 | 6889 | 23 | 23 | 0.26% | 0.33% | 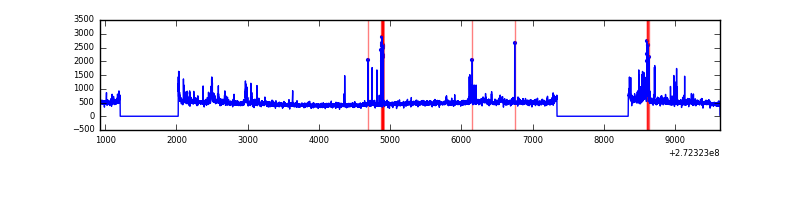 |
| C | 8702 | 6889 | 0 | 0 | 0.00% | 0.00% | 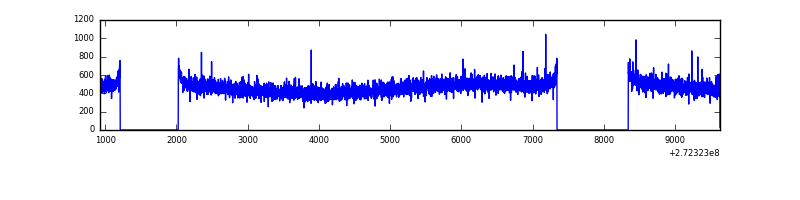 |
| D | 8702 | 6888 | 3 | 3 | 0.03% | 0.04% | 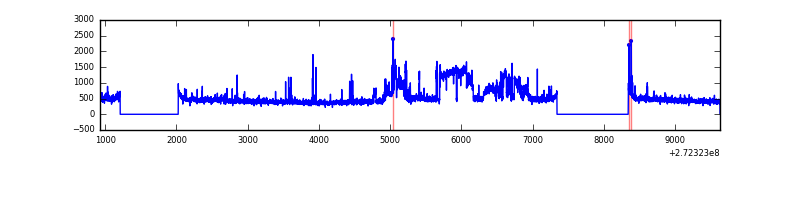 |
Top three noisy pixels from each quadrant. If the there are fewer than three noisy pixels in the level2.evt file, extra rows are filled as -1
| Pixel properties | Quadrant properties | ||||||
|---|---|---|---|---|---|---|---|
| Quadrant | DetID | PixID | Counts | Sigma | Mean | Median | Sigma |
| A | 3 | 80 | 11404 | 64.77 | 810 | 792 | 163.8 |
| A | 13 | 248 | 9654 | 54.09 | 810 | 792 | 163.8 |
| A | 0 | 226 | 7340 | 39.96 | 810 | 792 | 163.8 |
| B | 4 | 251 | 87497 | 556.72 | 813 | 792 | 155.7 |
| B | 4 | 48 | 72235 | 458.73 | 813 | 792 | 155.7 |
| B | 5 | 65 | 54659 | 345.87 | 813 | 792 | 155.7 |
| C | 14 | 238 | 119956 | 652.43 | 779 | 783 | 182.7 |
| C | 3 | 233 | 17769 | 92.99 | 779 | 783 | 182.7 |
| C | 13 | 61 | 5572 | 26.22 | 779 | 783 | 182.7 |
| D | 15 | 0 | 788491 | 4086.27 | 786 | 763 | 192.8 |
| D | 2 | 234 | 30967 | 156.68 | 786 | 763 | 192.8 |
| D | 2 | 33 | 27676 | 139.61 | 786 | 763 | 192.8 |
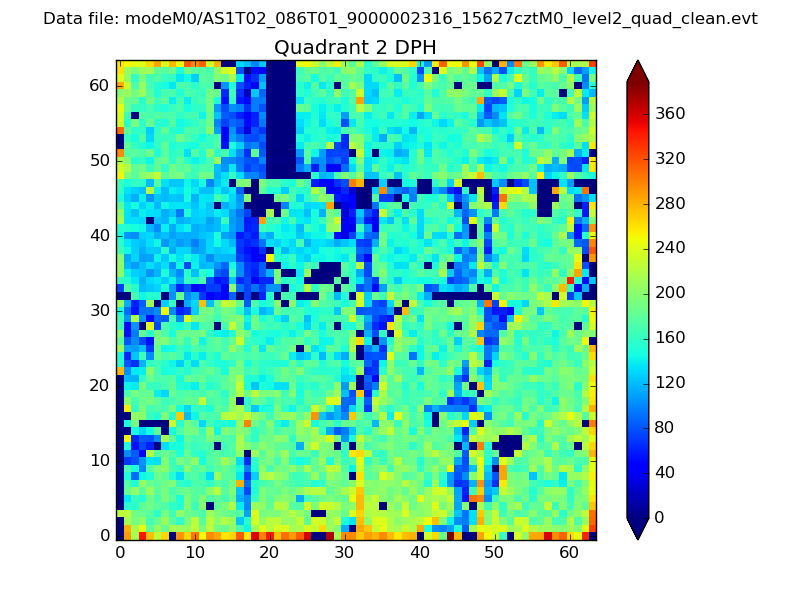
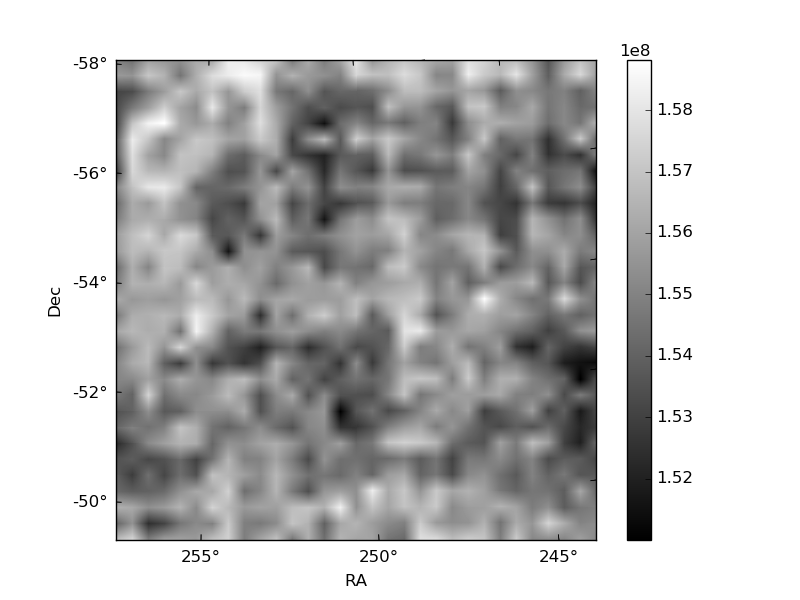
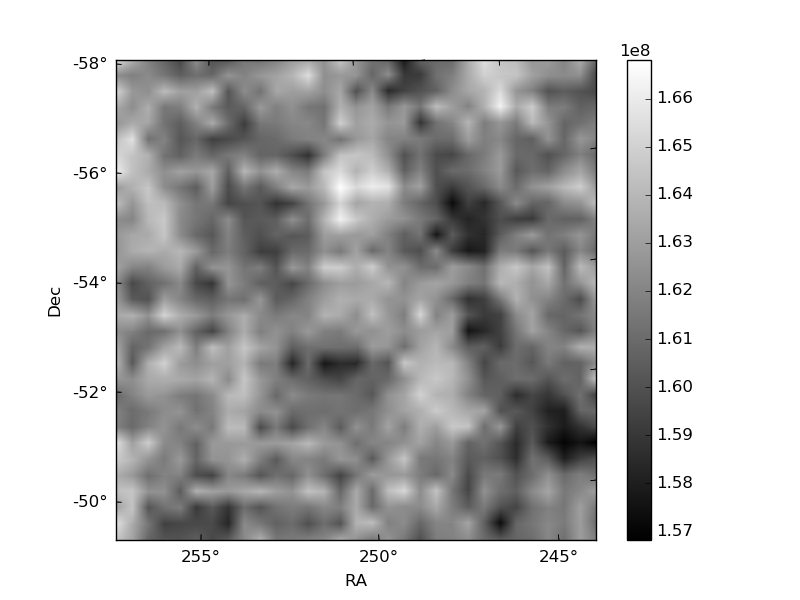
Histogram calculated using DETX and DETY for each event in the final _common_clean file
| Quadrant A | 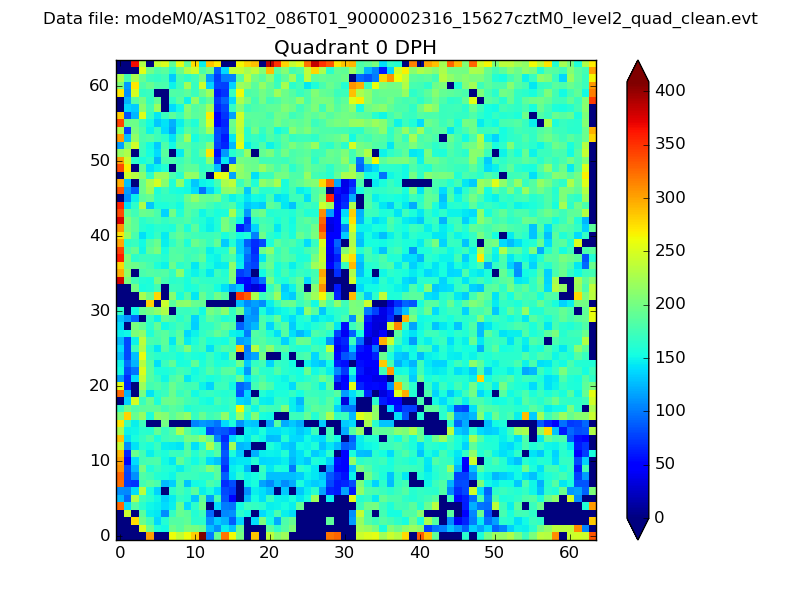 |
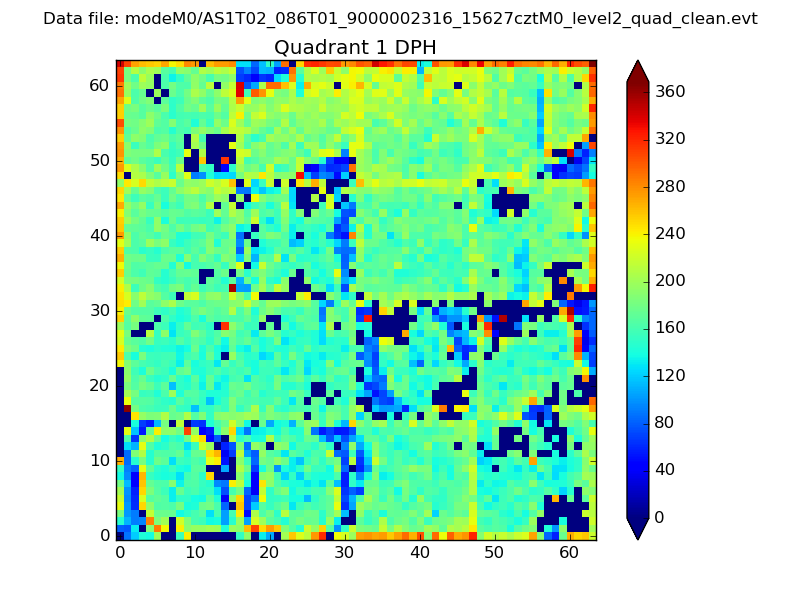 |
Quadrant B |
|---|---|---|---|
| Quadrant D | 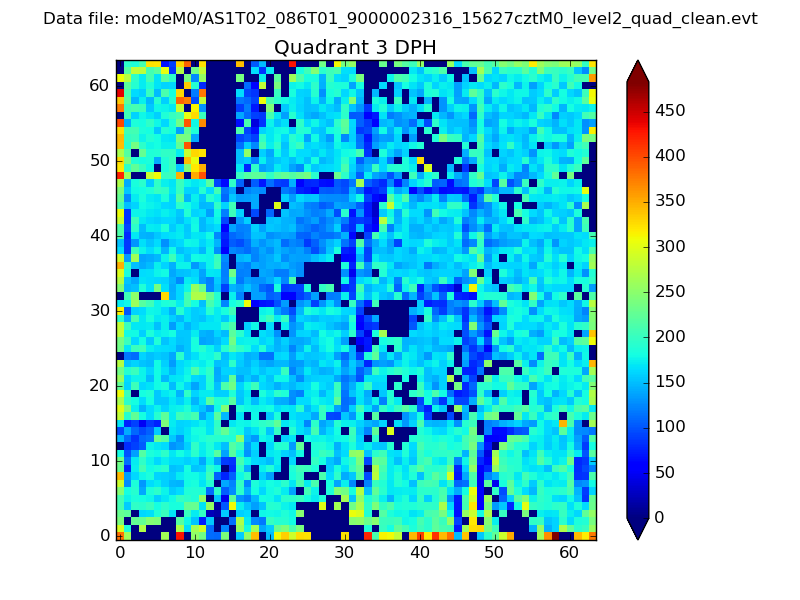 |
 |
Quadrant C |
| Plot type | Count rate plots | Images |
|---|---|---|
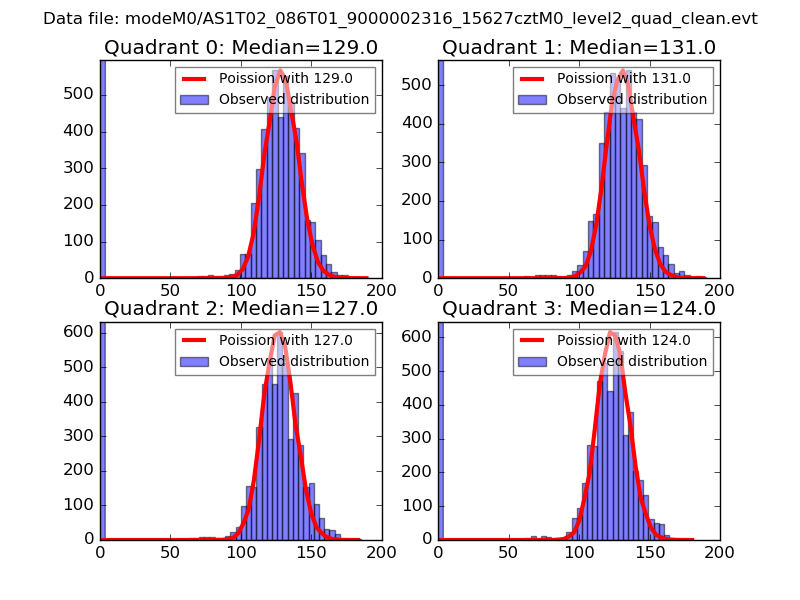
| Comparison with Poisson distribution Blue bars denote a histogram of data divided into 1 sec bins. Red curve is a Poisson curve with rate = median count rate of data. |
 |
 |
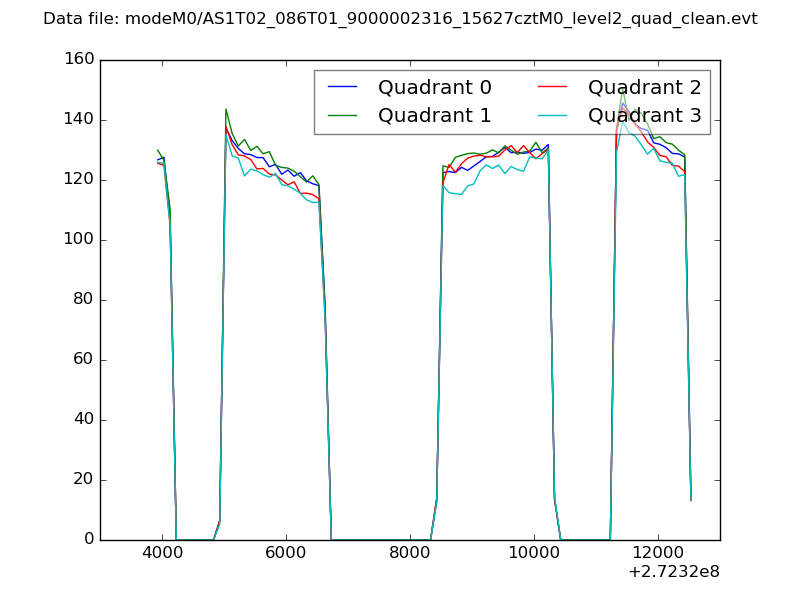
| Quadrant-wise count rates Data is divided into 100 sec bins |
 |
|
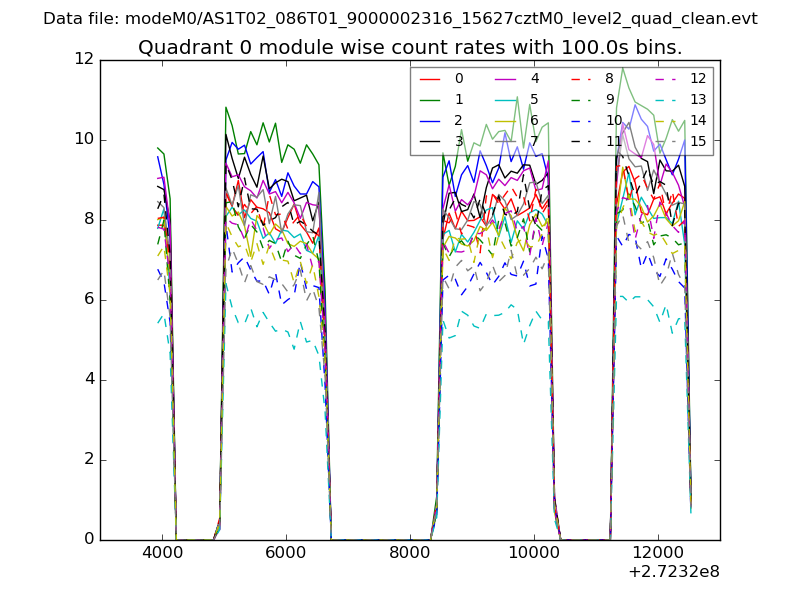
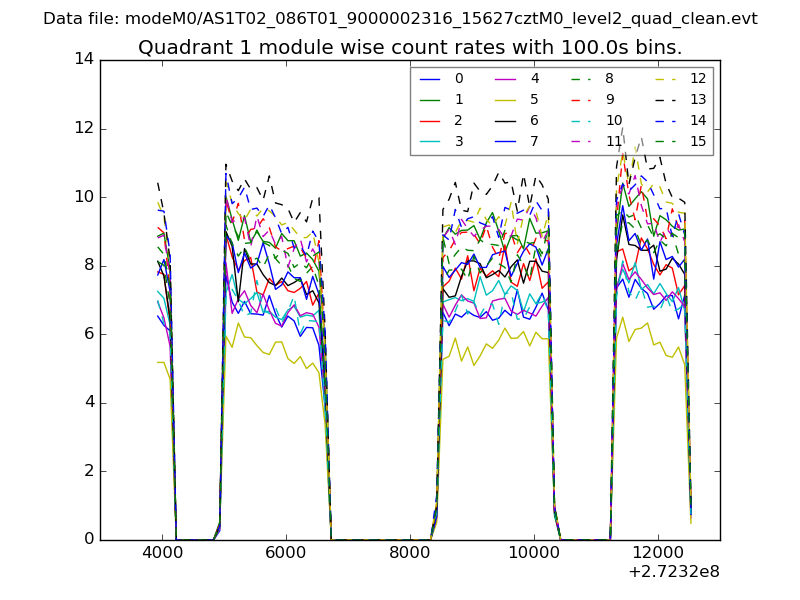
| Module-wise count rates for Quadrant A Data is divided into 100 sec bins |
 |
 |
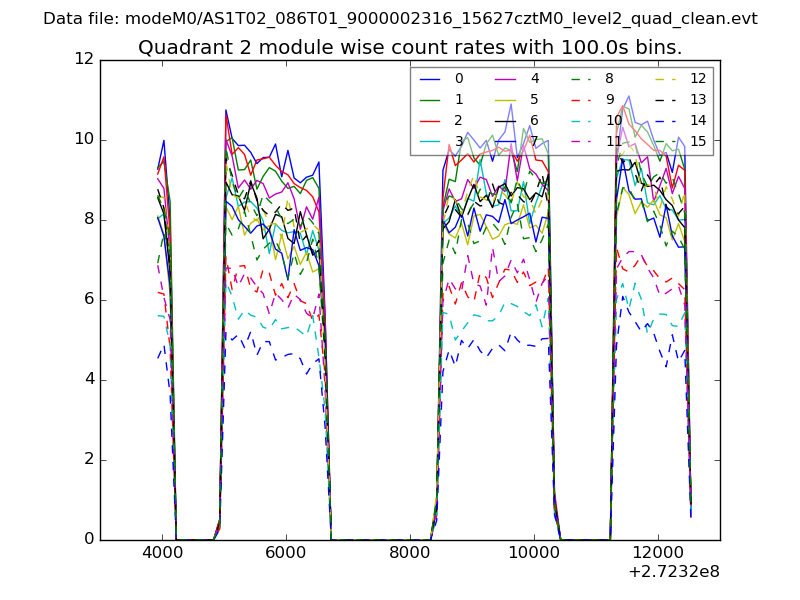
| Module-wise count rates for Quadrant B Data is divided into 100 sec bins |
 |
 |
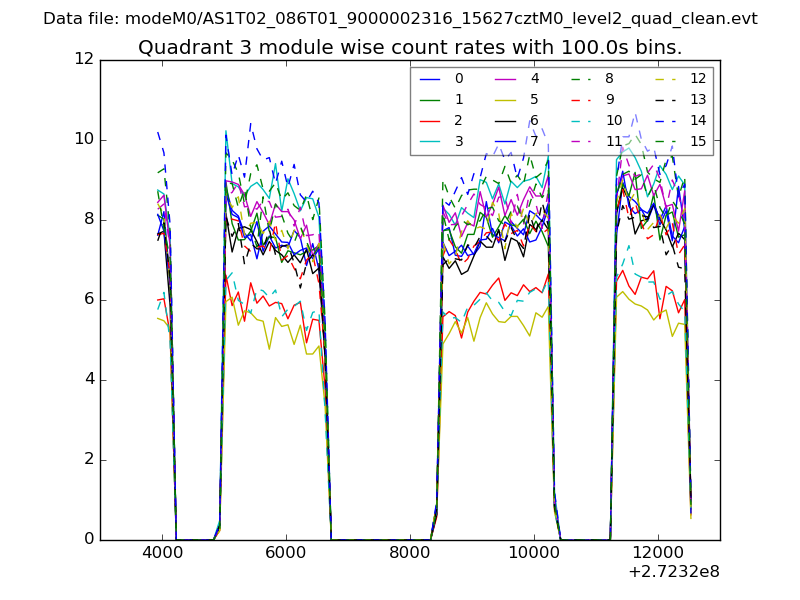
| Module-wise count rates for Quadrant C Data is divided into 100 sec bins |
 |
 |
| Module-wise count rates for Quadrant D Data is divided into 100 sec bins |
 |
 |
| Parameter | Plot |
|---|---|
| CZT HV Monitor |  |
| D_VDD | 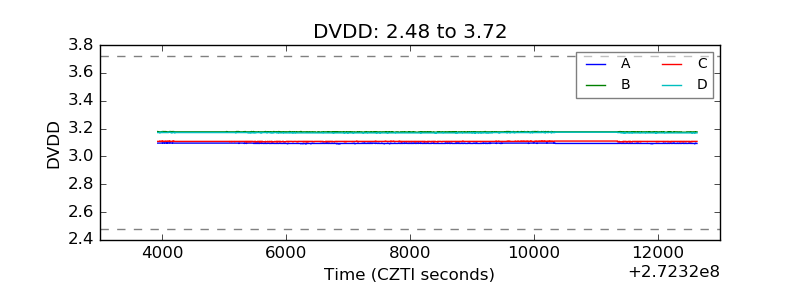 |
| Temperature 1 | 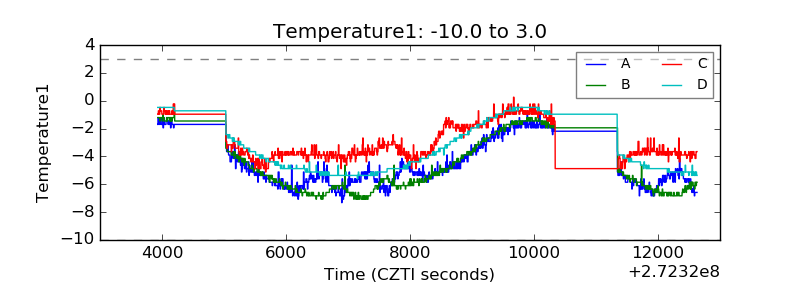 |
| Veto HV Monitor | 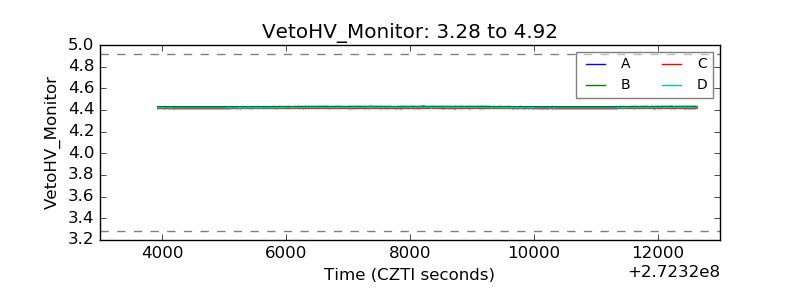 |
| Veto LLD | 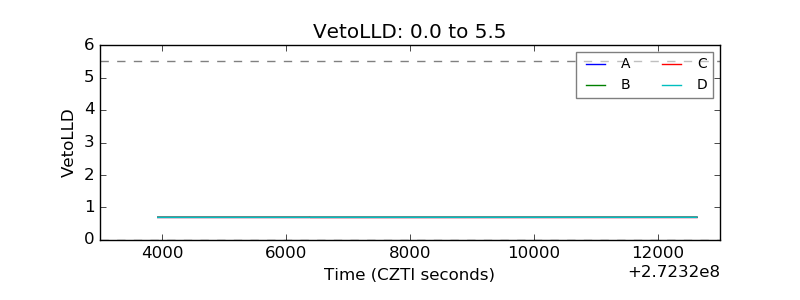 |
| Alpha Counter | 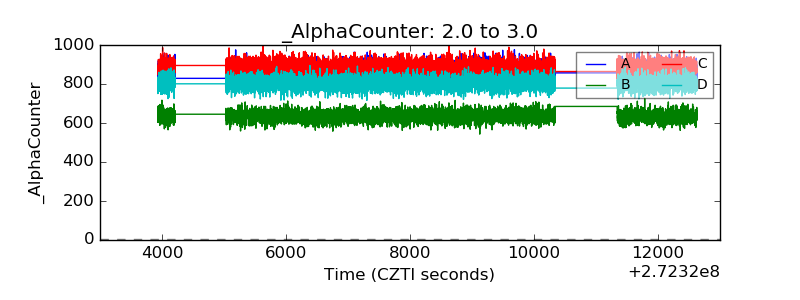 |
| _CPM_Rate | 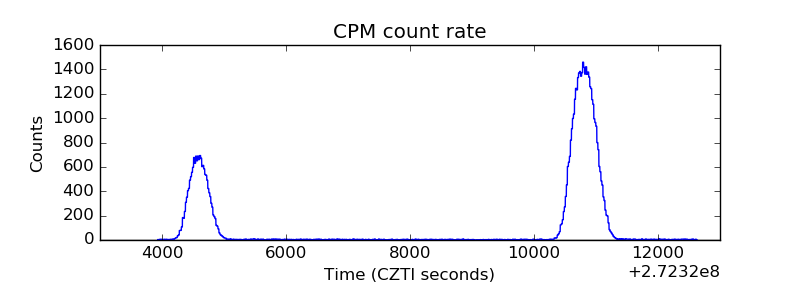 |
| CZT Counter | 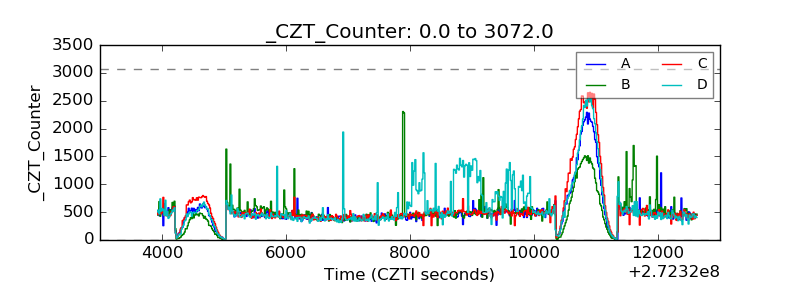 |
| +2.5 Volts monitor |  |
| +5 Volts monitor |  |
| _ROLL_ROT | 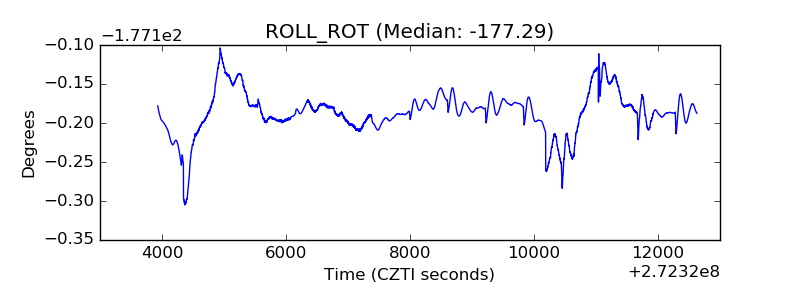 |
| _Roll_DEC | 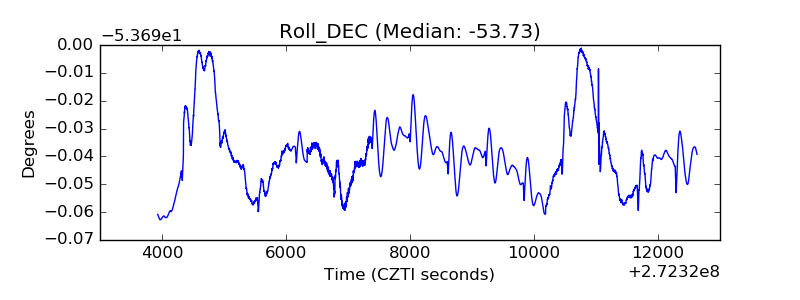 |
| _Roll_RA | 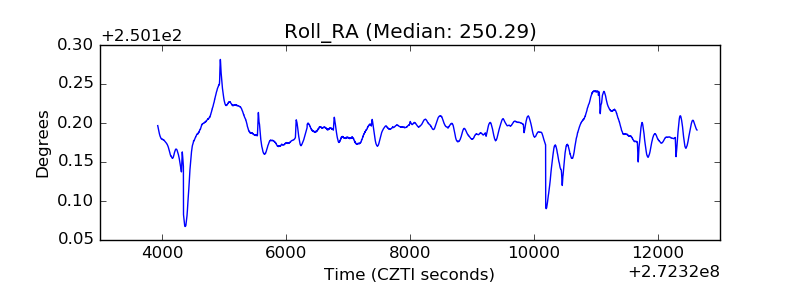 |
| Veto Counter | 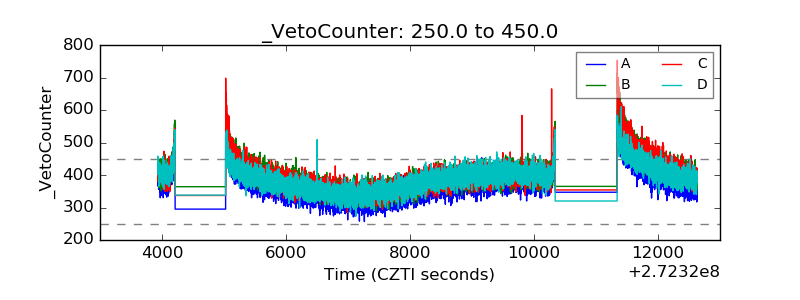 |