| Param | Original file | Final file |
|---|---|---|
| Filename | modeM0/AS1T02_086T01_9000002316_15630cztM0_level2.evt | modeM0/AS1T02_086T01_9000002316_15630cztM0_level2_quad_clean.evt |
| Size (bytes) | 464,679,360 | 81,711,360 |
| Size | 443.2 MB | 77.9 MB |
| Events in quadrant A | 3,146,525 | 506,968 |
| Events in quadrant B | 3,311,865 | 519,809 |
| Events in quadrant C | 4,044,016 | 501,762 |
| Events in quadrant D | 3,130,644 | 493,968 |
| Mode SS | |||
|---|---|---|---|
| Quadrant | BADHDUFLAG | Total packets | Discarded packets |
| A | 0 | 132 | 0 |
| B | 0 | 132 | 0 |
| C | 0 | 132 | 0 |
| D | 0 | 132 | 0 |
| Mode M9 | |||
|---|---|---|---|
| Quadrant | BADHDUFLAG | Total packets | Discarded packets |
| A | 0 | 17 | 0 |
| B | 0 | 17 | 0 |
| C | 0 | 17 | 0 |
| D | 0 | 18 | 0 |
| Mode M0 | |||
|---|---|---|---|
| Quadrant | BADHDUFLAG | Total packets | Discarded packets |
| A | 0 | 13431 | 3 |
| B | 0 | 13787 | 2 |
| C | 0 | 16213 | 2 |
| D | 0 | 13589 | 2 |
| Quadrant | Total seconds | Saturated seconds | Saturation percentage |
|---|---|---|---|
| A | 6474 | 29 | 0.447946% |
| B | 6474 | 42 | 0.648749% |
| C | 6474 | 129 | 1.992586% |
| D | 6474 | 48 | 0.741427% |
Noise dominated data is calculated using 1-second bins in cleaned event files. If a bin has >2000 counts, and if more than 50% of those come from <1% of pixels, then it is considered to be noise-dominated and hence unusable.
| Quadrant | # 1 sec bins | Bins with >0 counts | Bins with >2000 counts | High rate bins dominated by noise | Noise dominated (total time) | Noise dominated (detector-on time) | Marked lightcurve |
|---|---|---|---|---|---|---|---|
| A | 7700 | 6475 | 1 | 1 | 0.01% | 0.02% | 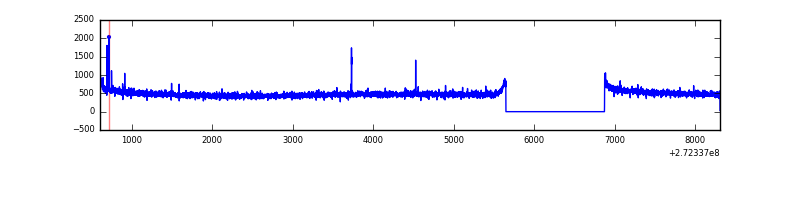 |
| B | 7700 | 6475 | 2 | 2 | 0.03% | 0.03% | 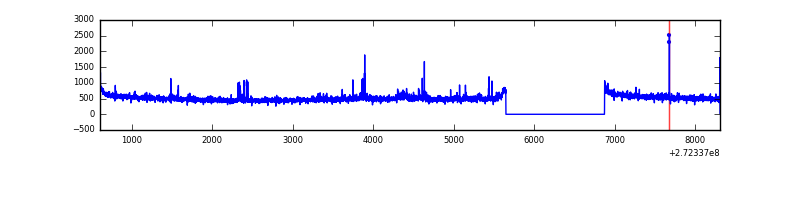 |
| C | 7700 | 6475 | 41 | 41 | 0.53% | 0.63% | 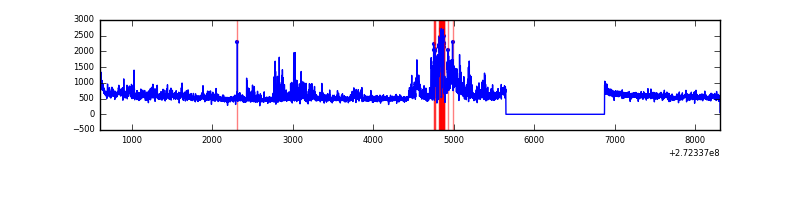 |
| D | 7700 | 6475 | 21 | 21 | 0.27% | 0.32% | 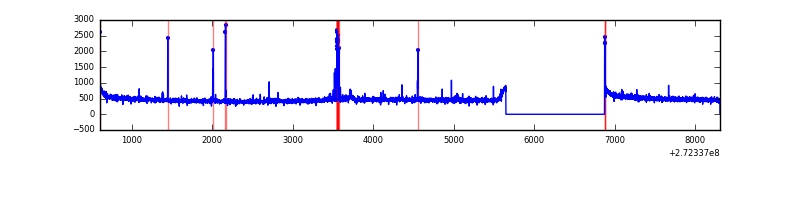 |
Top three noisy pixels from each quadrant. If the there are fewer than three noisy pixels in the level2.evt file, extra rows are filled as -1
| Pixel properties | Quadrant properties | ||||||
|---|---|---|---|---|---|---|---|
| Quadrant | DetID | PixID | Counts | Sigma | Mean | Median | Sigma |
| A | 9 | 143 | 15527 | 91.2 | 812 | 796 | 161.5 |
| A | 0 | 226 | 7178 | 39.51 | 812 | 796 | 161.5 |
| A | 12 | 194 | 5969 | 32.03 | 812 | 796 | 161.5 |
| B | 4 | 251 | 26325 | 167.02 | 820 | 799 | 152.8 |
| B | 3 | 209 | 23363 | 147.64 | 820 | 799 | 152.8 |
| B | 0 | 214 | 19787 | 124.24 | 820 | 799 | 152.8 |
| C | 3 | 233 | 791810 | 4337.65 | 793 | 800 | 182.4 |
| C | 14 | 238 | 125434 | 683.45 | 793 | 800 | 182.4 |
| C | 7 | 247 | 29901 | 159.58 | 793 | 800 | 182.4 |
| D | 2 | 33 | 55063 | 283.32 | 796 | 773 | 191.6 |
| D | 10 | 70 | 27390 | 138.91 | 796 | 773 | 191.6 |
| D | 2 | 234 | 26024 | 131.78 | 796 | 773 | 191.6 |
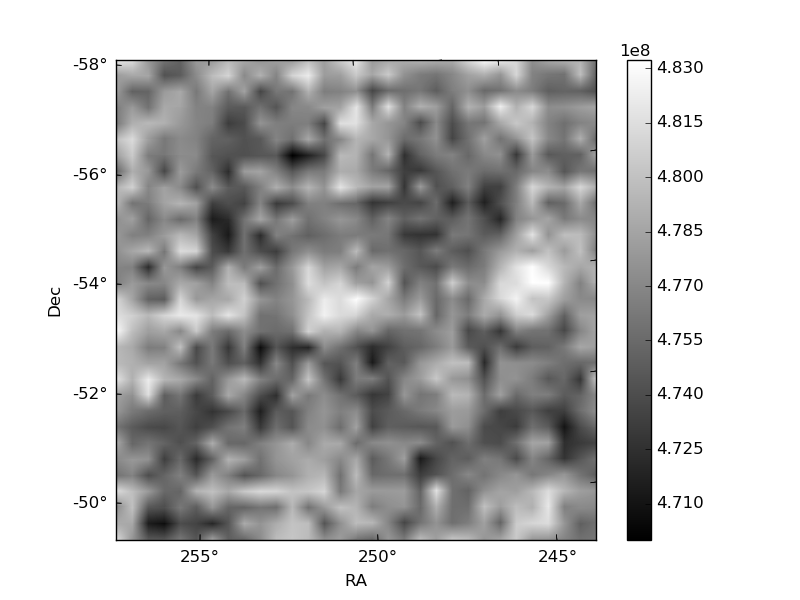
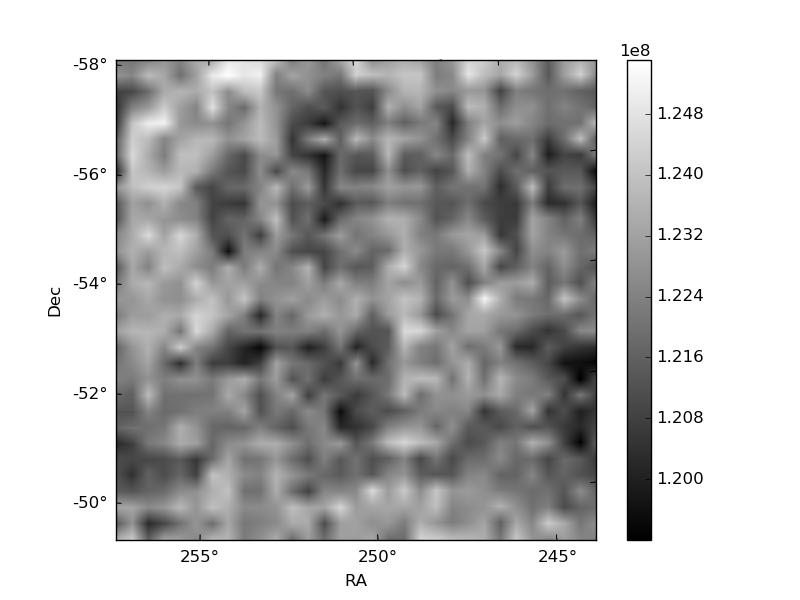
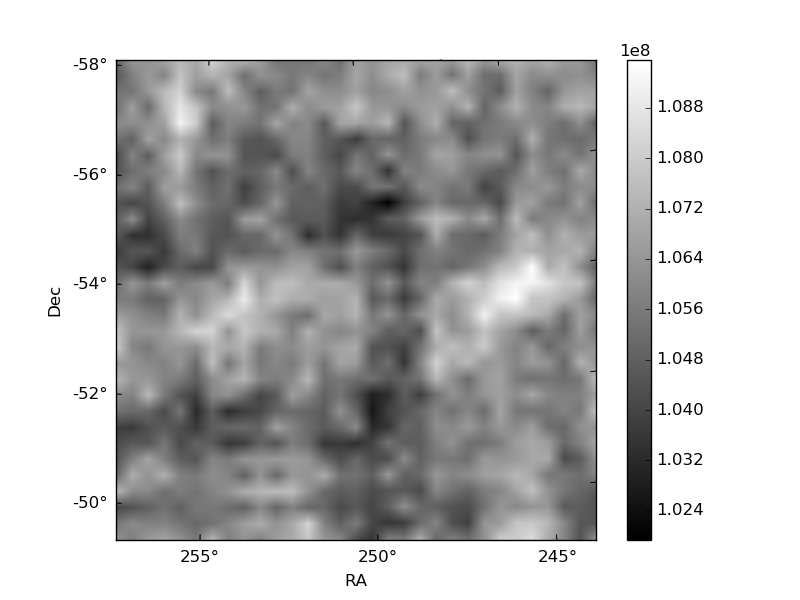
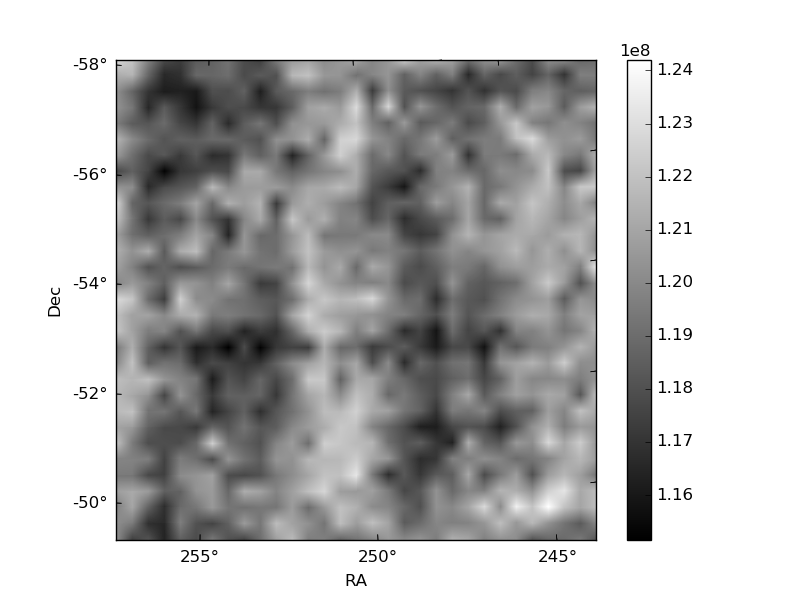
Histogram calculated using DETX and DETY for each event in the final _common_clean file
| Quadrant A | 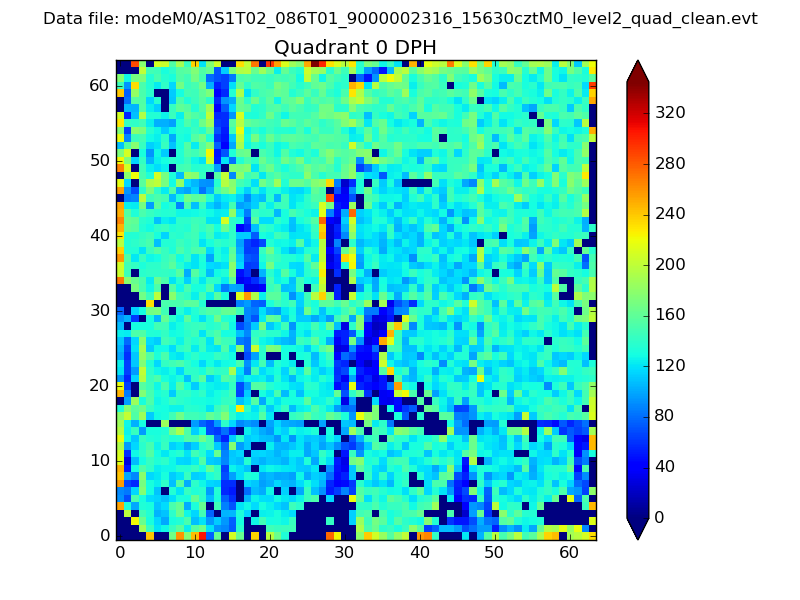 |
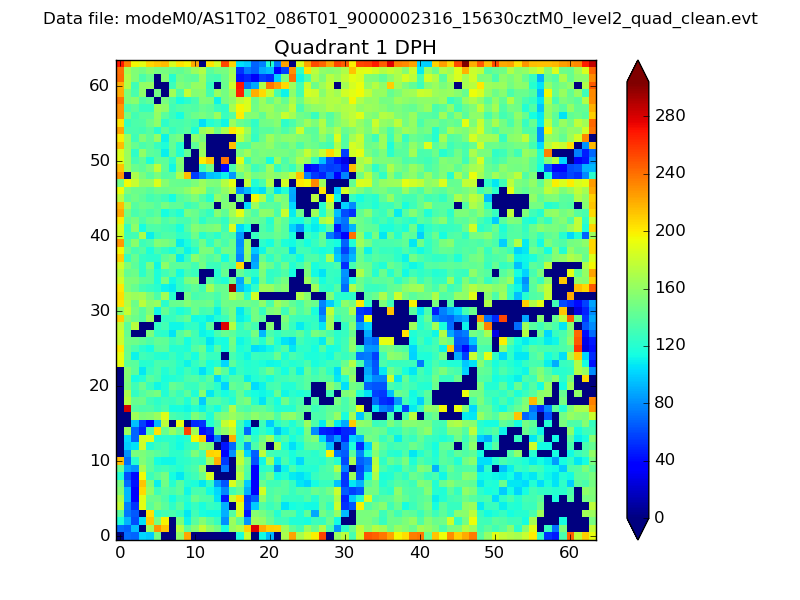 |
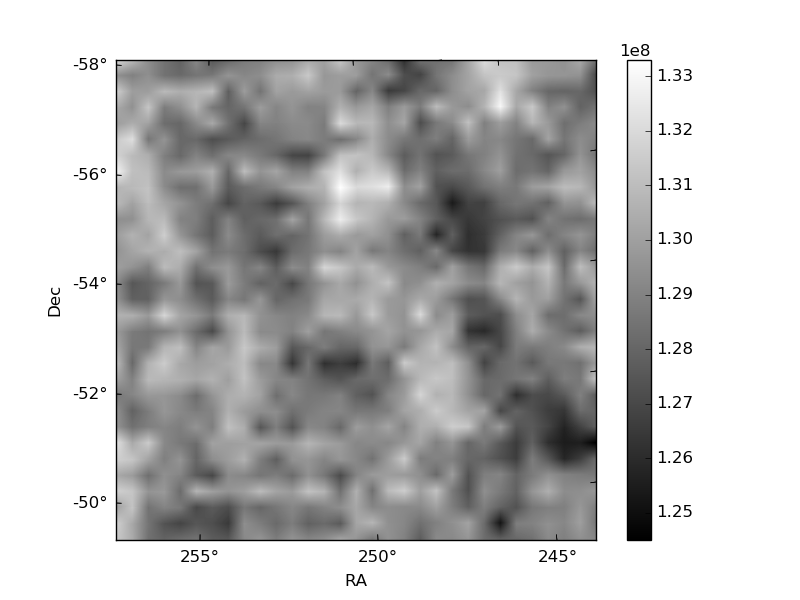
Quadrant B |
|---|---|---|---|
| Quadrant D | 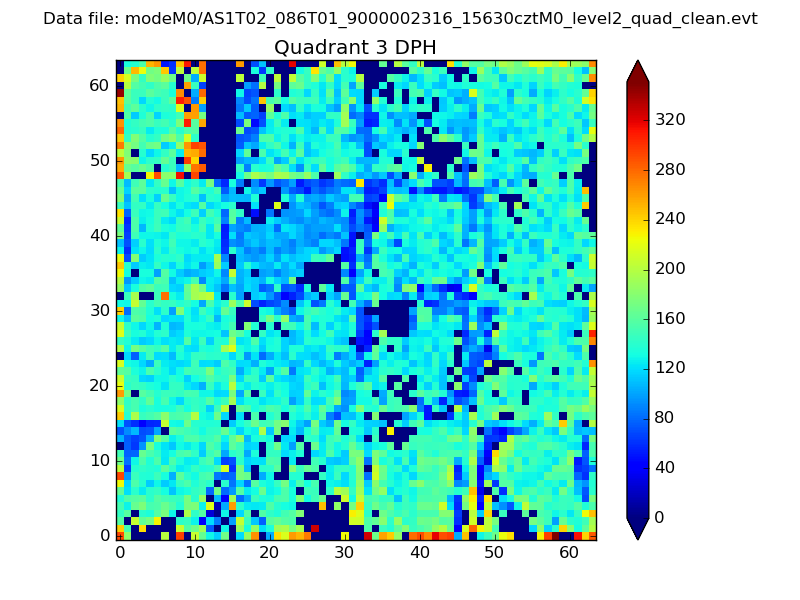 |
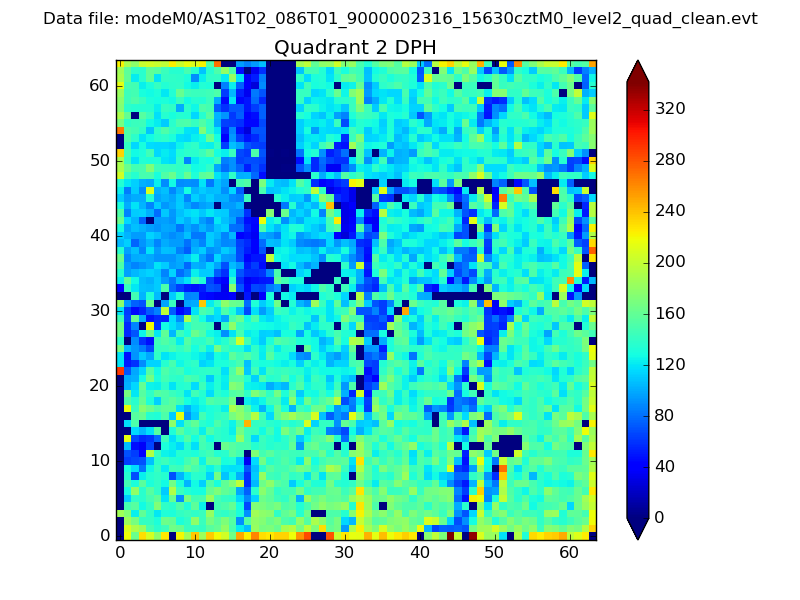 |
Quadrant C |
| Plot type | Count rate plots | Images |
|---|---|---|
| Comparison with Poisson distribution Blue bars denote a histogram of data divided into 1 sec bins. Red curve is a Poisson curve with rate = median count rate of data. |
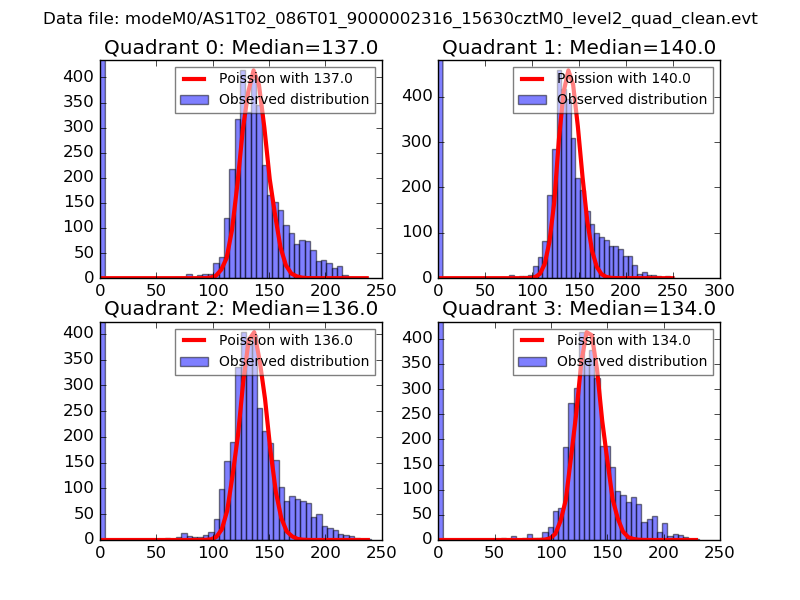 |
 |
| Quadrant-wise count rates Data is divided into 100 sec bins |
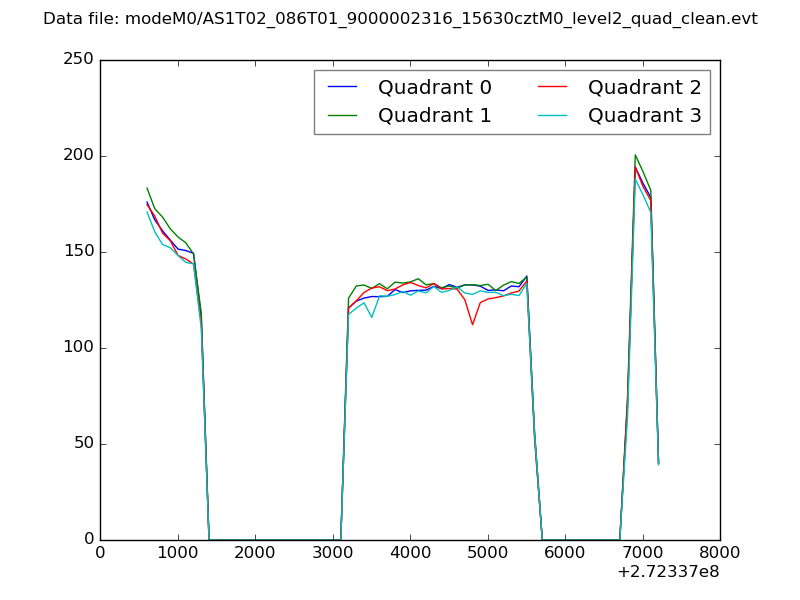 |
|
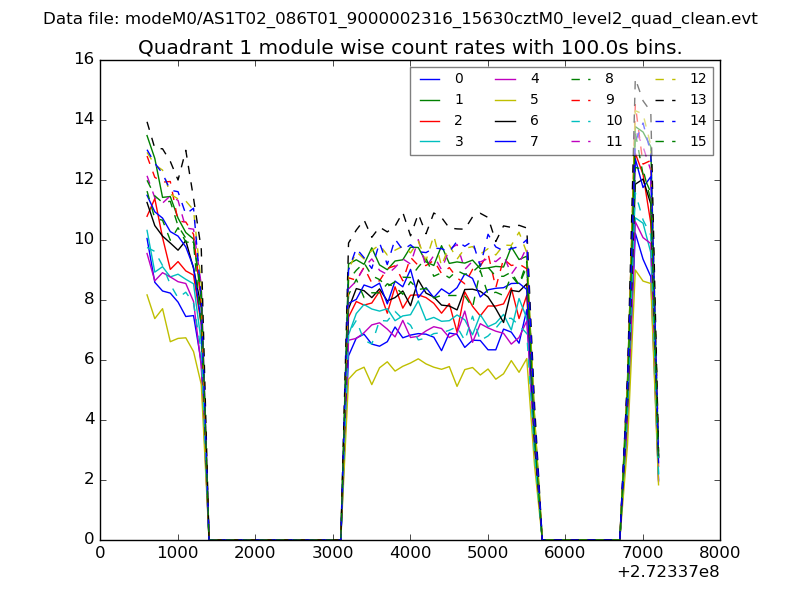
| Module-wise count rates for Quadrant A Data is divided into 100 sec bins |
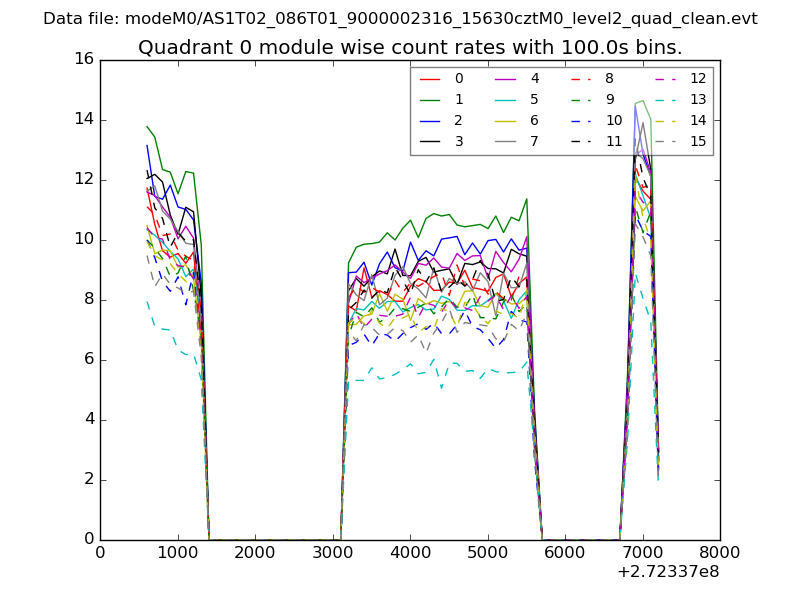 |
 |
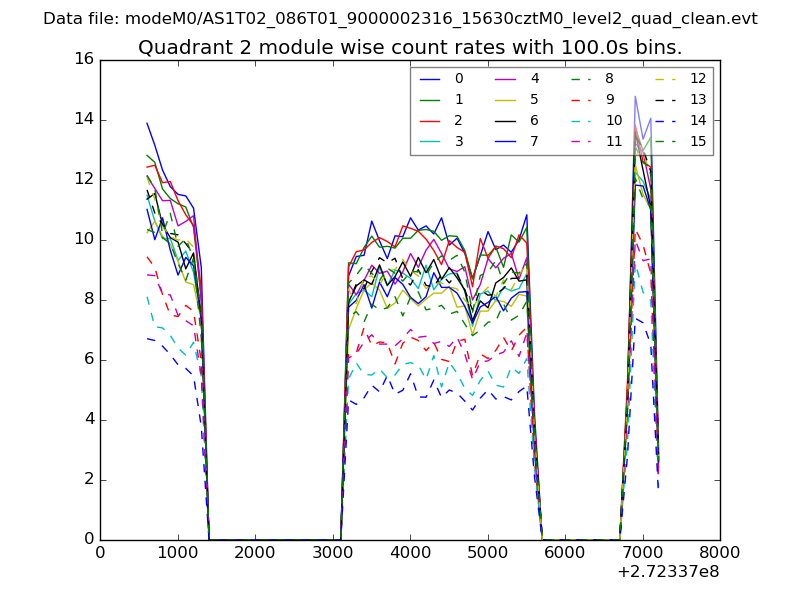
| Module-wise count rates for Quadrant B Data is divided into 100 sec bins |
 |
 |
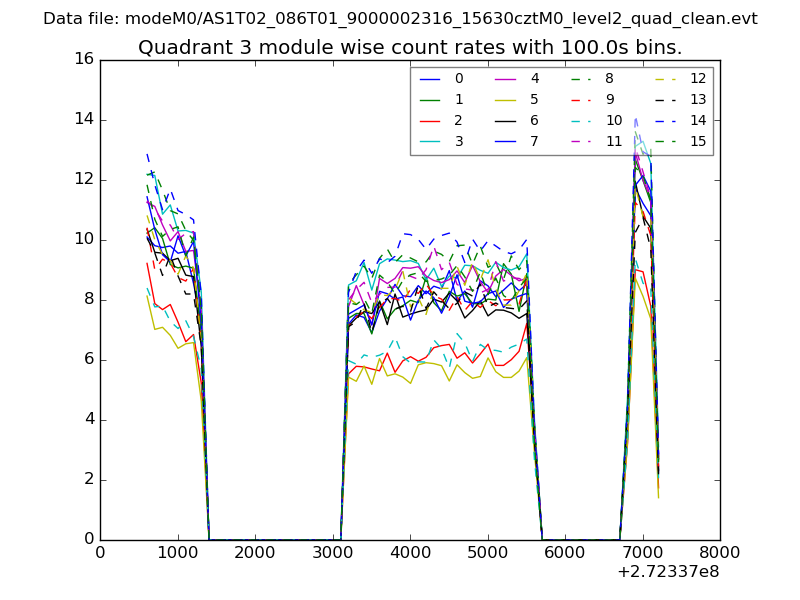
| Module-wise count rates for Quadrant C Data is divided into 100 sec bins |
 |
 |
| Module-wise count rates for Quadrant D Data is divided into 100 sec bins |
 |
 |
| Parameter | Plot |
|---|---|
| CZT HV Monitor | 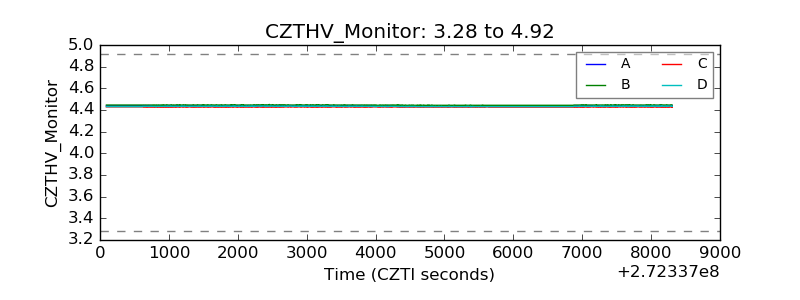 |
| D_VDD | 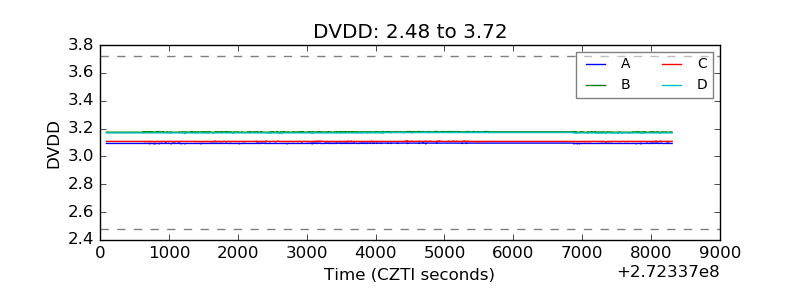 |
| Temperature 1 | 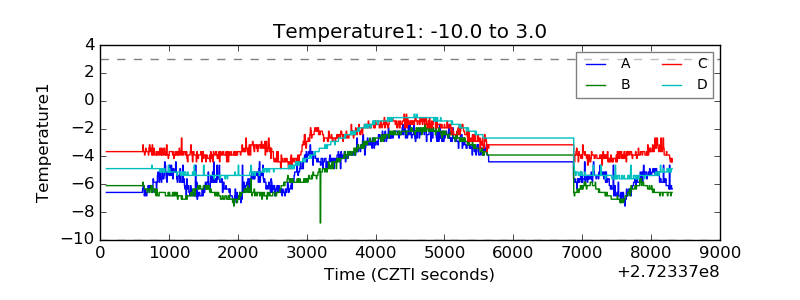 |
| Veto HV Monitor | 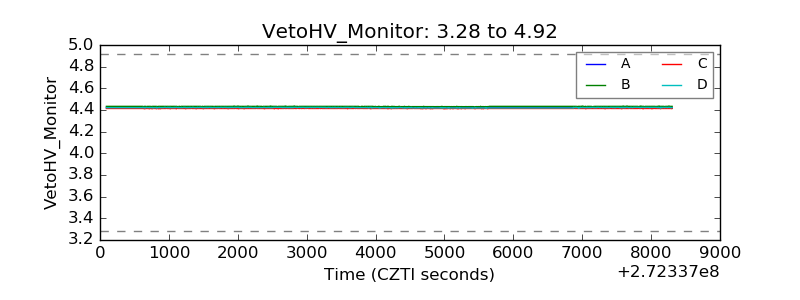 |
| Veto LLD | 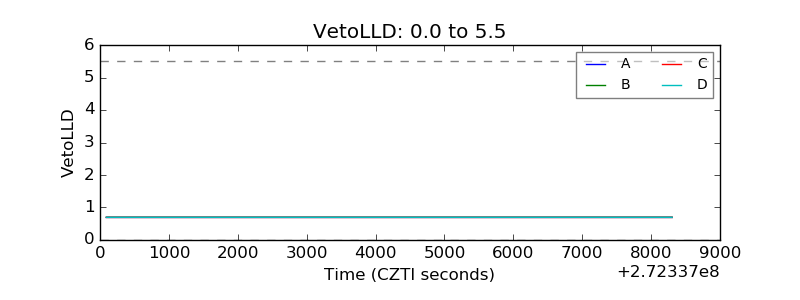 |
| Alpha Counter | 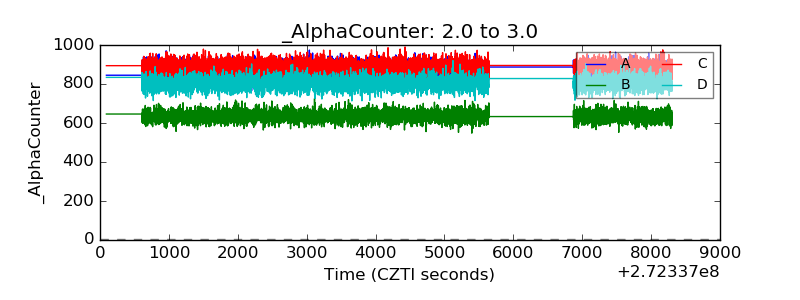 |
| _CPM_Rate | 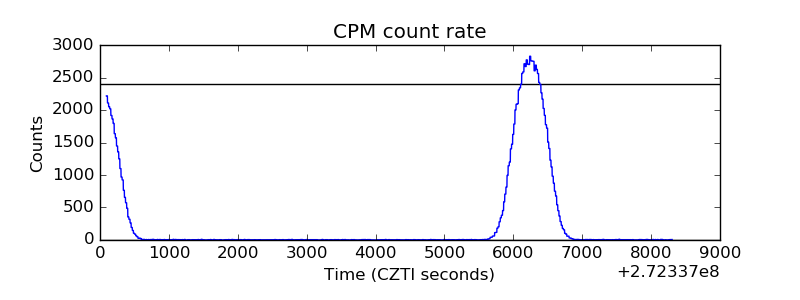 |
| CZT Counter | 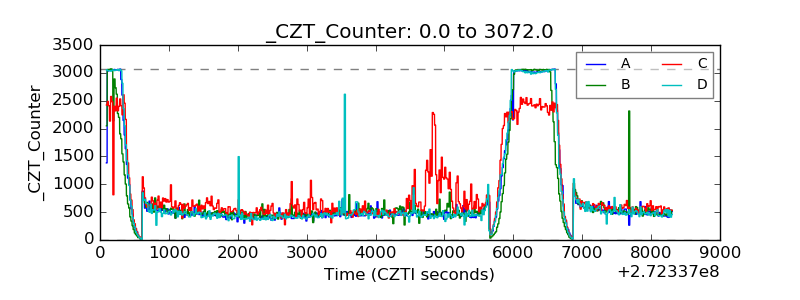 |
| +2.5 Volts monitor |  |
| +5 Volts monitor |  |
| _ROLL_ROT | 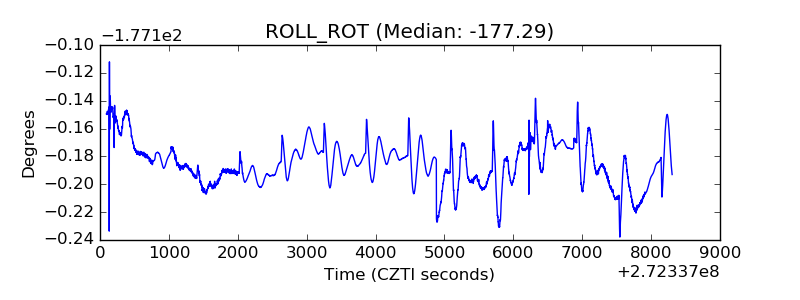 |
| _Roll_DEC | 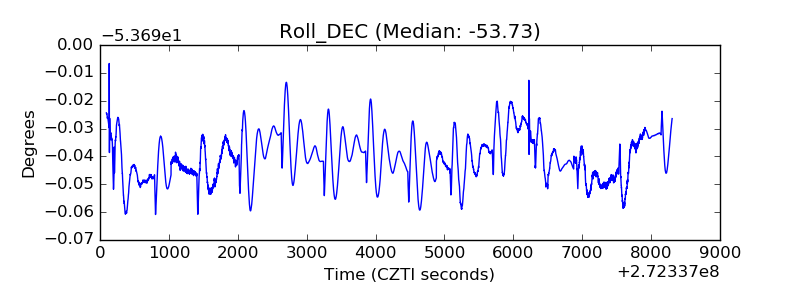 |
| _Roll_RA | 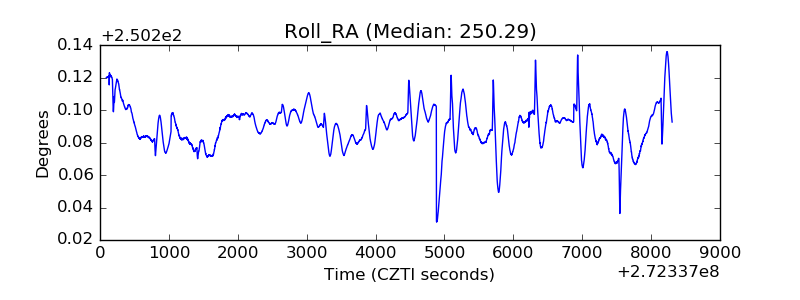 |
| Veto Counter | 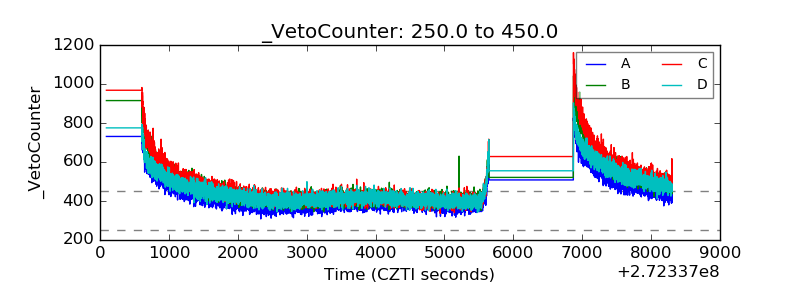 |