| Param | Original file | Final file |
|---|---|---|
| Filename | modeM0/AS1T02_086T01_9000002316_15631cztM0_level2.evt | modeM0/AS1T02_086T01_9000002316_15631cztM0_level2_quad_clean.evt |
| Size (bytes) | 539,568,000 | 71,812,800 |
| Size | 514.6 MB | 68.5 MB |
| Events in quadrant A | 3,197,246 | 441,971 |
| Events in quadrant B | 3,360,231 | 450,241 |
| Events in quadrant C | 3,508,442 | 443,193 |
| Events in quadrant D | 5,848,233 | 399,497 |
| Mode SS | |||
|---|---|---|---|
| Quadrant | BADHDUFLAG | Total packets | Discarded packets |
| A | 0 | 128 | 0 |
| B | 0 | 128 | 0 |
| C | 0 | 128 | 0 |
| D | 0 | 128 | 0 |
| Mode M9 | |||
|---|---|---|---|
| Quadrant | BADHDUFLAG | Total packets | Discarded packets |
| A | 0 | 23 | 0 |
| B | 0 | 23 | 0 |
| C | 0 | 23 | 0 |
| D | 0 | 24 | 0 |
| Mode M0 | |||
|---|---|---|---|
| Quadrant | BADHDUFLAG | Total packets | Discarded packets |
| A | 0 | 13248 | 3 |
| B | 0 | 13791 | 2 |
| C | 0 | 14428 | 2 |
| D | 0 | 21556 | 2 |
| Quadrant | Total seconds | Saturated seconds | Saturation percentage |
|---|---|---|---|
| A | 6291 | 58 | 0.921952% |
| B | 6291 | 67 | 1.065014% |
| C | 6291 | 110 | 1.748530% |
| D | 6291 | 846 | 13.447783% |
Noise dominated data is calculated using 1-second bins in cleaned event files. If a bin has >2000 counts, and if more than 50% of those come from <1% of pixels, then it is considered to be noise-dominated and hence unusable.
| Quadrant | # 1 sec bins | Bins with >0 counts | Bins with >2000 counts | High rate bins dominated by noise | Noise dominated (total time) | Noise dominated (detector-on time) | Marked lightcurve |
|---|---|---|---|---|---|---|---|
| A | 7587 | 6292 | 0 | 0 | 0.00% | 0.00% | 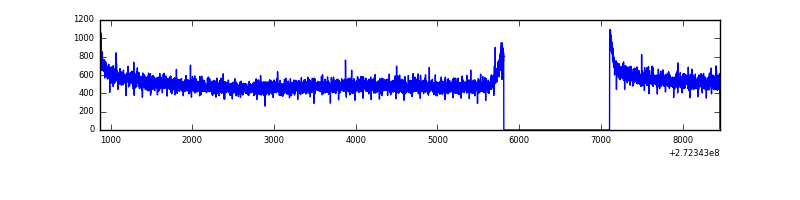 |
| B | 7587 | 6292 | 2 | 2 | 0.03% | 0.03% | 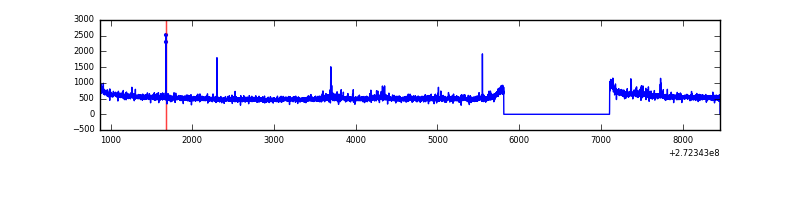 |
| C | 7587 | 6292 | 1 | 1 | 0.01% | 0.02% | 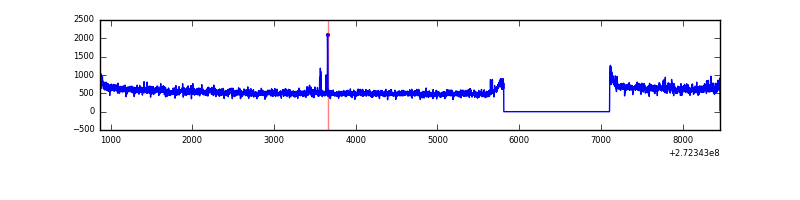 |
| D | 7587 | 6292 | 793 | 793 | 10.45% | 12.60% | 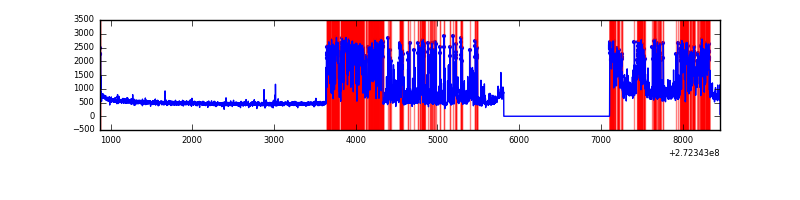 |
Top three noisy pixels from each quadrant. If the there are fewer than three noisy pixels in the level2.evt file, extra rows are filled as -1
| Pixel properties | Quadrant properties | ||||||
|---|---|---|---|---|---|---|---|
| Quadrant | DetID | PixID | Counts | Sigma | Mean | Median | Sigma |
| A | 0 | 226 | 7415 | 39.93 | 830 | 817 | 165.2 |
| A | 12 | 194 | 6193 | 32.54 | 830 | 817 | 165.2 |
| A | 3 | 137 | 5218 | 26.64 | 830 | 817 | 165.2 |
| B | 3 | 209 | 32925 | 208.1 | 834 | 813 | 154.3 |
| B | 4 | 251 | 25744 | 161.56 | 834 | 813 | 154.3 |
| B | 12 | 111 | 16994 | 104.86 | 834 | 813 | 154.3 |
| C | 3 | 233 | 189049 | 1015.22 | 813 | 820 | 185.4 |
| C | 14 | 238 | 129551 | 694.31 | 813 | 820 | 185.4 |
| C | 10 | 22 | 18686 | 96.36 | 813 | 820 | 185.4 |
| D | 1 | 52 | 2770090 | 14725.12 | 782 | 761 | 188.1 |
| D | 10 | 40 | 71197 | 374.52 | 782 | 761 | 188.1 |
| D | 2 | 234 | 22781 | 117.09 | 782 | 761 | 188.1 |
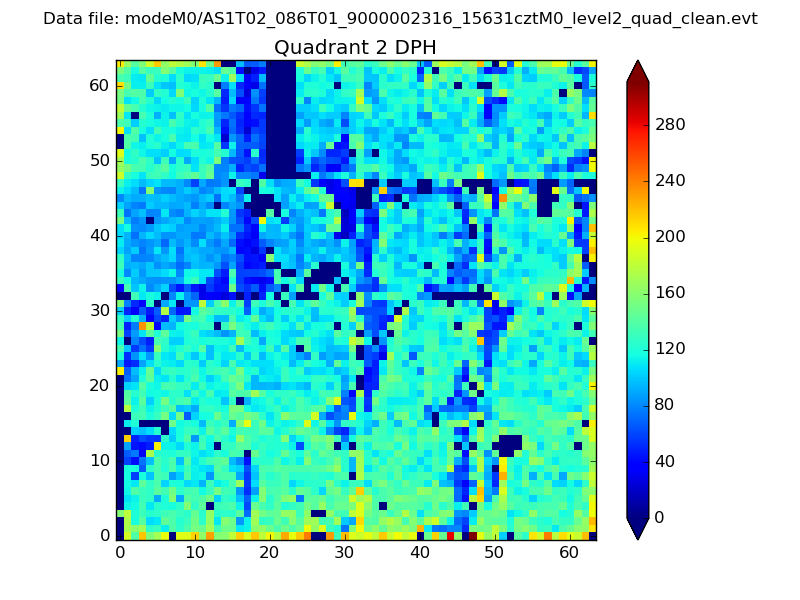
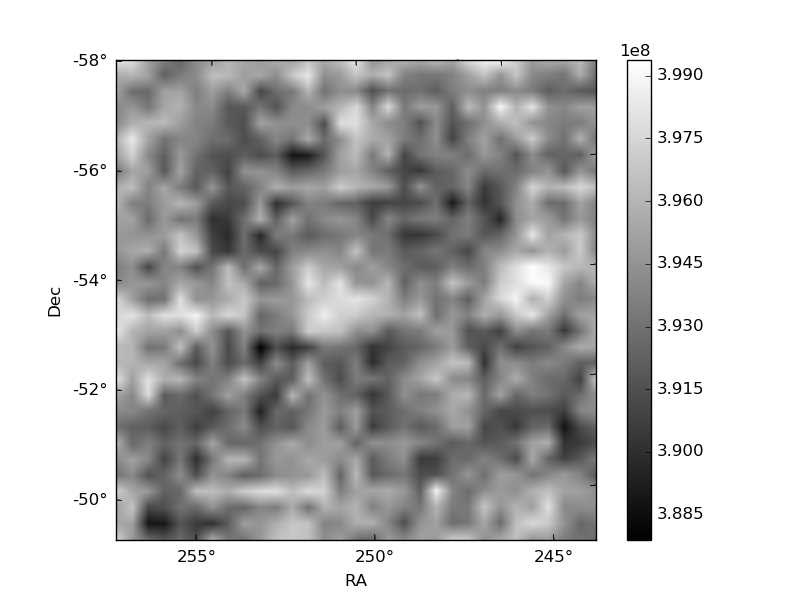
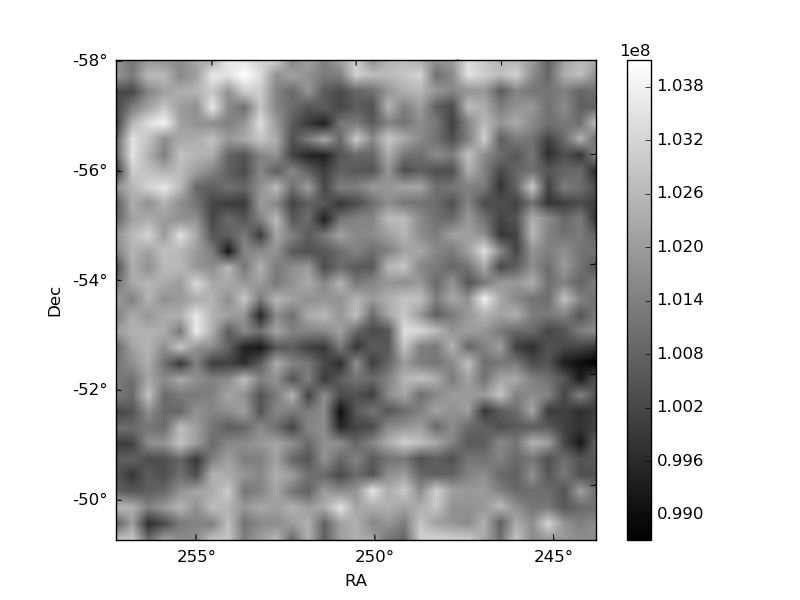
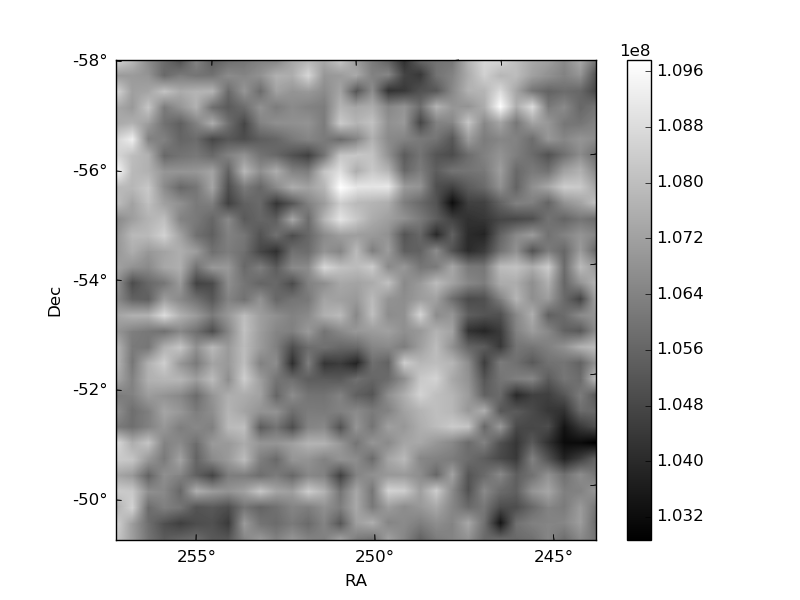
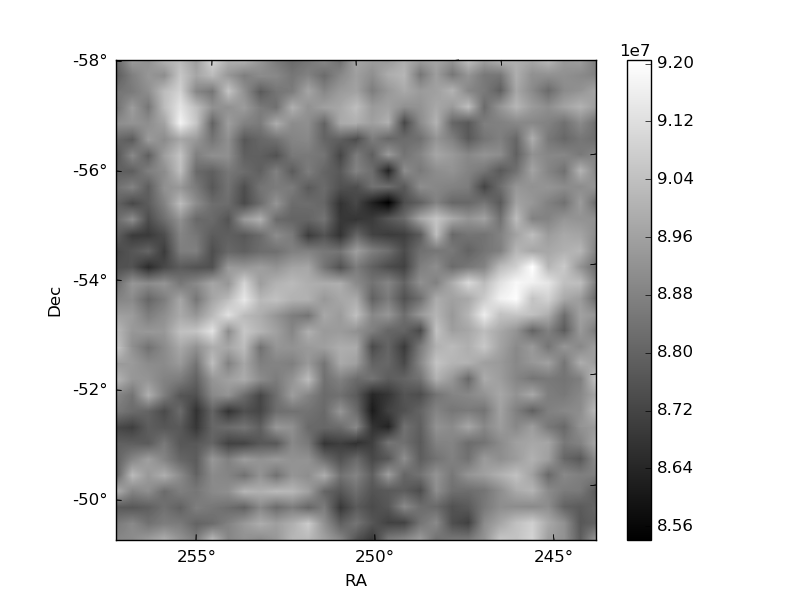
Histogram calculated using DETX and DETY for each event in the final _common_clean file
| Quadrant A | 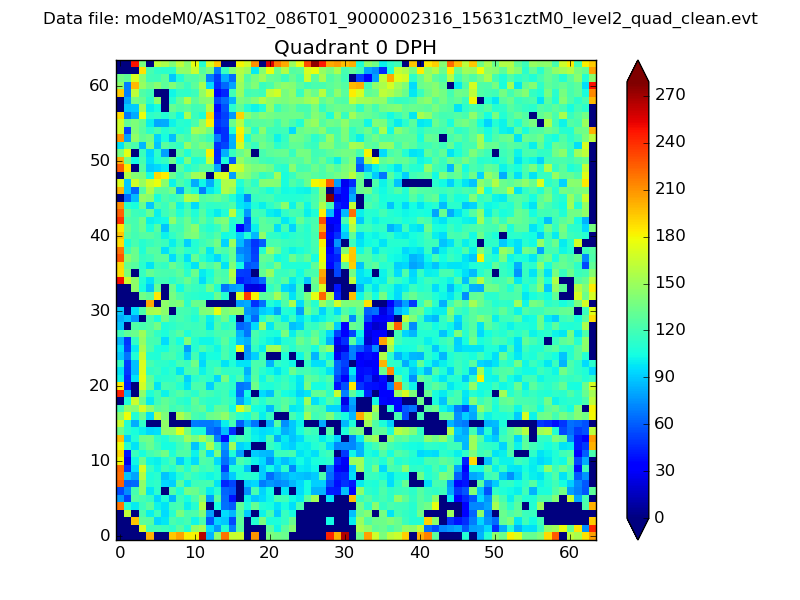 |
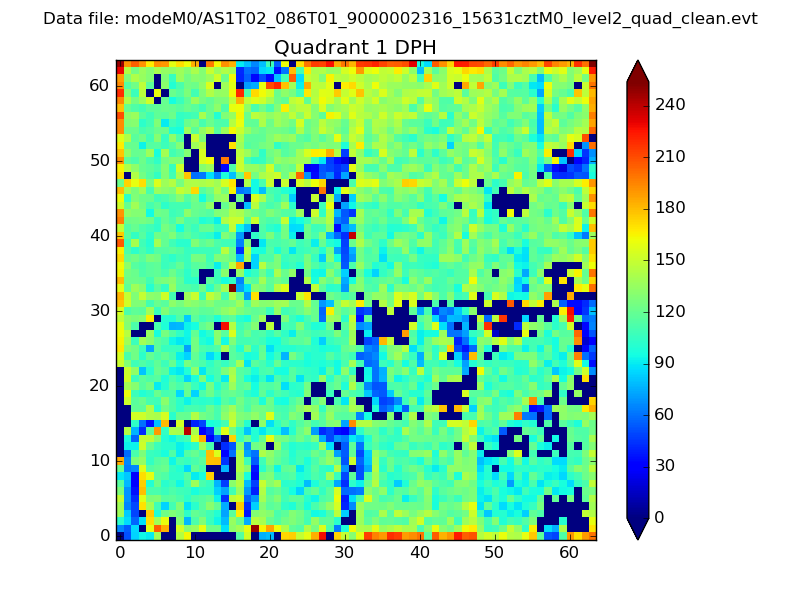 |
Quadrant B |
|---|---|---|---|
| Quadrant D | 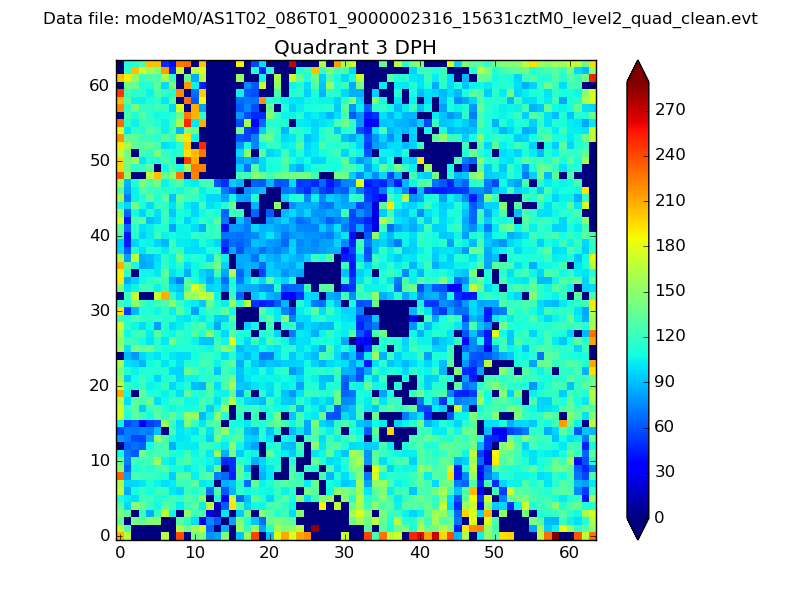 |
 |
Quadrant C |
| Plot type | Count rate plots | Images |
|---|---|---|
| Comparison with Poisson distribution Blue bars denote a histogram of data divided into 1 sec bins. Red curve is a Poisson curve with rate = median count rate of data. |
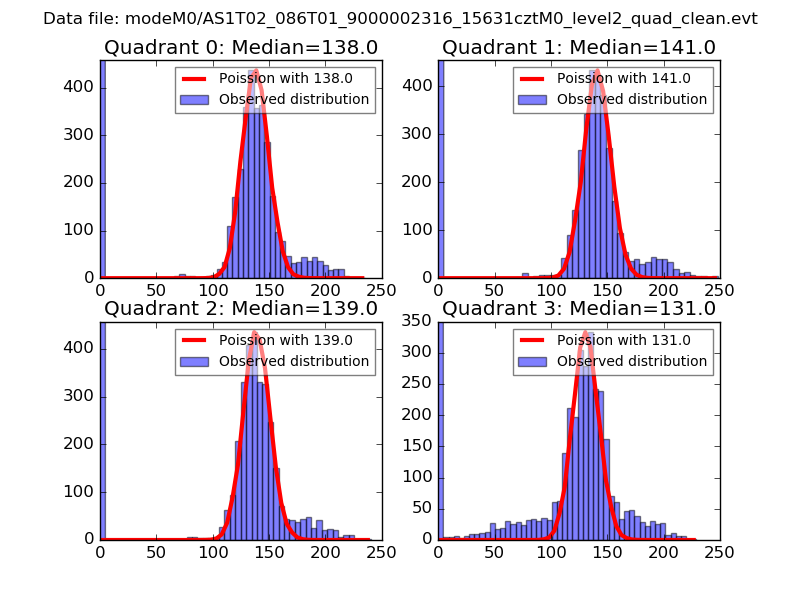 |
 |
| Quadrant-wise count rates Data is divided into 100 sec bins |
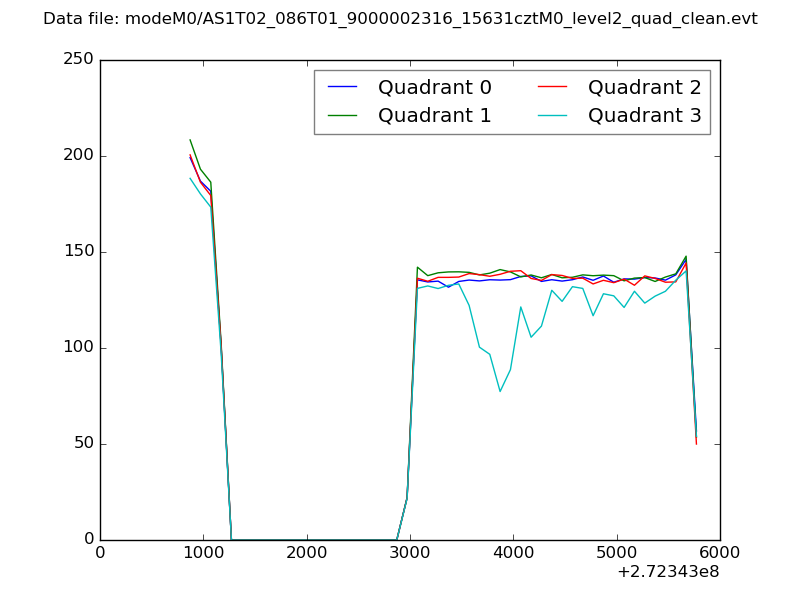 |
|
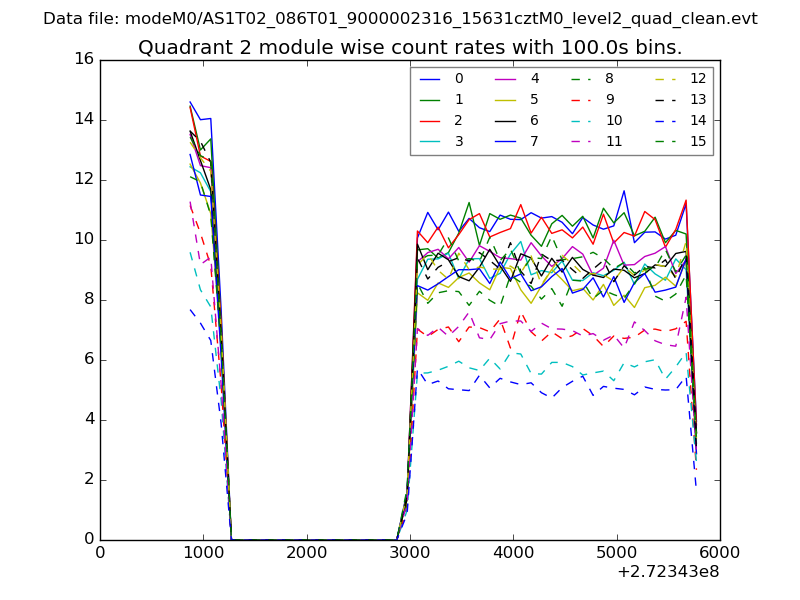
| Module-wise count rates for Quadrant A Data is divided into 100 sec bins |
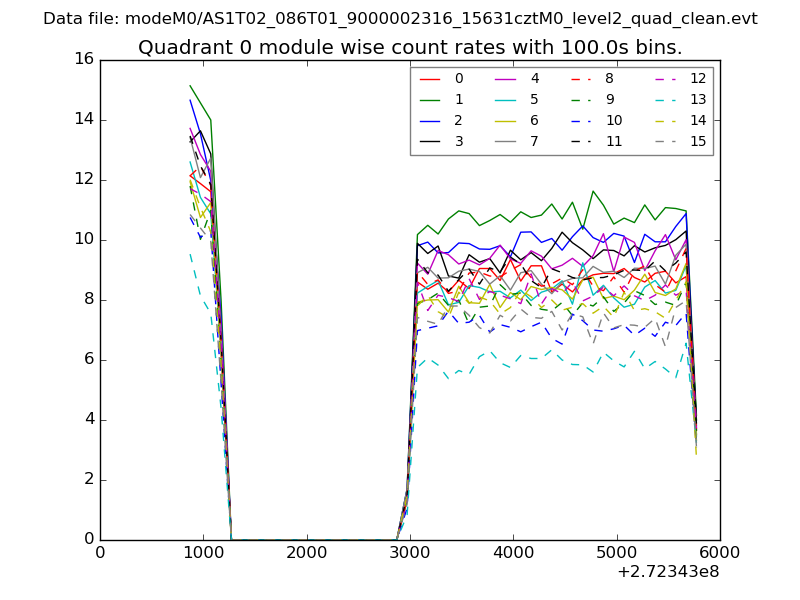 |
 |
| Module-wise count rates for Quadrant B Data is divided into 100 sec bins |
 |
 |
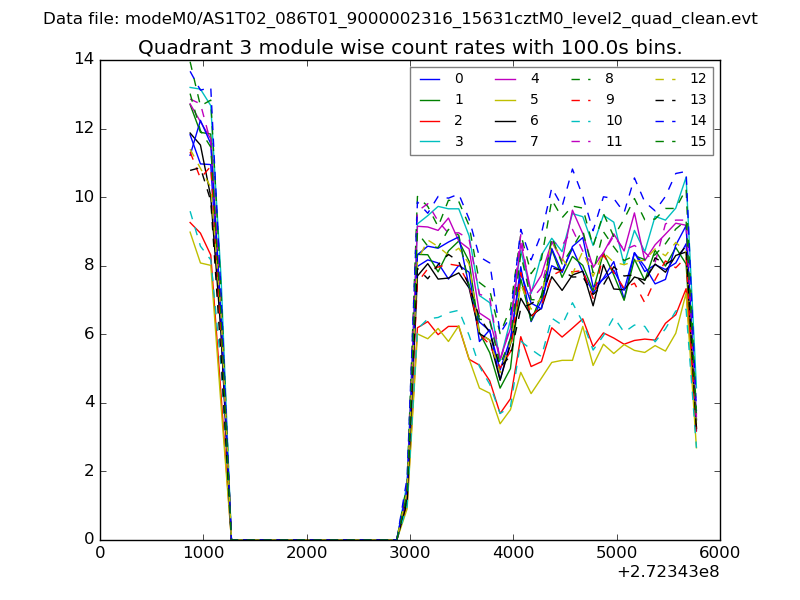
| Module-wise count rates for Quadrant C Data is divided into 100 sec bins |
 |
 |
| Module-wise count rates for Quadrant D Data is divided into 100 sec bins |
 |
 |
| Parameter | Plot |
|---|---|
| CZT HV Monitor |  |
| D_VDD | 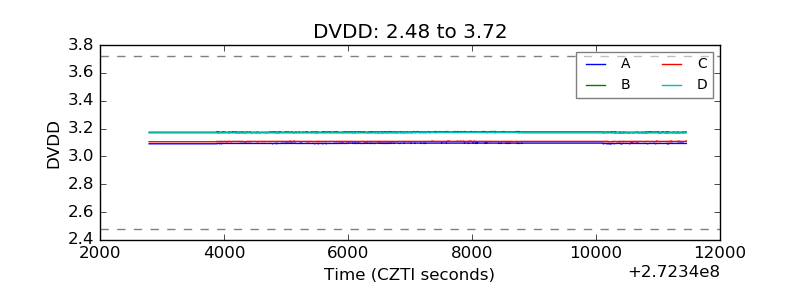 |
| Temperature 1 | 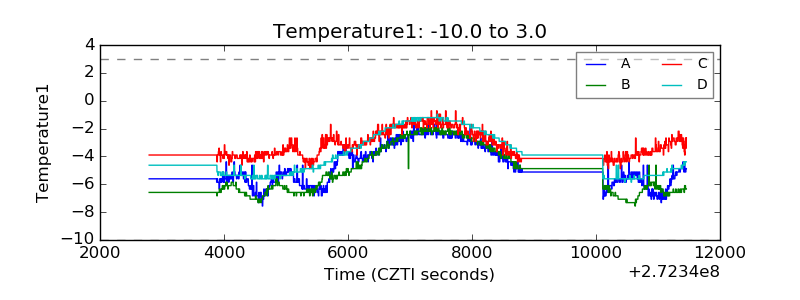 |
| Veto HV Monitor | 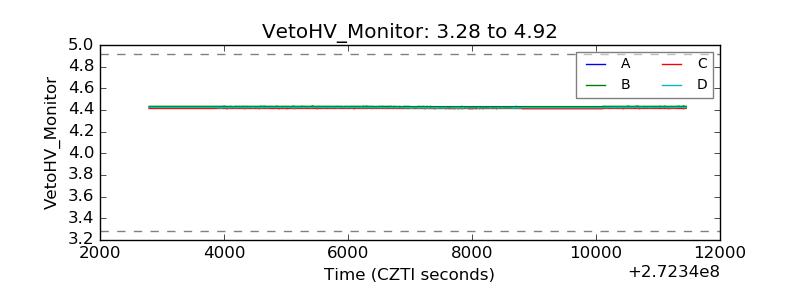 |
| Veto LLD | 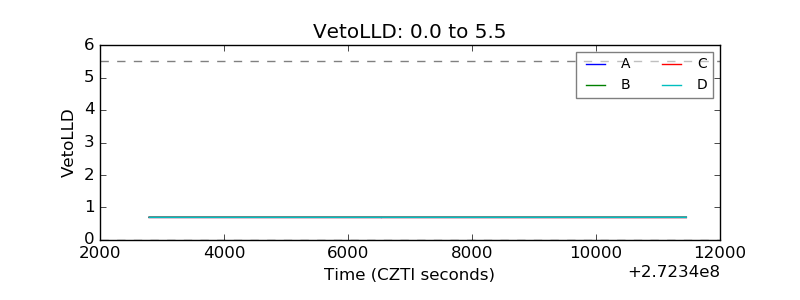 |
| Alpha Counter | 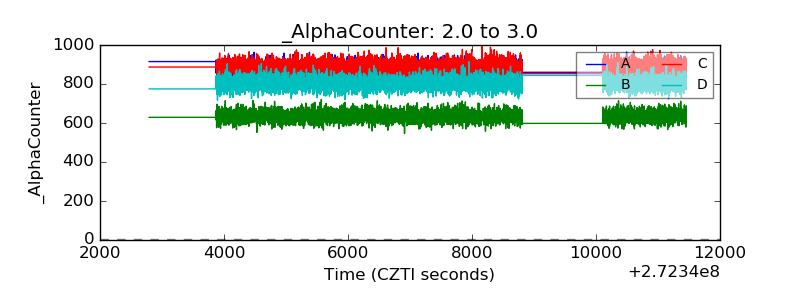 |
| _CPM_Rate | 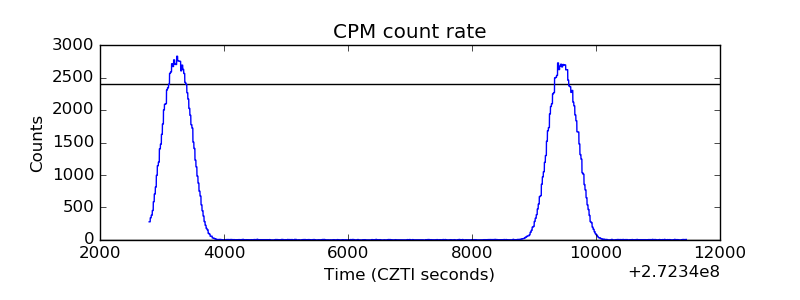 |
| CZT Counter | 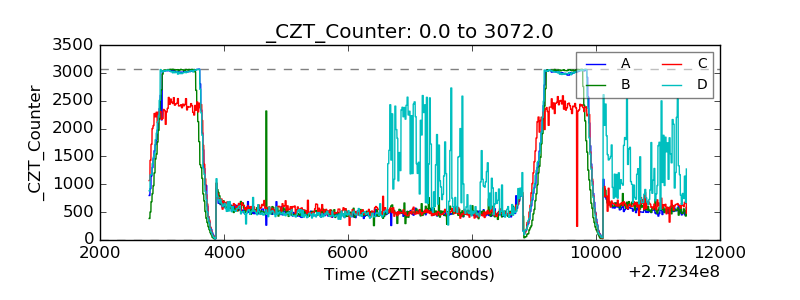 |
| +2.5 Volts monitor |  |
| +5 Volts monitor |  |
| _ROLL_ROT |  |
| _Roll_DEC | 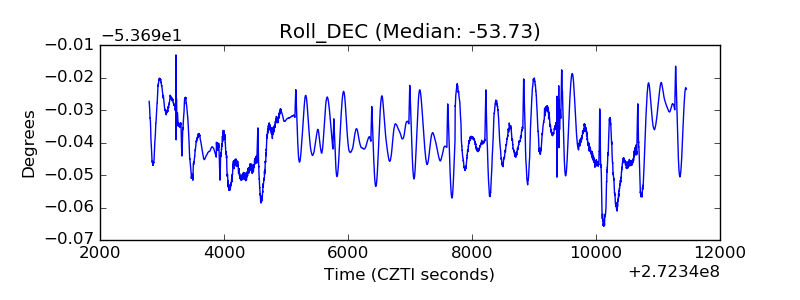 |
| _Roll_RA | 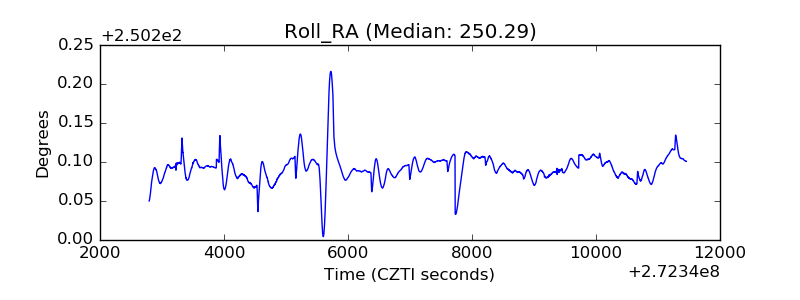 |
| Veto Counter | 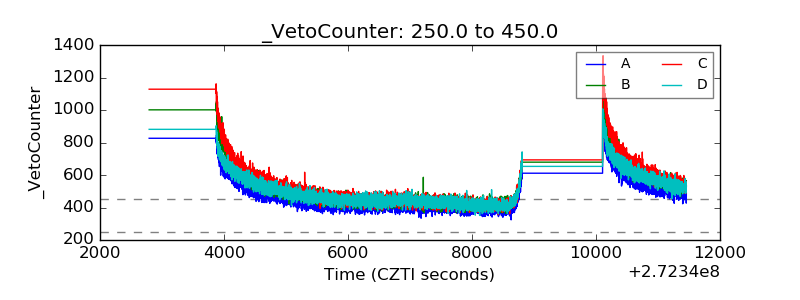 |