| Param | Original file | Final file |
|---|---|---|
| Filename | modeM0/AS1T02_086T01_9000002316_15632cztM0_level2.evt | modeM0/AS1T02_086T01_9000002316_15632cztM0_level2_quad_clean.evt |
| Size (bytes) | 549,178,560 | 71,576,640 |
| Size | 523.7 MB | 68.3 MB |
| Events in quadrant A | 3,246,559 | 438,901 |
| Events in quadrant B | 3,380,534 | 444,101 |
| Events in quadrant C | 3,636,489 | 438,651 |
| Events in quadrant D | 5,947,435 | 411,813 |
| Mode SS | |||
|---|---|---|---|
| Quadrant | BADHDUFLAG | Total packets | Discarded packets |
| A | 0 | 126 | 0 |
| B | 0 | 126 | 0 |
| C | 0 | 126 | 0 |
| D | 0 | 126 | 0 |
| Mode M9 | |||
|---|---|---|---|
| Quadrant | BADHDUFLAG | Total packets | Discarded packets |
| A | 0 | 18 | 0 |
| B | 0 | 18 | 0 |
| C | 0 | 18 | 0 |
| D | 0 | 19 | 0 |
| Mode M0 | |||
|---|---|---|---|
| Quadrant | BADHDUFLAG | Total packets | Discarded packets |
| A | 0 | 13242 | 3 |
| B | 0 | 13785 | 2 |
| C | 0 | 14873 | 2 |
| D | 0 | 22041 | 2 |
| Quadrant | Total seconds | Saturated seconds | Saturation percentage |
|---|---|---|---|
| A | 6214 | 88 | 1.416157% |
| B | 6214 | 104 | 1.673640% |
| C | 6214 | 150 | 2.413904% |
| D | 6214 | 579 | 9.317670% |
Noise dominated data is calculated using 1-second bins in cleaned event files. If a bin has >2000 counts, and if more than 50% of those come from <1% of pixels, then it is considered to be noise-dominated and hence unusable.
| Quadrant | # 1 sec bins | Bins with >0 counts | Bins with >2000 counts | High rate bins dominated by noise | Noise dominated (total time) | Noise dominated (detector-on time) | Marked lightcurve |
|---|---|---|---|---|---|---|---|
| A | 7550 | 6215 | 0 | 0 | 0.00% | 0.00% | 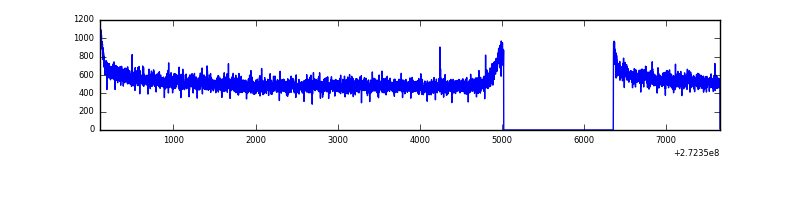 |
| B | 7550 | 6215 | 0 | 0 | 0.00% | 0.00% | 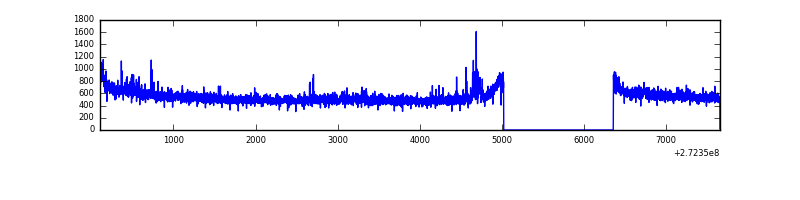 |
| C | 7550 | 6215 | 0 | 0 | 0.00% | 0.00% | 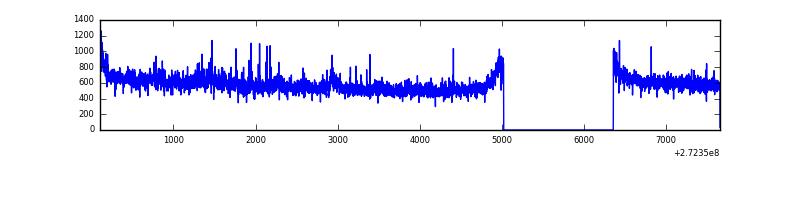 |
| D | 7550 | 6215 | 492 | 492 | 6.52% | 7.92% | 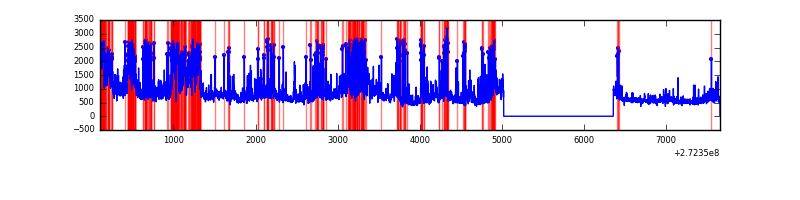 |
Top three noisy pixels from each quadrant. If the there are fewer than three noisy pixels in the level2.evt file, extra rows are filled as -1
| Pixel properties | Quadrant properties | ||||||
|---|---|---|---|---|---|---|---|
| Quadrant | DetID | PixID | Counts | Sigma | Mean | Median | Sigma |
| A | 0 | 226 | 7493 | 39.97 | 843 | 828 | 166.8 |
| A | 12 | 194 | 6362 | 33.18 | 843 | 828 | 166.8 |
| A | 3 | 137 | 5224 | 26.36 | 843 | 828 | 166.8 |
| B | 0 | 189 | 44878 | 286.03 | 841 | 823 | 154.0 |
| B | 4 | 251 | 26042 | 163.74 | 841 | 823 | 154.0 |
| B | 0 | 214 | 21902 | 136.86 | 841 | 823 | 154.0 |
| C | 3 | 233 | 302662 | 1626.92 | 820 | 828 | 185.5 |
| C | 14 | 238 | 129511 | 693.62 | 820 | 828 | 185.5 |
| C | 13 | 61 | 5807 | 26.84 | 820 | 828 | 185.5 |
| D | 1 | 52 | 2263194 | 11793.76 | 805 | 785 | 191.8 |
| D | 12 | 110 | 535528 | 2787.57 | 805 | 785 | 191.8 |
| D | 10 | 70 | 44758 | 229.23 | 805 | 785 | 191.8 |
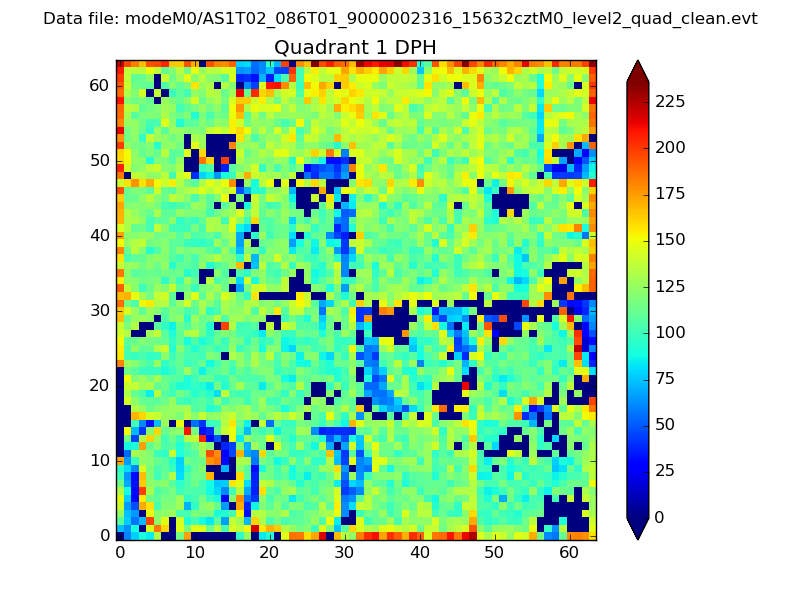
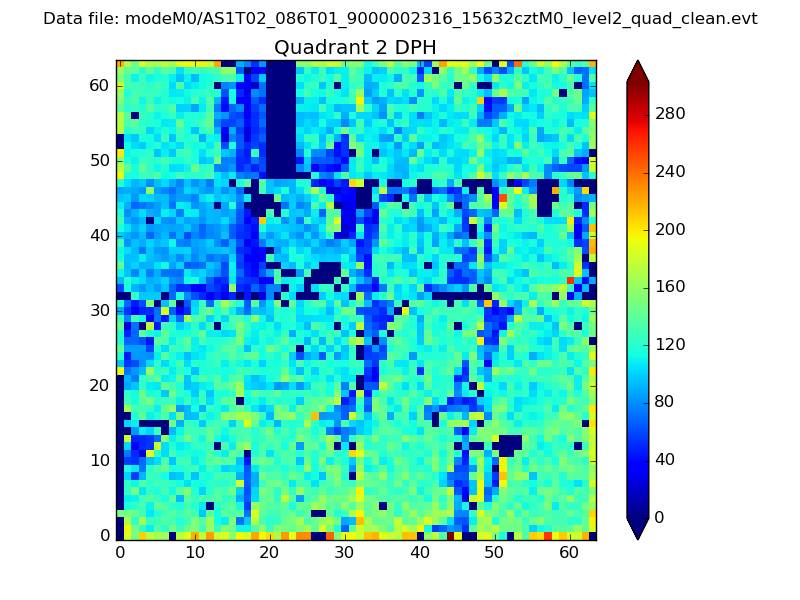
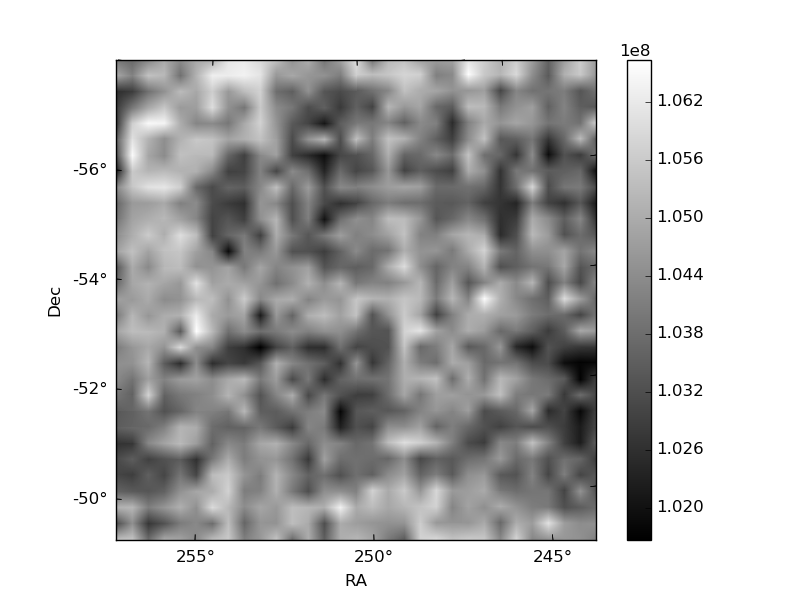
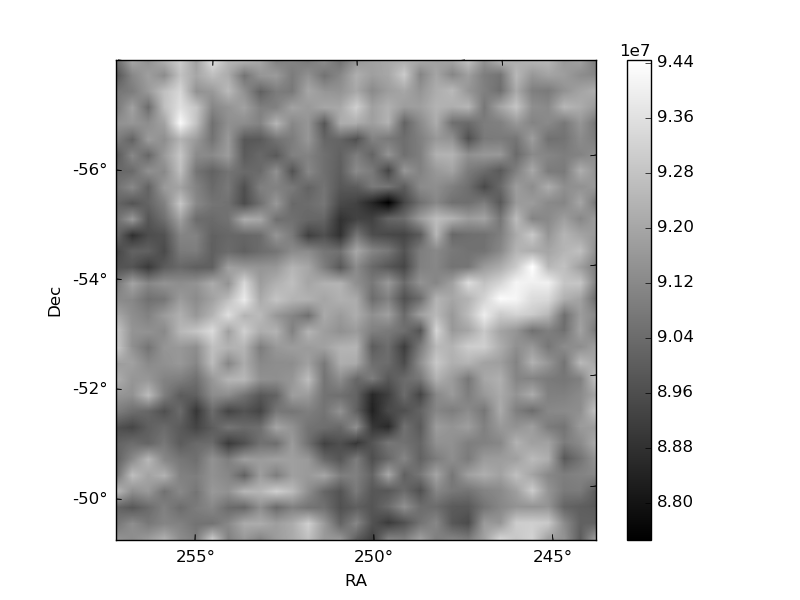
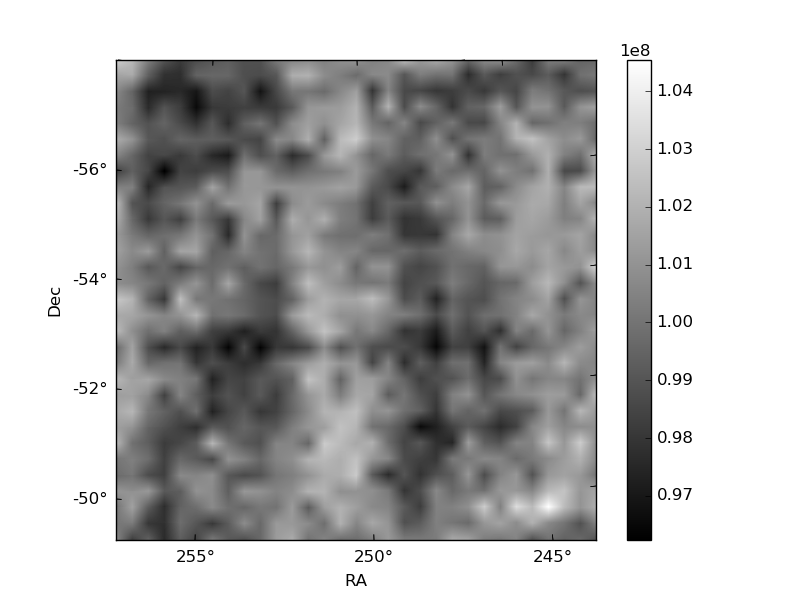
Histogram calculated using DETX and DETY for each event in the final _common_clean file
| Quadrant A |  |
 |
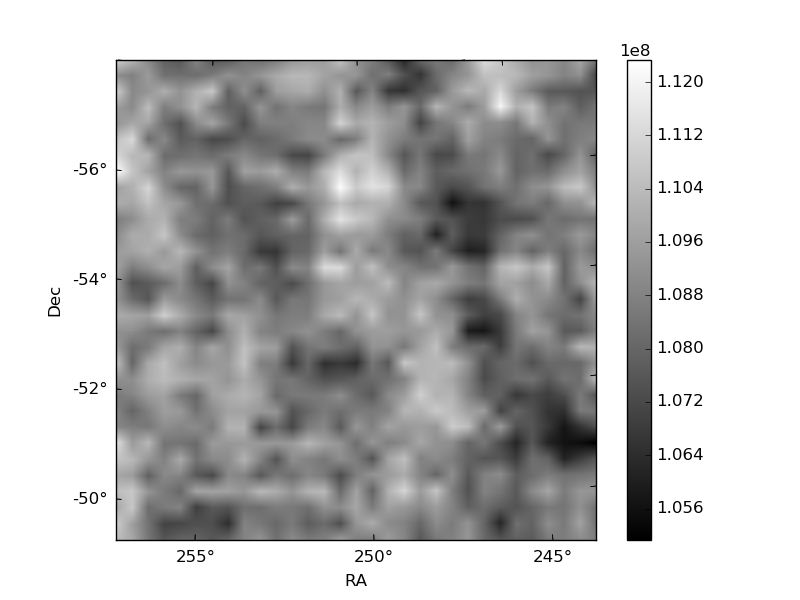
Quadrant B |
|---|---|---|---|
| Quadrant D |  |
 |
Quadrant C |
| Plot type | Count rate plots | Images |
|---|---|---|
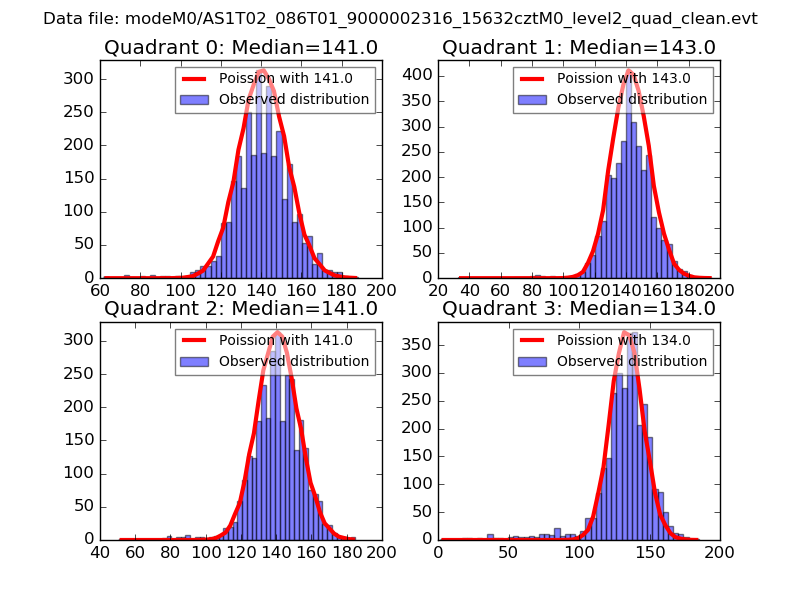
| Comparison with Poisson distribution Blue bars denote a histogram of data divided into 1 sec bins. Red curve is a Poisson curve with rate = median count rate of data. |
 |
 |
| Quadrant-wise count rates Data is divided into 100 sec bins |
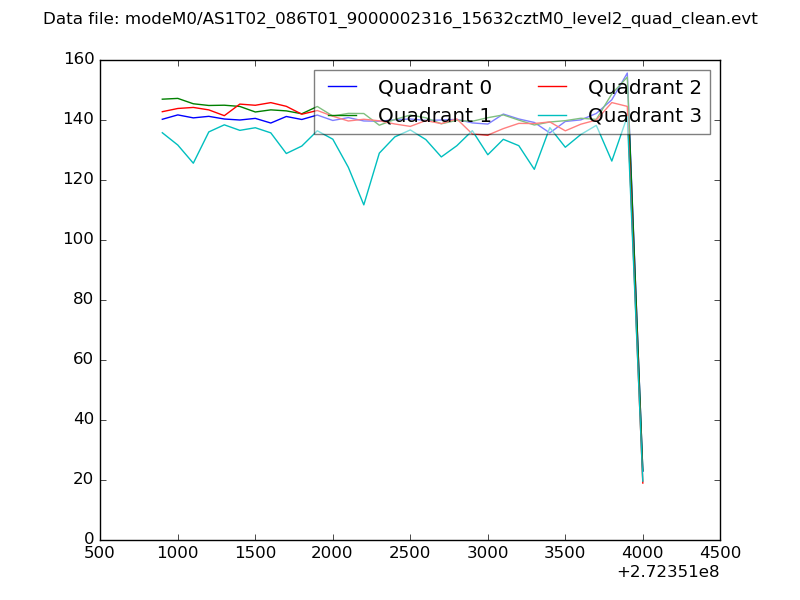 |
|
| Module-wise count rates for Quadrant A Data is divided into 100 sec bins |
 |
 |
| Module-wise count rates for Quadrant B Data is divided into 100 sec bins |
 |
 |
| Module-wise count rates for Quadrant C Data is divided into 100 sec bins |
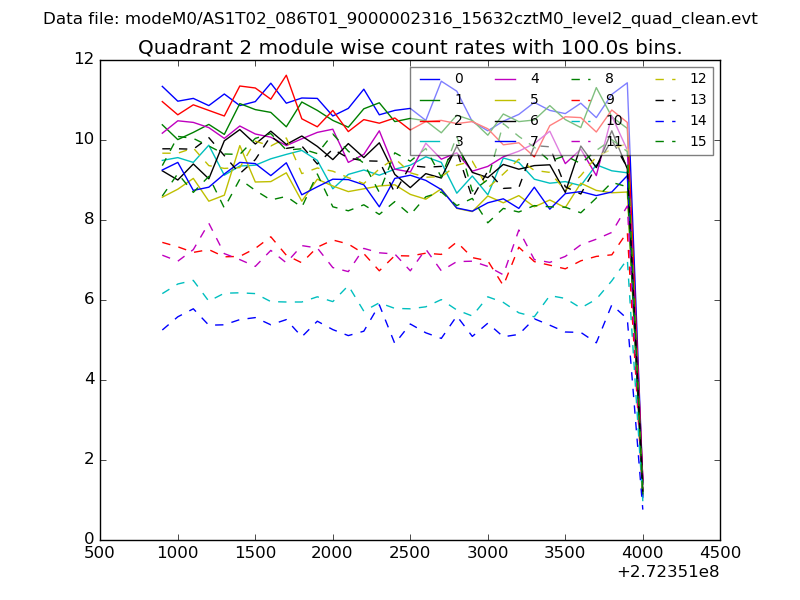 |
 |
| Module-wise count rates for Quadrant D Data is divided into 100 sec bins |
 |
 |
| Parameter | Plot |
|---|---|
| CZT HV Monitor | 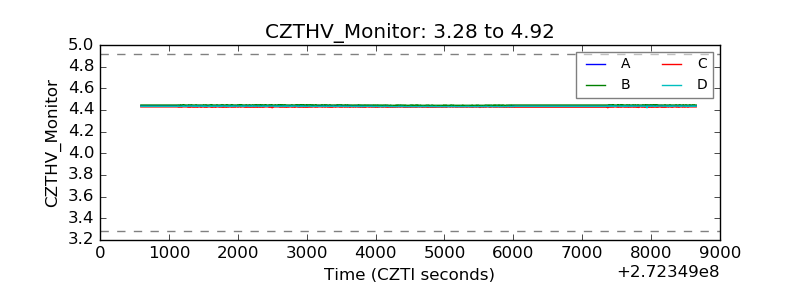 |
| D_VDD | 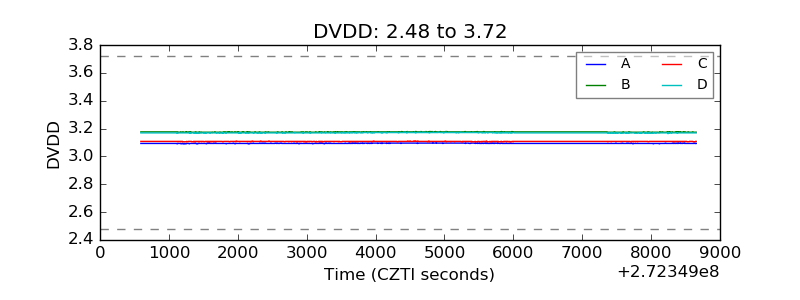 |
| Temperature 1 | 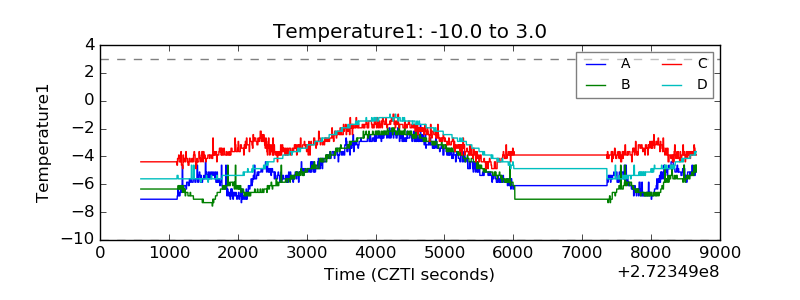 |
| Veto HV Monitor | 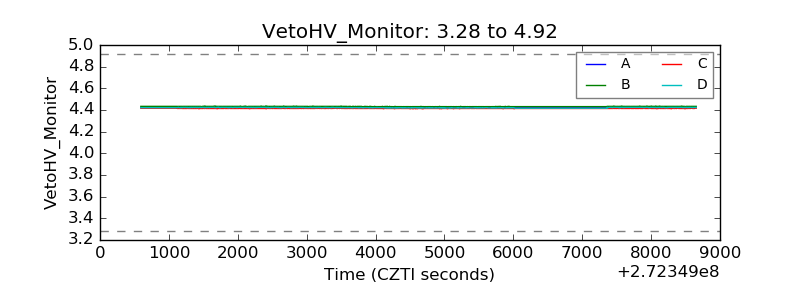 |
| Veto LLD | 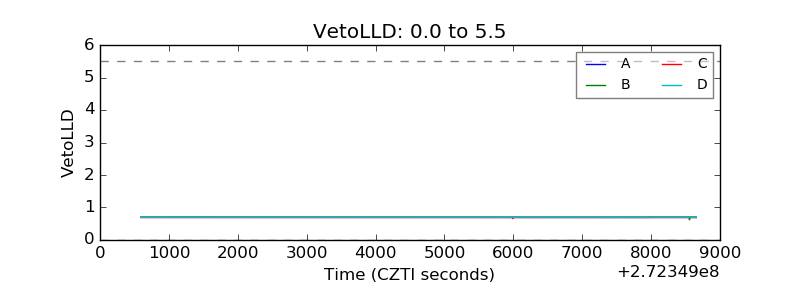 |
| Alpha Counter | 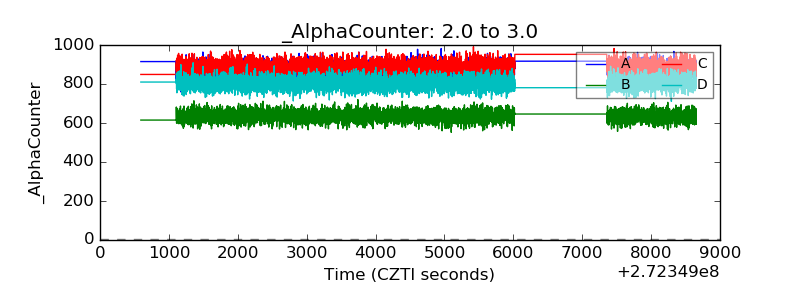 |
| _CPM_Rate | 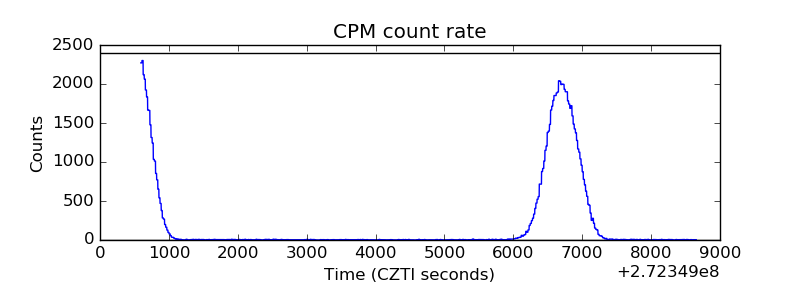 |
| CZT Counter | 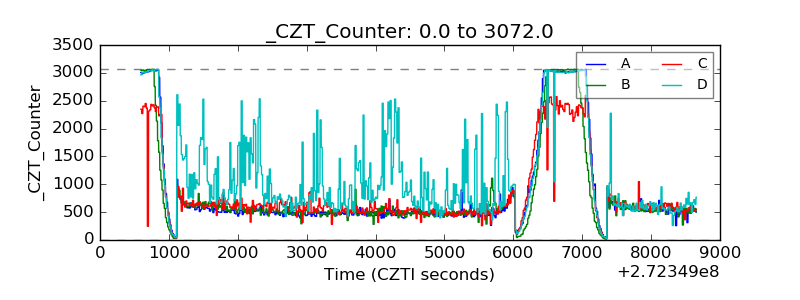 |
| +2.5 Volts monitor |  |
| +5 Volts monitor | 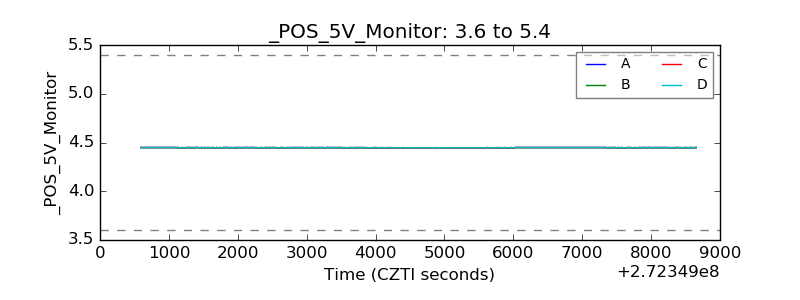 |
| _ROLL_ROT | 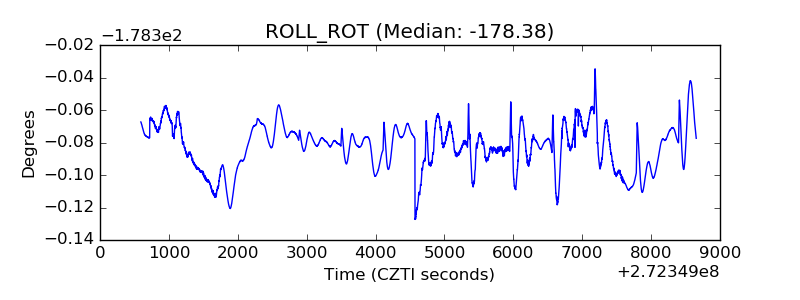 |
| _Roll_DEC | 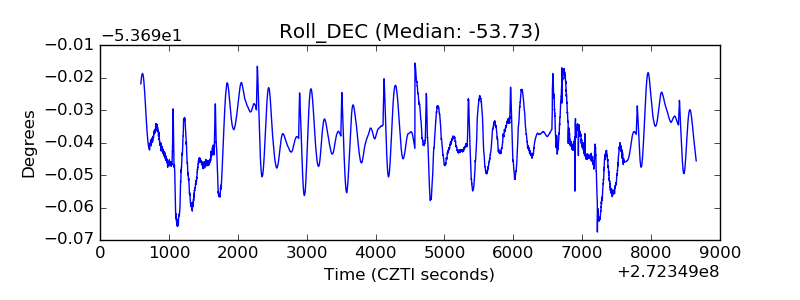 |
| _Roll_RA | 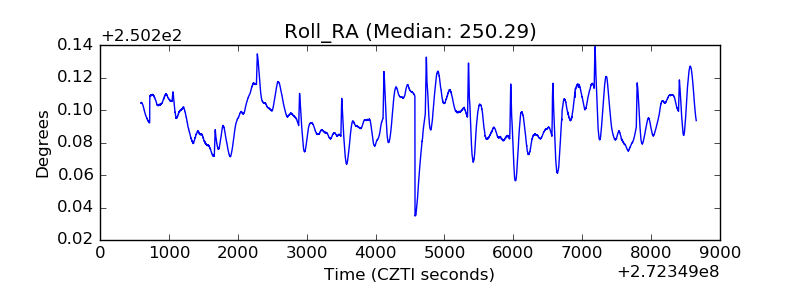 |
| Veto Counter | 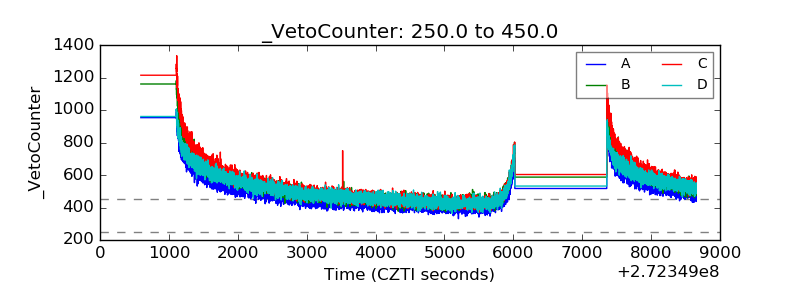 |