| Param | Original file | Final file |
|---|---|---|
| Filename | modeM0/AS1T02_086T01_9000002316_15633cztM0_level2.evt | modeM0/AS1T02_086T01_9000002316_15633cztM0_level2_quad_clean.evt |
| Size (bytes) | 482,094,720 | 85,711,680 |
| Size | 459.8 MB | 81.7 MB |
| Events in quadrant A | 3,205,623 | 544,907 |
| Events in quadrant B | 3,318,057 | 551,576 |
| Events in quadrant C | 3,493,553 | 542,046 |
| Events in quadrant D | 4,161,188 | 523,282 |
| Mode SS | |||
|---|---|---|---|
| Quadrant | BADHDUFLAG | Total packets | Discarded packets |
| A | 0 | 126 | 0 |
| B | 0 | 126 | 0 |
| C | 0 | 126 | 0 |
| D | 0 | 126 | 0 |
| Mode M9 | |||
|---|---|---|---|
| Quadrant | BADHDUFLAG | Total packets | Discarded packets |
| A | 0 | 13 | 0 |
| B | 0 | 13 | 0 |
| C | 0 | 13 | 0 |
| D | 0 | 14 | 0 |
| Mode M0 | |||
|---|---|---|---|
| Quadrant | BADHDUFLAG | Total packets | Discarded packets |
| A | 0 | 13131 | 3 |
| B | 0 | 13492 | 2 |
| C | 0 | 14293 | 2 |
| D | 0 | 16291 | 2 |
| Quadrant | Total seconds | Saturated seconds | Saturation percentage |
|---|---|---|---|
| A | 6215 | 97 | 1.560740% |
| B | 6215 | 110 | 1.769912% |
| C | 6215 | 171 | 2.751408% |
| D | 6215 | 230 | 3.700724% |
Noise dominated data is calculated using 1-second bins in cleaned event files. If a bin has >2000 counts, and if more than 50% of those come from <1% of pixels, then it is considered to be noise-dominated and hence unusable.
| Quadrant | # 1 sec bins | Bins with >0 counts | Bins with >2000 counts | High rate bins dominated by noise | Noise dominated (total time) | Noise dominated (detector-on time) | Marked lightcurve |
|---|---|---|---|---|---|---|---|
| A | 7531 | 6216 | 0 | 0 | 0.00% | 0.00% | 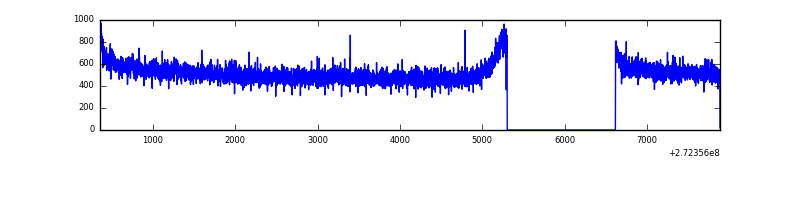 |
| B | 7531 | 6216 | 0 | 0 | 0.00% | 0.00% | 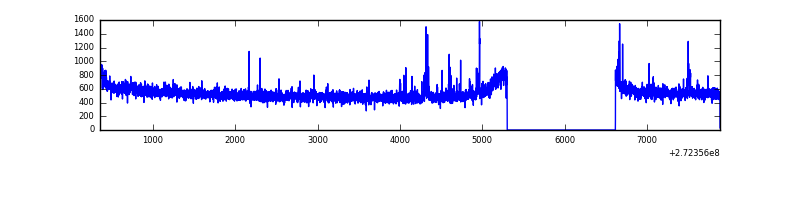 |
| C | 7531 | 6216 | 0 | 0 | 0.00% | 0.00% | 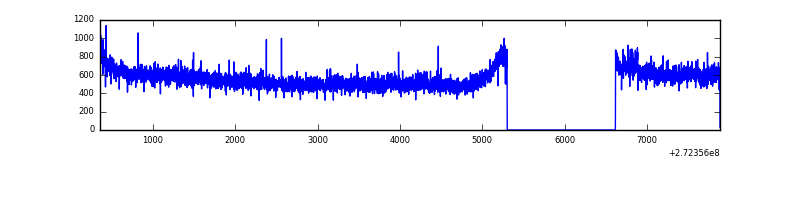 |
| D | 7531 | 6216 | 137 | 137 | 1.82% | 2.20% | 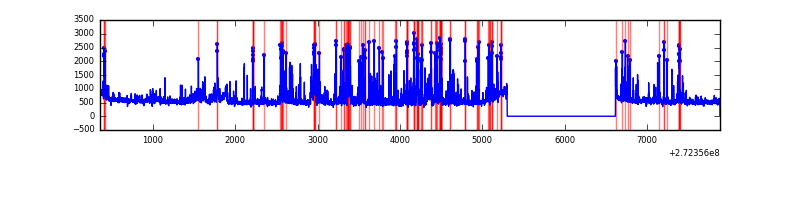 |
Top three noisy pixels from each quadrant. If the there are fewer than three noisy pixels in the level2.evt file, extra rows are filled as -1
| Pixel properties | Quadrant properties | ||||||
|---|---|---|---|---|---|---|---|
| Quadrant | DetID | PixID | Counts | Sigma | Mean | Median | Sigma |
| A | 3 | 80 | 12515 | 70.91 | 830 | 816 | 165.0 |
| A | 0 | 226 | 7518 | 40.62 | 830 | 816 | 165.0 |
| A | 12 | 194 | 6372 | 33.67 | 830 | 816 | 165.0 |
| B | 0 | 214 | 34315 | 219.29 | 825 | 806 | 152.8 |
| B | 0 | 189 | 23100 | 145.89 | 825 | 806 | 152.8 |
| B | 12 | 111 | 17006 | 106.01 | 825 | 806 | 152.8 |
| C | 3 | 233 | 227898 | 1240.53 | 802 | 808 | 183.1 |
| C | 14 | 238 | 126517 | 686.71 | 802 | 808 | 183.1 |
| C | 0 | 207 | 10981 | 55.57 | 802 | 808 | 183.1 |
| D | 1 | 52 | 875009 | 4532.95 | 809 | 789 | 192.9 |
| D | 12 | 110 | 76387 | 391.99 | 809 | 789 | 192.9 |
| D | 10 | 70 | 50558 | 258.06 | 809 | 789 | 192.9 |
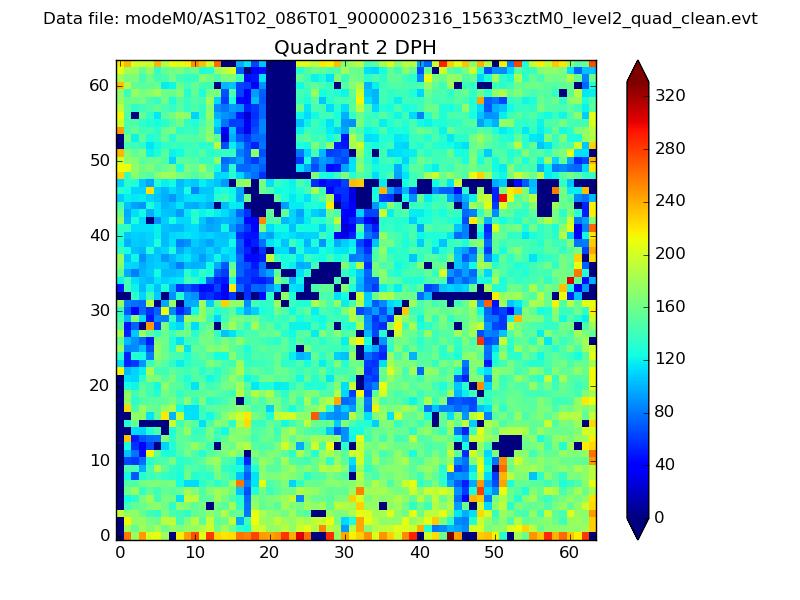
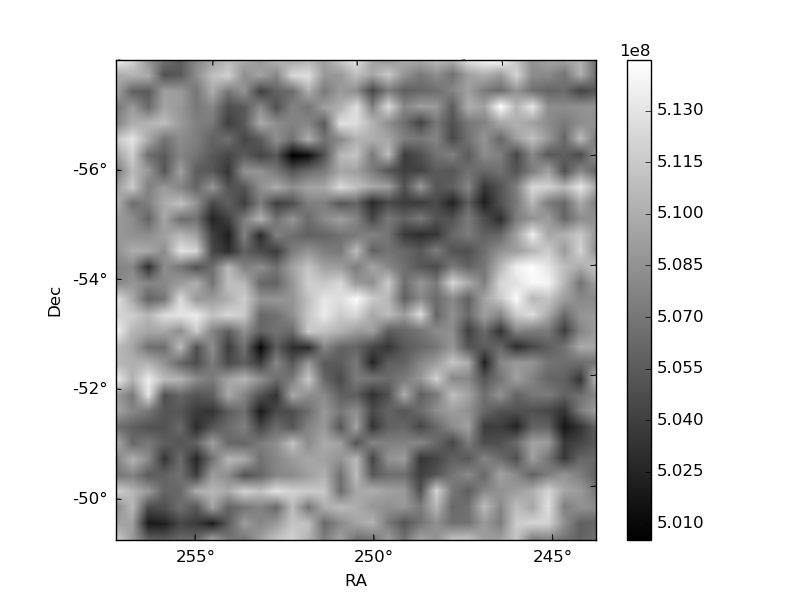
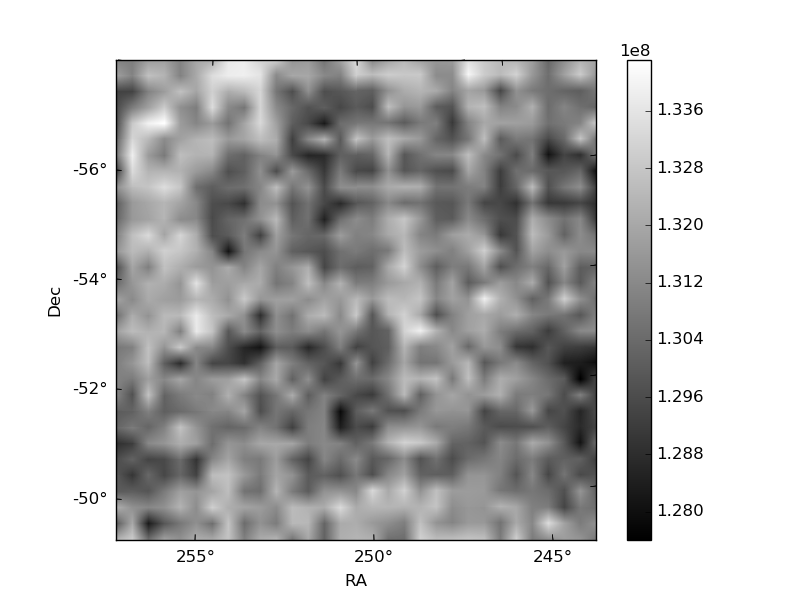
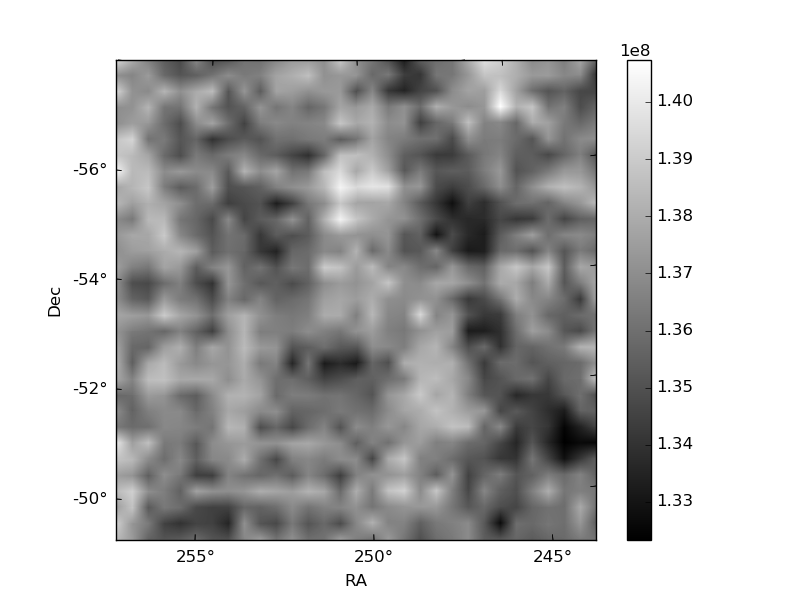
Histogram calculated using DETX and DETY for each event in the final _common_clean file
| Quadrant A | 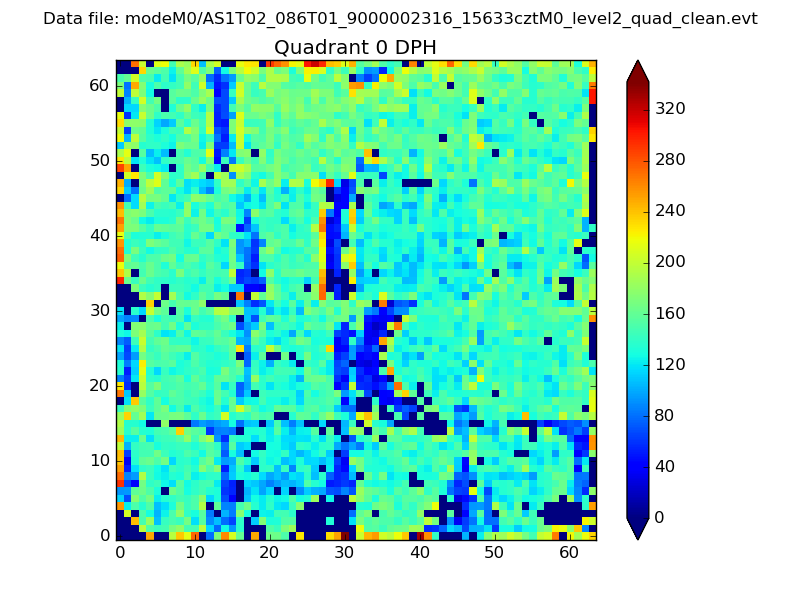 |
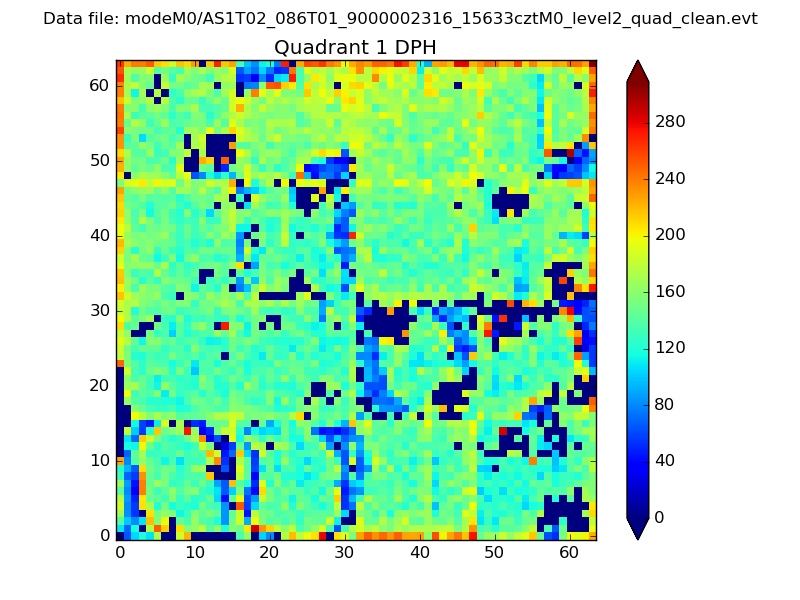 |
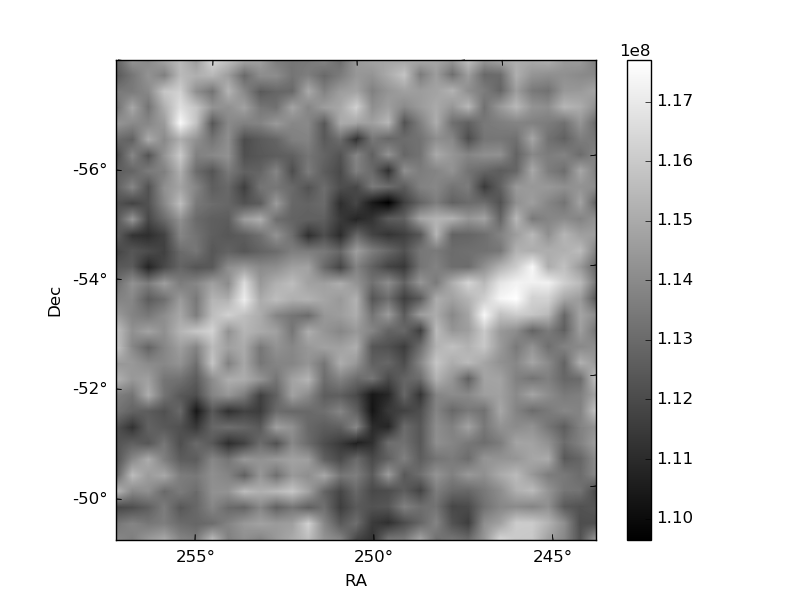
Quadrant B |
|---|---|---|---|
| Quadrant D | 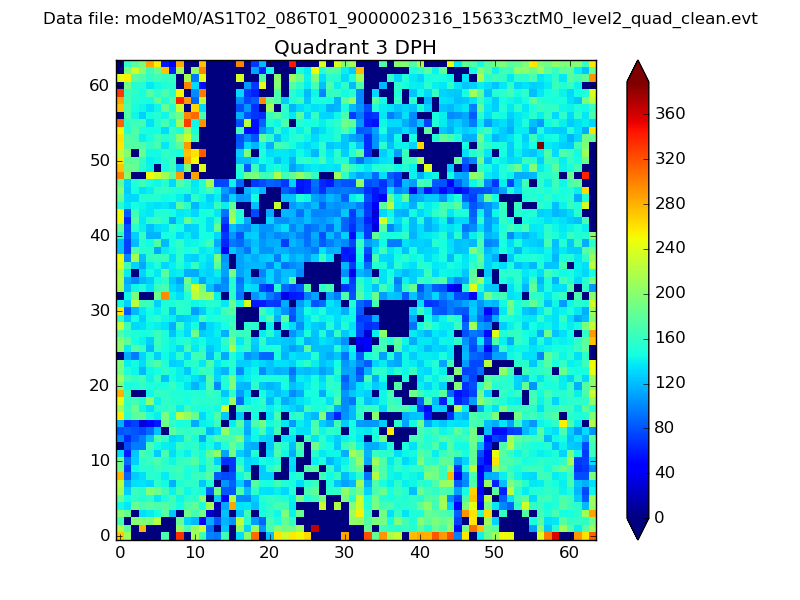 |
 |
Quadrant C |
| Plot type | Count rate plots | Images |
|---|---|---|
| Comparison with Poisson distribution Blue bars denote a histogram of data divided into 1 sec bins. Red curve is a Poisson curve with rate = median count rate of data. |
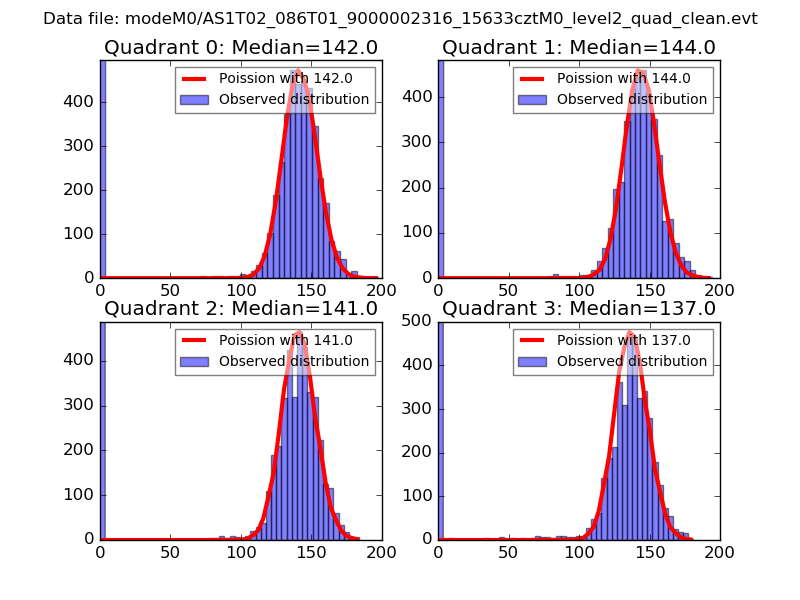 |
 |
| Quadrant-wise count rates Data is divided into 100 sec bins |
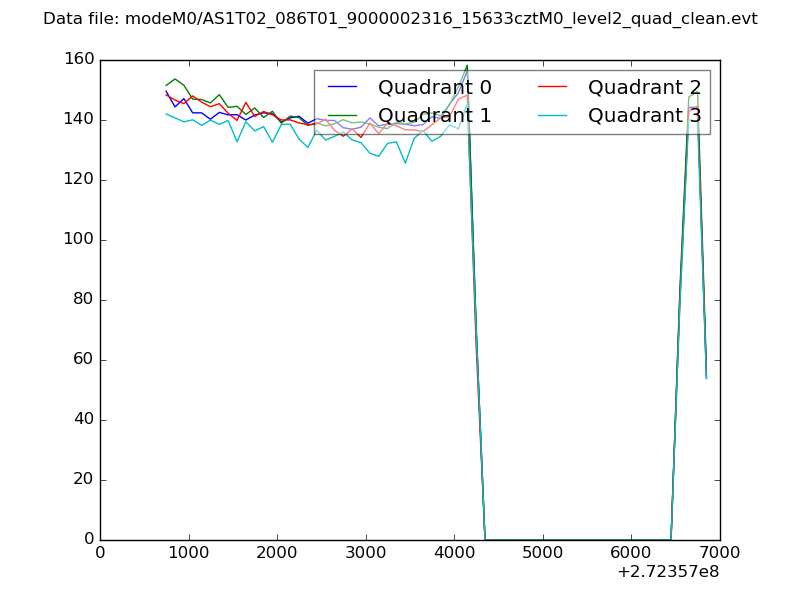 |
|
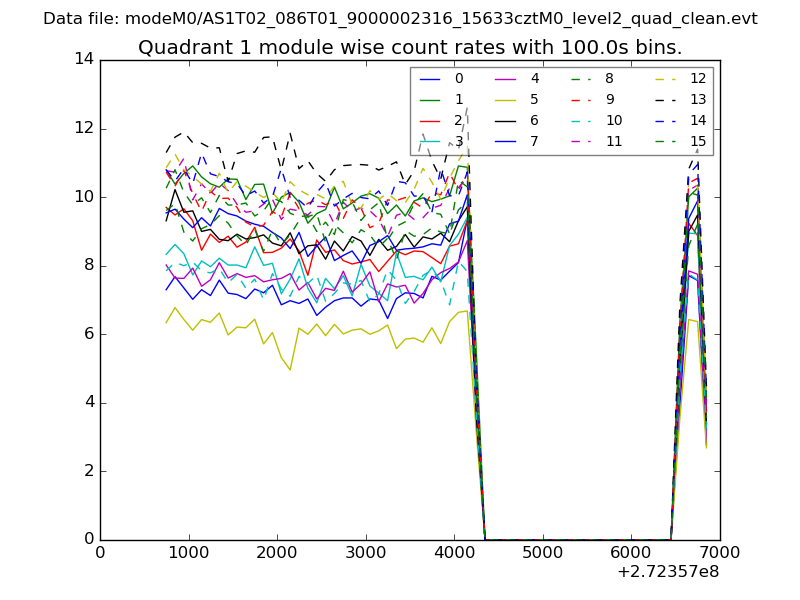
| Module-wise count rates for Quadrant A Data is divided into 100 sec bins |
 |
 |
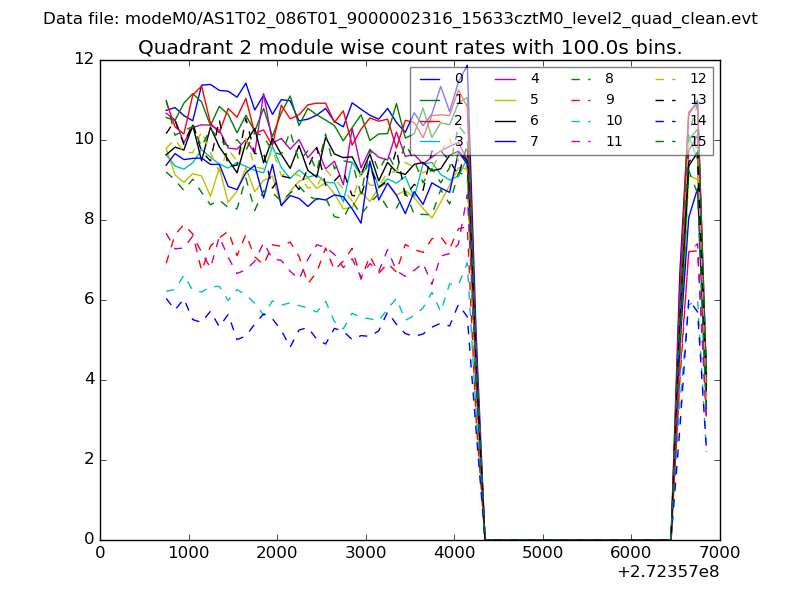
| Module-wise count rates for Quadrant B Data is divided into 100 sec bins |
 |
 |
| Module-wise count rates for Quadrant C Data is divided into 100 sec bins |
 |
 |
| Module-wise count rates for Quadrant D Data is divided into 100 sec bins |
 |
 |
| Parameter | Plot |
|---|---|
| CZT HV Monitor |  |
| D_VDD | 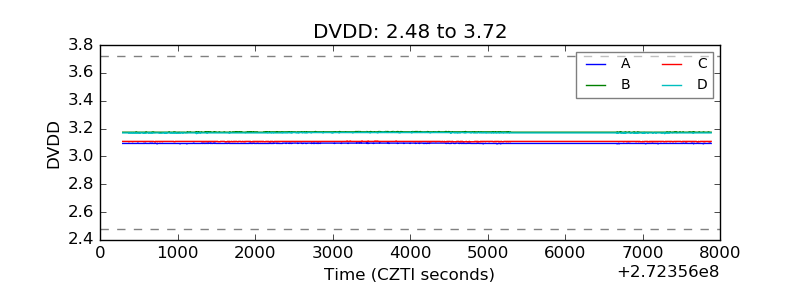 |
| Temperature 1 | 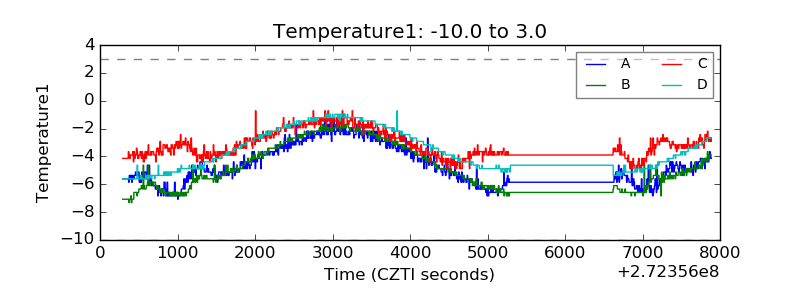 |
| Veto HV Monitor | 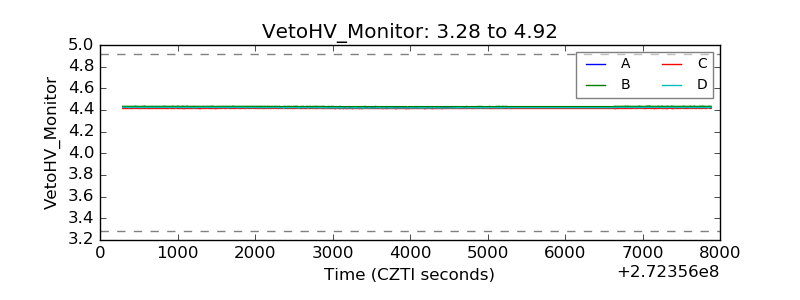 |
| Veto LLD | 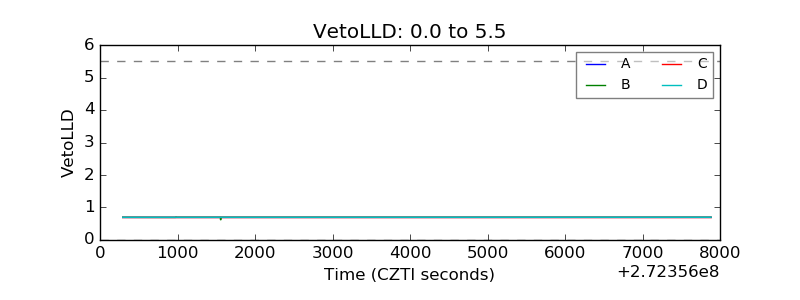 |
| Alpha Counter | 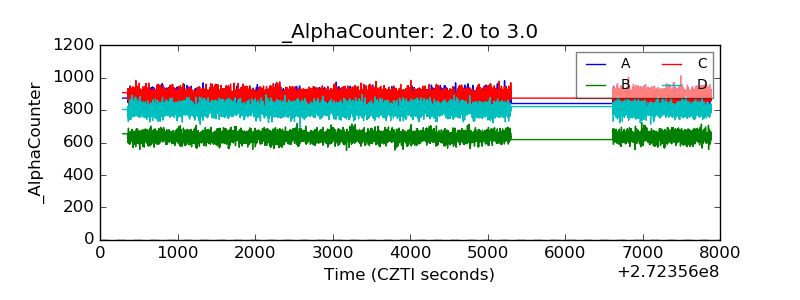 |
| _CPM_Rate | 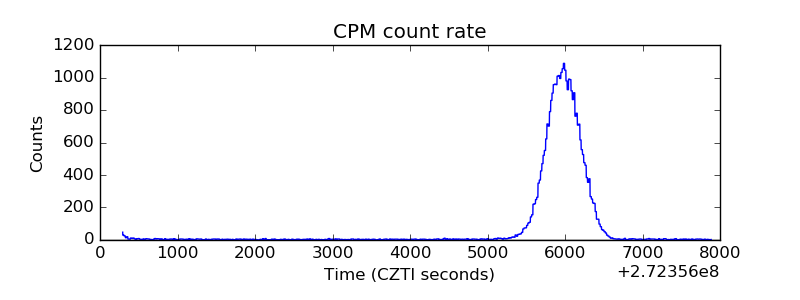 |
| CZT Counter | 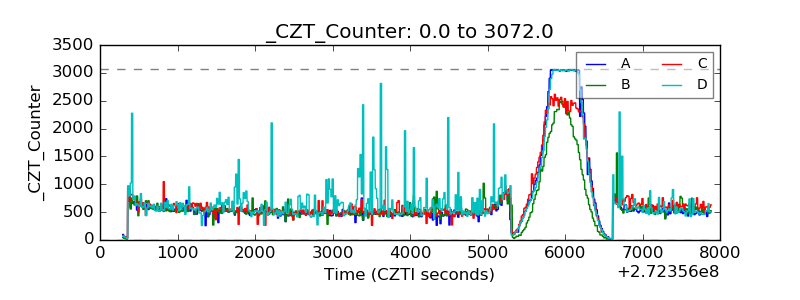 |
| +2.5 Volts monitor |  |
| +5 Volts monitor |  |
| _ROLL_ROT |  |
| _Roll_DEC |  |
| _Roll_RA | 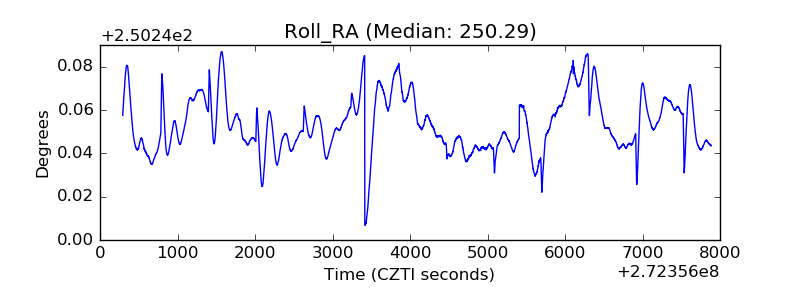 |
| Veto Counter |  |