| Param | Original file | Final file |
|---|---|---|
| Filename | modeM0/AS1T02_086T01_9000002316_15635cztM0_level2.evt | modeM0/AS1T02_086T01_9000002316_15635cztM0_level2_quad_clean.evt |
| Size (bytes) | 548,714,880 | 102,513,600 |
| Size | 523.3 MB | 97.8 MB |
| Events in quadrant A | 3,290,053 | 669,527 |
| Events in quadrant B | 3,396,206 | 676,377 |
| Events in quadrant C | 4,137,872 | 662,616 |
| Events in quadrant D | 5,326,601 | 616,248 |
| Mode SS | |||
|---|---|---|---|
| Quadrant | BADHDUFLAG | Total packets | Discarded packets |
| A | 0 | 142 | 0 |
| B | 0 | 142 | 0 |
| C | 0 | 142 | 0 |
| D | 0 | 142 | 0 |
| Mode M9 | |||
|---|---|---|---|
| Quadrant | BADHDUFLAG | Total packets | Discarded packets |
| A | 0 | 18 | 0 |
| B | 0 | 18 | 0 |
| C | 0 | 18 | 0 |
| D | 0 | 18 | 0 |
| Mode M0 | |||
|---|---|---|---|
| Quadrant | BADHDUFLAG | Total packets | Discarded packets |
| A | 0 | 14184 | 3 |
| B | 0 | 14325 | 2 |
| C | 0 | 16924 | 2 |
| D | 0 | 20330 | 2 |
| Quadrant | Total seconds | Saturated seconds | Saturation percentage |
|---|---|---|---|
| A | 6883 | 133 | 1.932297% |
| B | 6883 | 130 | 1.888711% |
| C | 6883 | 217 | 3.152695% |
| D | 6883 | 668 | 9.705070% |
Noise dominated data is calculated using 1-second bins in cleaned event files. If a bin has >2000 counts, and if more than 50% of those come from <1% of pixels, then it is considered to be noise-dominated and hence unusable.
| Quadrant | # 1 sec bins | Bins with >0 counts | Bins with >2000 counts | High rate bins dominated by noise | Noise dominated (total time) | Noise dominated (detector-on time) | Marked lightcurve |
|---|---|---|---|---|---|---|---|
| A | 8714 | 6884 | 0 | 0 | 0.00% | 0.00% | 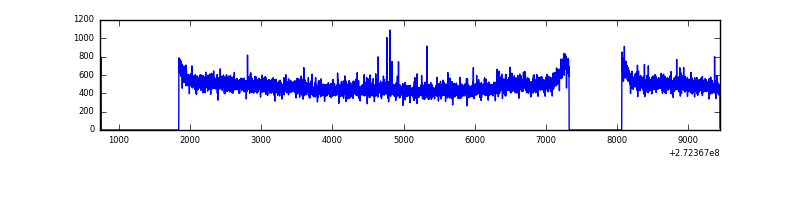 |
| B | 8714 | 6884 | 0 | 0 | 0.00% | 0.00% | 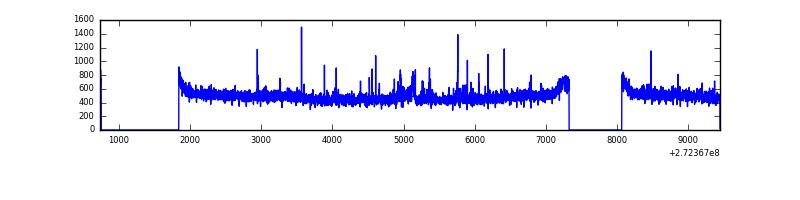 |
| C | 8714 | 6884 | 0 | 0 | 0.00% | 0.00% | 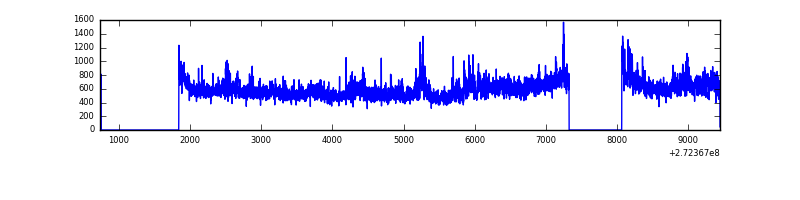 |
| D | 8714 | 6884 | 604 | 604 | 6.93% | 8.77% | 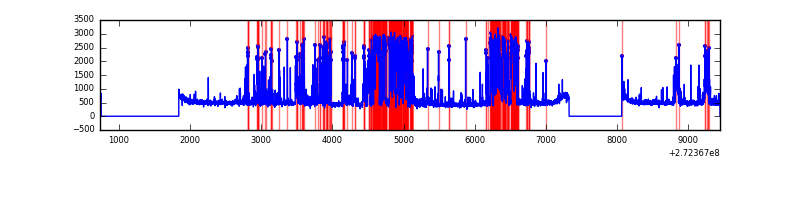 |
Top three noisy pixels from each quadrant. If the there are fewer than three noisy pixels in the level2.evt file, extra rows are filled as -1
| Pixel properties | Quadrant properties | ||||||
|---|---|---|---|---|---|---|---|
| Quadrant | DetID | PixID | Counts | Sigma | Mean | Median | Sigma |
| A | 3 | 80 | 16706 | 93.77 | 847 | 827 | 169.3 |
| A | 15 | 69 | 10970 | 59.89 | 847 | 827 | 169.3 |
| A | 0 | 226 | 7602 | 40.01 | 847 | 827 | 169.3 |
| B | 0 | 189 | 33197 | 202.55 | 843 | 821 | 159.8 |
| B | 0 | 219 | 22094 | 133.09 | 843 | 821 | 159.8 |
| B | 4 | 216 | 22006 | 132.53 | 843 | 821 | 159.8 |
| C | 3 | 233 | 838005 | 4473.88 | 810 | 817 | 187.1 |
| C | 14 | 238 | 127438 | 676.65 | 810 | 817 | 187.1 |
| C | 7 | 247 | 9771 | 47.85 | 810 | 817 | 187.1 |
| D | 1 | 52 | 1957384 | 10169.76 | 799 | 777 | 192.4 |
| D | 12 | 110 | 257294 | 1333.29 | 799 | 777 | 192.4 |
| D | 4 | 95 | 47303 | 241.83 | 799 | 777 | 192.4 |
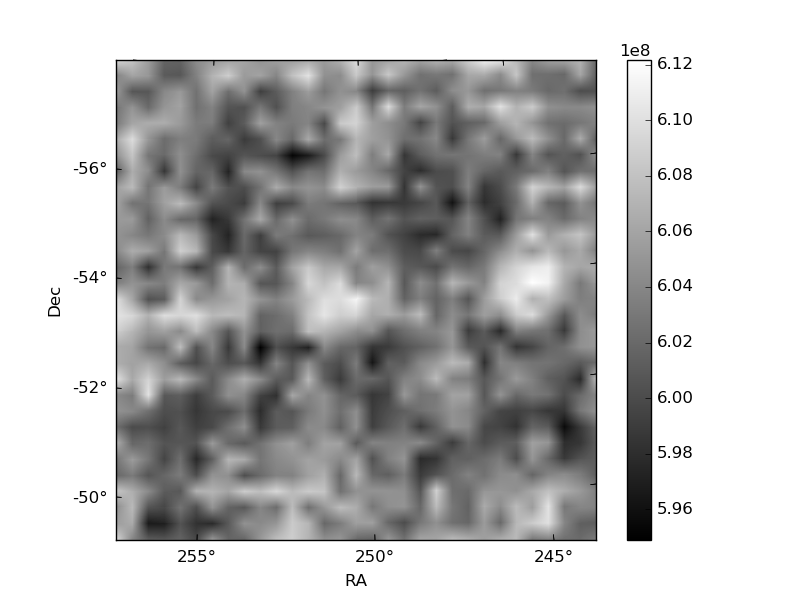
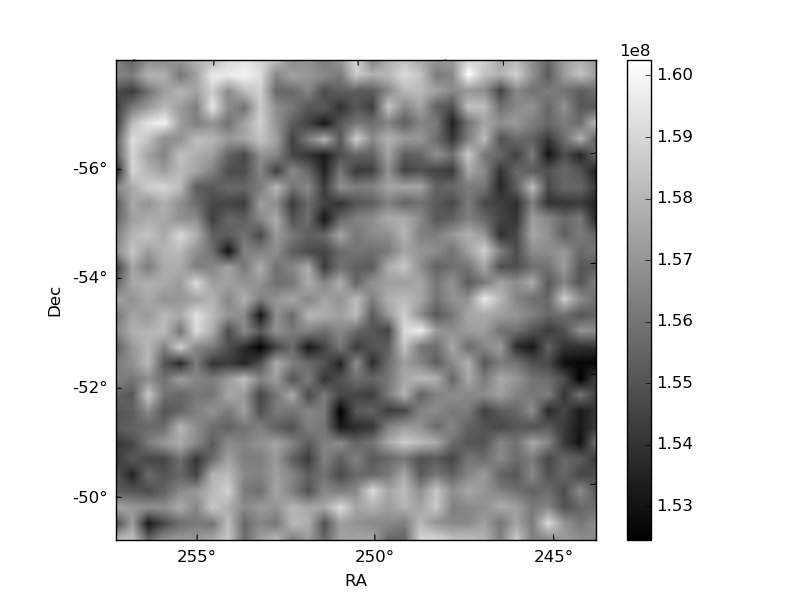
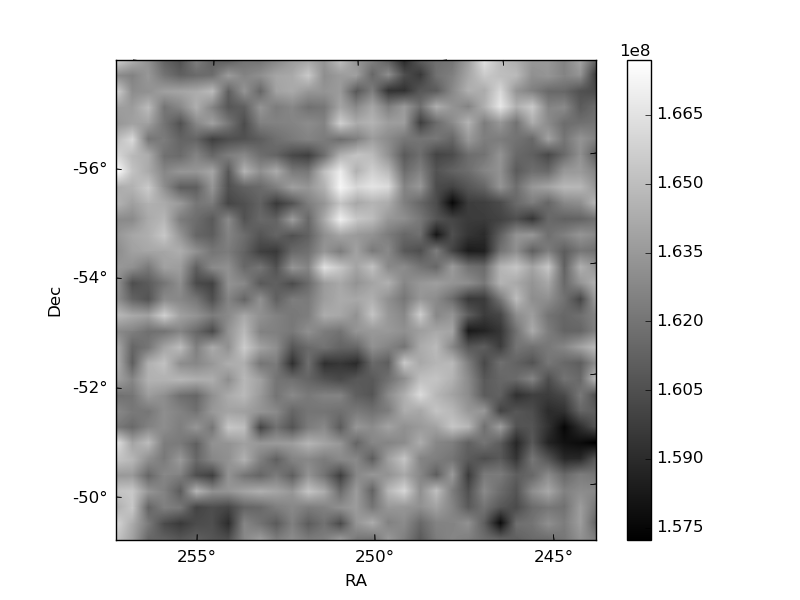
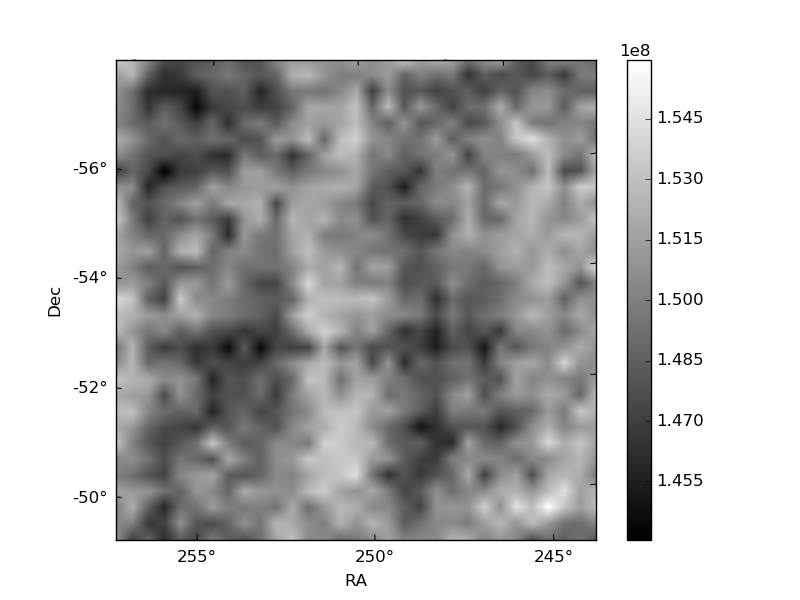
Histogram calculated using DETX and DETY for each event in the final _common_clean file
| Quadrant A | 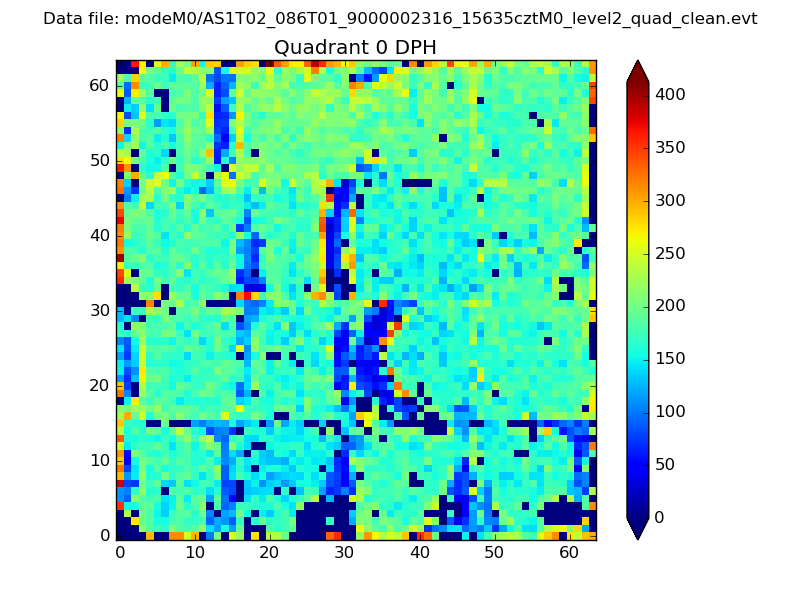 |
 |
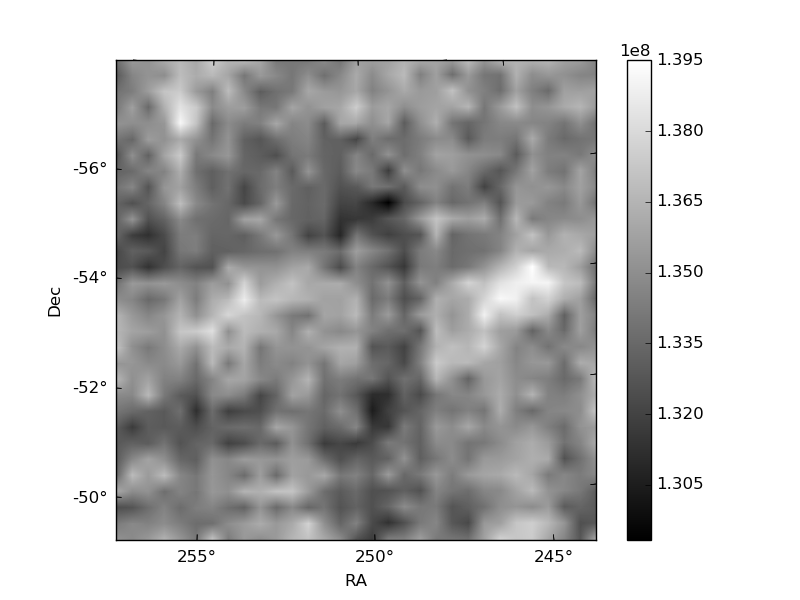
Quadrant B |
|---|---|---|---|
| Quadrant D | 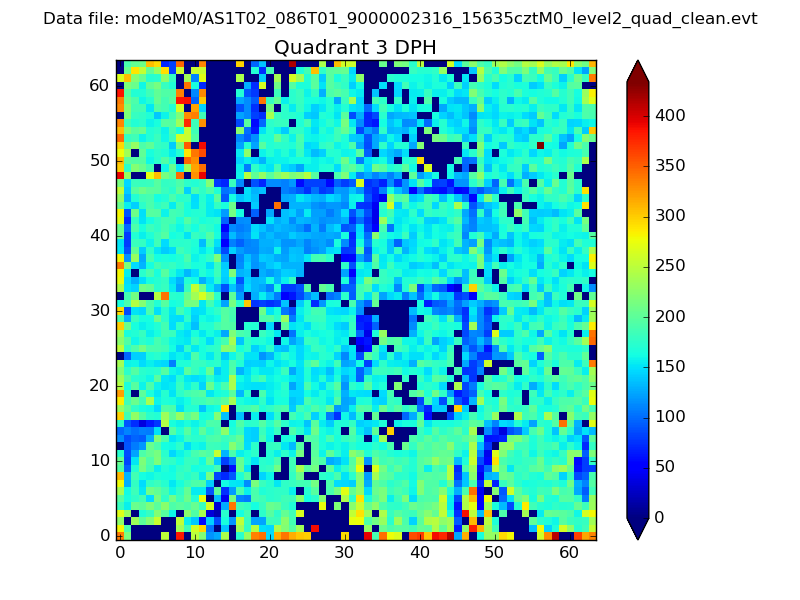 |
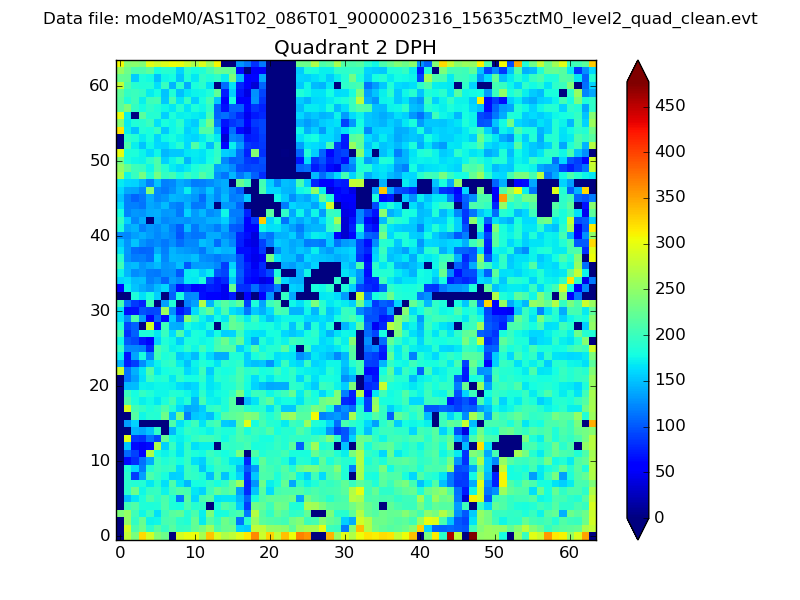 |
Quadrant C |
| Plot type | Count rate plots | Images |
|---|---|---|
| Comparison with Poisson distribution Blue bars denote a histogram of data divided into 1 sec bins. Red curve is a Poisson curve with rate = median count rate of data. |
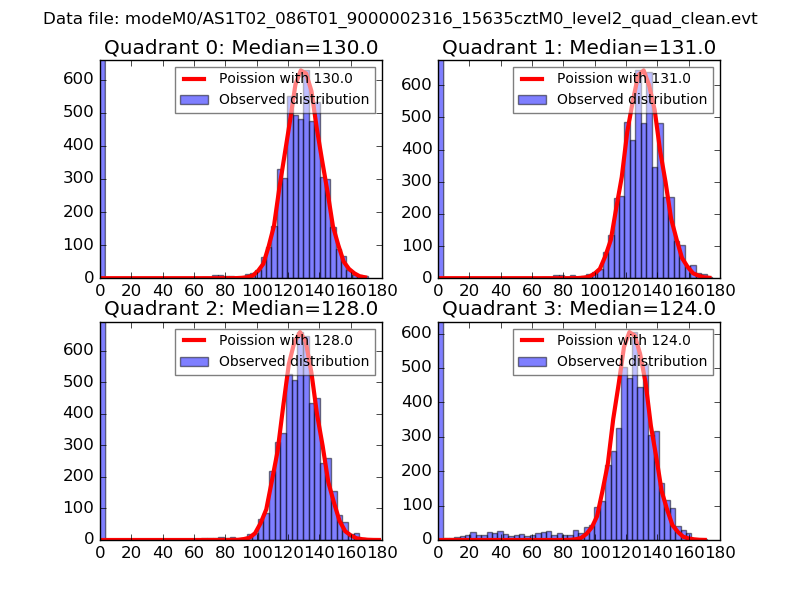 |
 |
| Quadrant-wise count rates Data is divided into 100 sec bins |
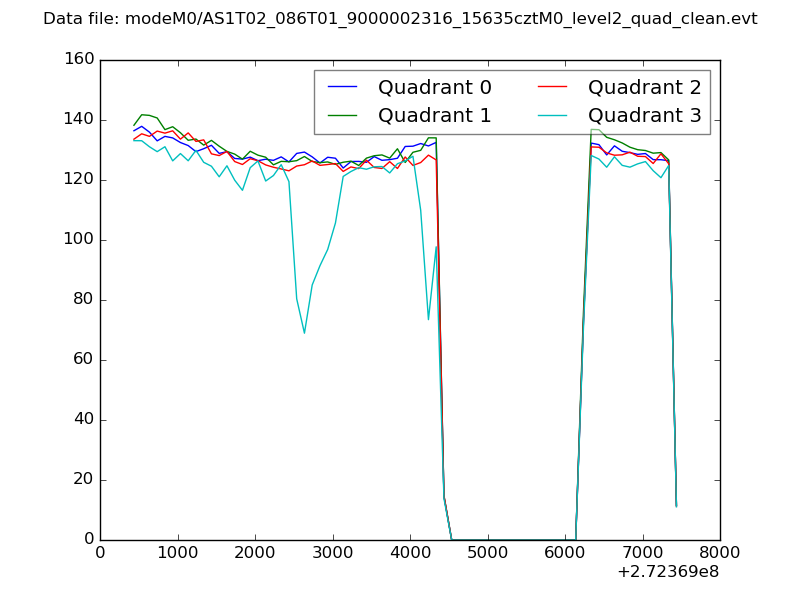 |
|
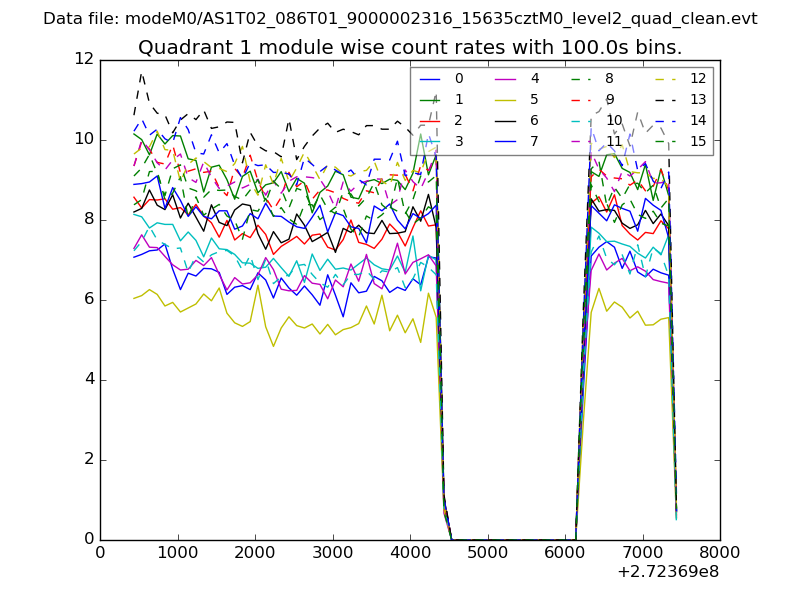
| Module-wise count rates for Quadrant A Data is divided into 100 sec bins |
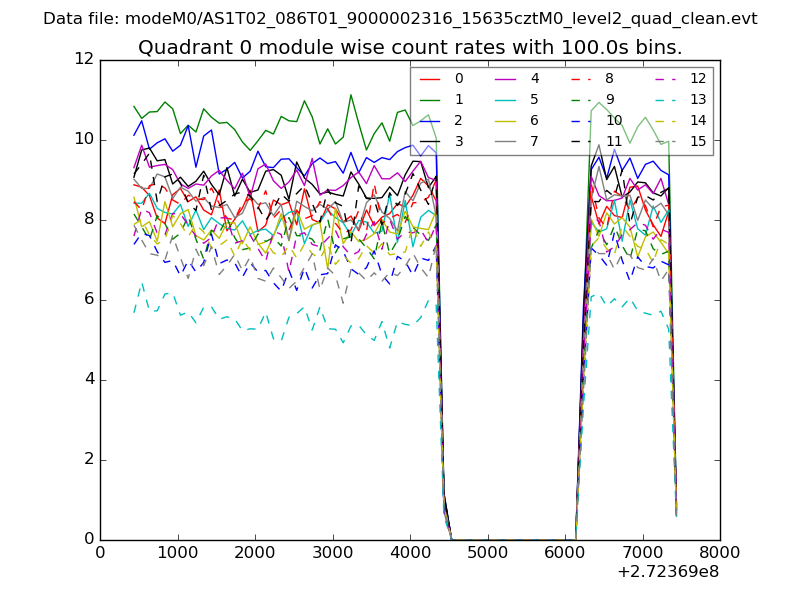 |
 |
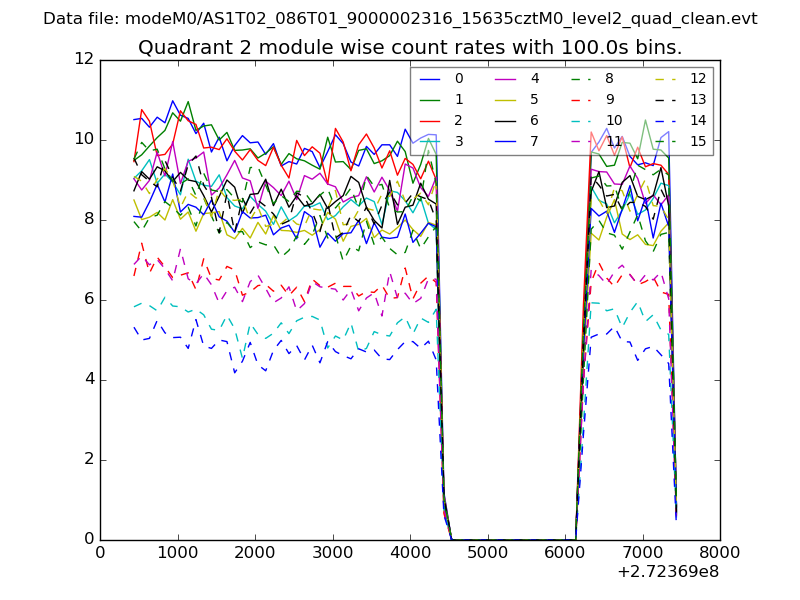
| Module-wise count rates for Quadrant B Data is divided into 100 sec bins |
 |
 |
| Module-wise count rates for Quadrant C Data is divided into 100 sec bins |
 |
 |
| Module-wise count rates for Quadrant D Data is divided into 100 sec bins |
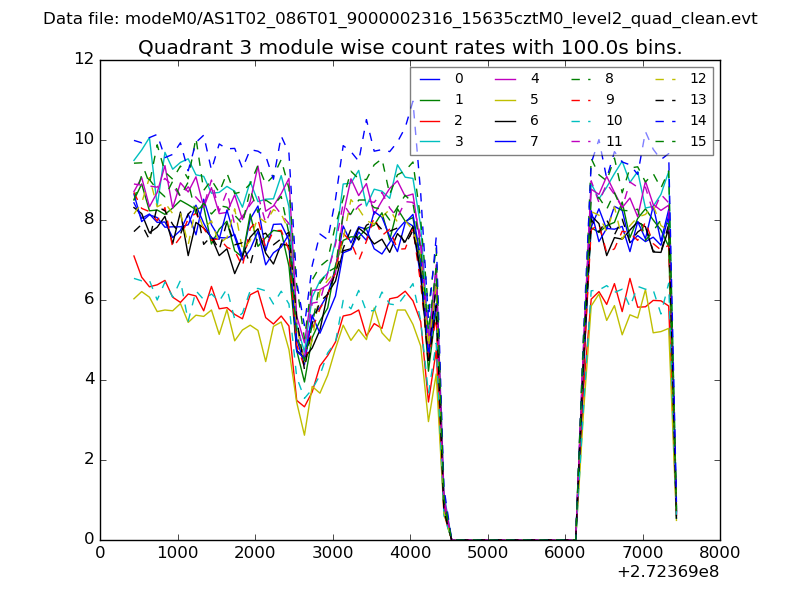 |
 |
| Parameter | Plot |
|---|---|
| CZT HV Monitor |  |
| D_VDD | 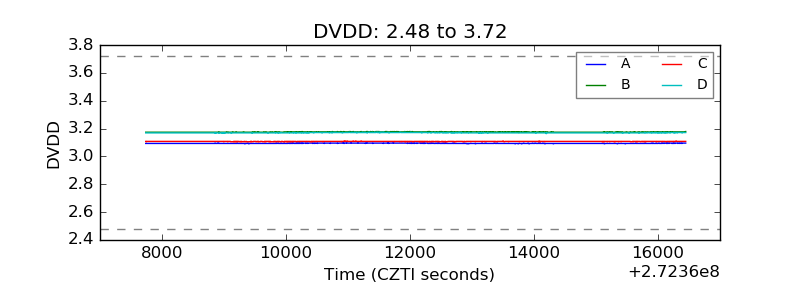 |
| Temperature 1 | 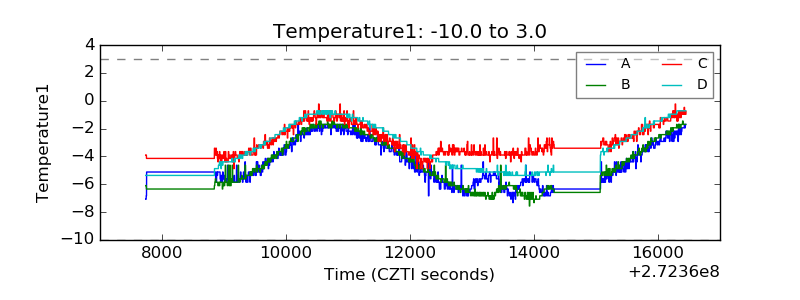 |
| Veto HV Monitor | 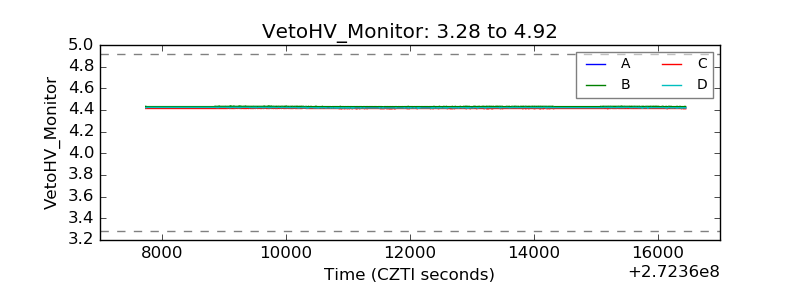 |
| Veto LLD | 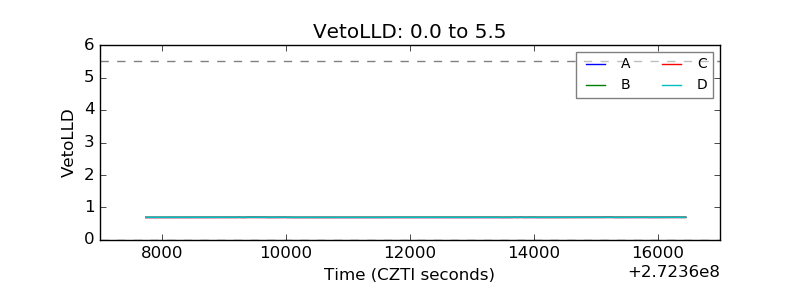 |
| Alpha Counter | 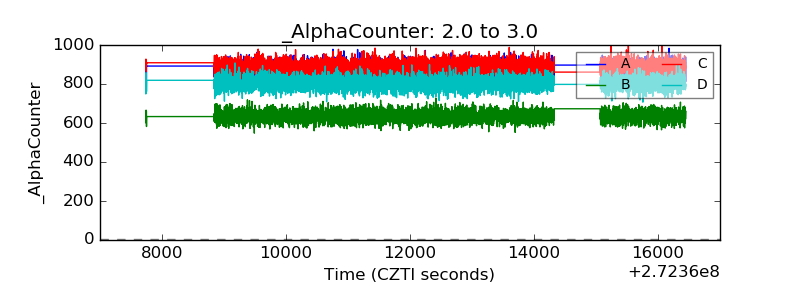 |
| _CPM_Rate | 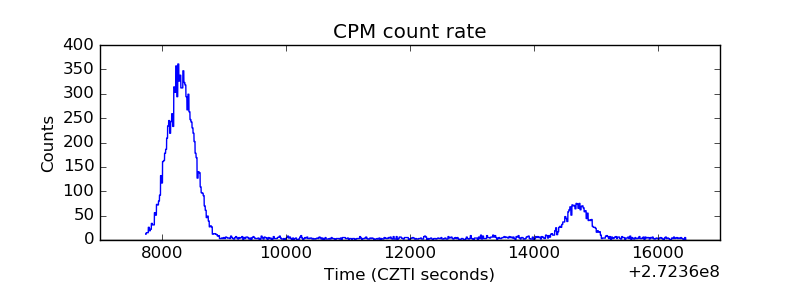 |
| CZT Counter |  |
| +2.5 Volts monitor |  |
| +5 Volts monitor | 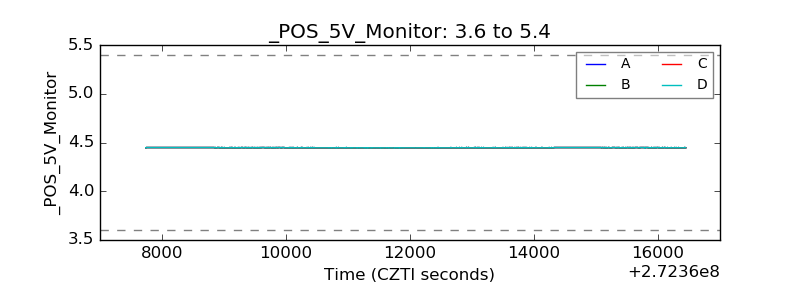 |
| _ROLL_ROT | 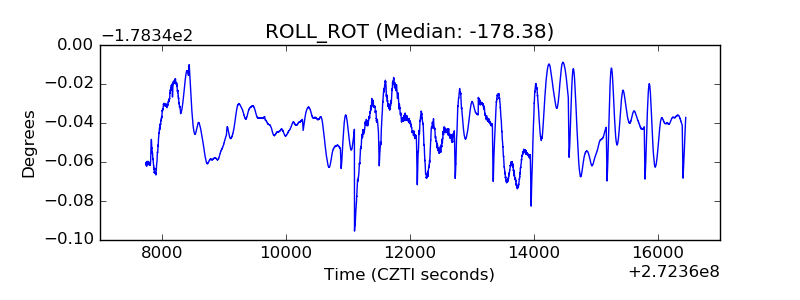 |
| _Roll_DEC | 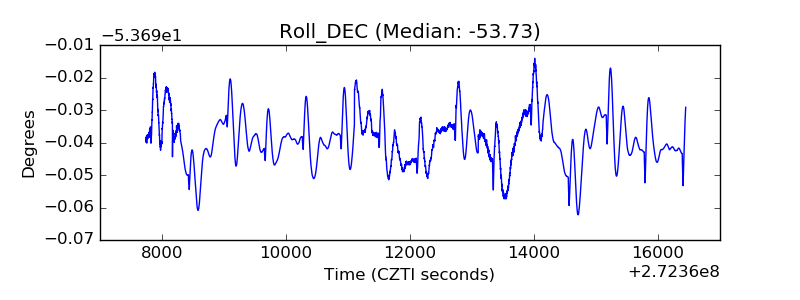 |
| _Roll_RA | 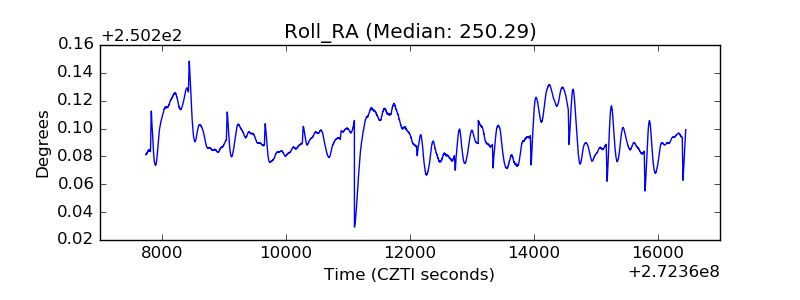 |
| Veto Counter | 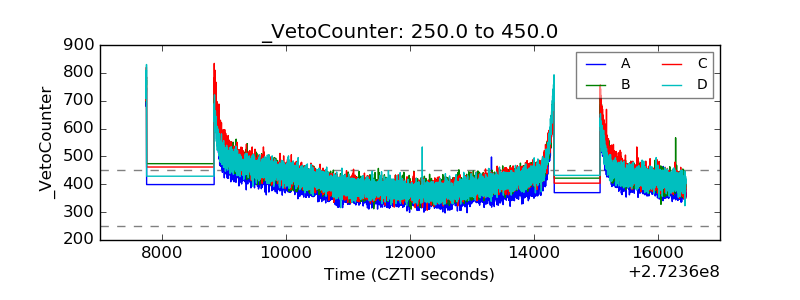 |