| Param | Original file | Final file |
|---|---|---|
| Filename | modeM0/AS1T02_086T01_9000002316_15636cztM0_level2.evt | modeM0/AS1T02_086T01_9000002316_15636cztM0_level2_quad_clean.evt |
| Size (bytes) | 544,803,840 | 106,413,120 |
| Size | 519.6 MB | 101.5 MB |
| Events in quadrant A | 3,382,370 | 692,232 |
| Events in quadrant B | 3,556,647 | 698,707 |
| Events in quadrant C | 3,895,986 | 681,765 |
| Events in quadrant D | 5,177,746 | 650,850 |
| Mode SS | |||
|---|---|---|---|
| Quadrant | BADHDUFLAG | Total packets | Discarded packets |
| A | 0 | 144 | 0 |
| B | 0 | 144 | 0 |
| C | 0 | 144 | 0 |
| D | 0 | 144 | 0 |
| Mode M9 | |||
|---|---|---|---|
| Quadrant | BADHDUFLAG | Total packets | Discarded packets |
| A | 0 | 3 | 0 |
| B | 0 | 3 | 0 |
| C | 0 | 3 | 0 |
| D | 0 | 3 | 0 |
| Mode M0 | |||
|---|---|---|---|
| Quadrant | BADHDUFLAG | Total packets | Discarded packets |
| A | 0 | 14807 | 2 |
| B | 0 | 15108 | 1 |
| C | 0 | 16254 | 1 |
| D | 0 | 20438 | 1 |
| Quadrant | Total seconds | Saturated seconds | Saturation percentage |
|---|---|---|---|
| A | 7174 | 183 | 2.550878% |
| B | 7174 | 192 | 2.676331% |
| C | 7174 | 217 | 3.024812% |
| D | 7174 | 595 | 8.293839% |
Noise dominated data is calculated using 1-second bins in cleaned event files. If a bin has >2000 counts, and if more than 50% of those come from <1% of pixels, then it is considered to be noise-dominated and hence unusable.
| Quadrant | # 1 sec bins | Bins with >0 counts | Bins with >2000 counts | High rate bins dominated by noise | Noise dominated (total time) | Noise dominated (detector-on time) | Marked lightcurve |
|---|---|---|---|---|---|---|---|
| A | 7405 | 7175 | 0 | 0 | 0.00% | 0.00% | 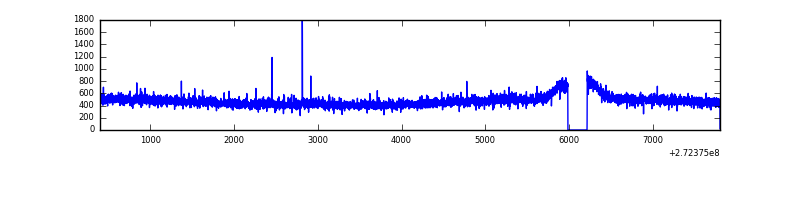 |
| B | 7405 | 7175 | 2 | 2 | 0.03% | 0.03% | 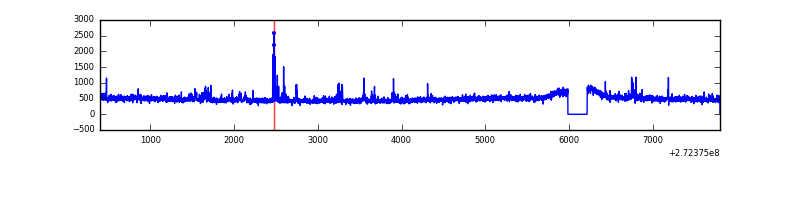 |
| C | 7405 | 7175 | 0 | 0 | 0.00% | 0.00% | 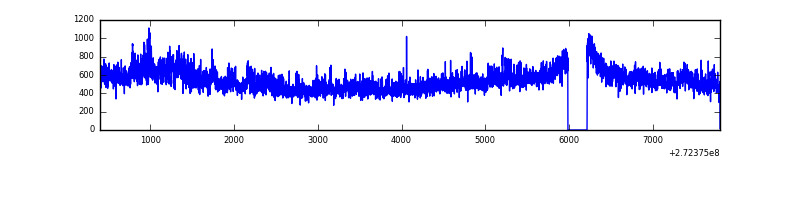 |
| D | 7405 | 7176 | 395 | 395 | 5.33% | 5.50% | 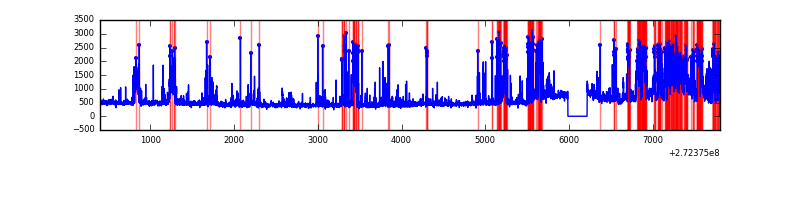 |
Top three noisy pixels from each quadrant. If the there are fewer than three noisy pixels in the level2.evt file, extra rows are filled as -1
| Pixel properties | Quadrant properties | ||||||
|---|---|---|---|---|---|---|---|
| Quadrant | DetID | PixID | Counts | Sigma | Mean | Median | Sigma |
| A | 3 | 80 | 23170 | 126.34 | 872 | 853 | 176.6 |
| A | 0 | 226 | 7716 | 38.85 | 872 | 853 | 176.6 |
| A | 12 | 194 | 6463 | 31.76 | 872 | 853 | 176.6 |
| B | 0 | 189 | 55821 | 331.3 | 868 | 845 | 165.9 |
| B | 3 | 209 | 22322 | 129.43 | 868 | 845 | 165.9 |
| B | 12 | 111 | 19230 | 110.79 | 868 | 845 | 165.9 |
| C | 3 | 233 | 506489 | 2577.37 | 834 | 838 | 196.2 |
| C | 14 | 238 | 128645 | 651.45 | 834 | 838 | 196.2 |
| C | 7 | 247 | 10891 | 51.24 | 834 | 838 | 196.2 |
| D | 1 | 52 | 1714721 | 8482.5 | 833 | 807 | 202.1 |
| D | 12 | 110 | 216692 | 1068.46 | 833 | 807 | 202.1 |
| D | 4 | 95 | 30844 | 148.66 | 833 | 807 | 202.1 |
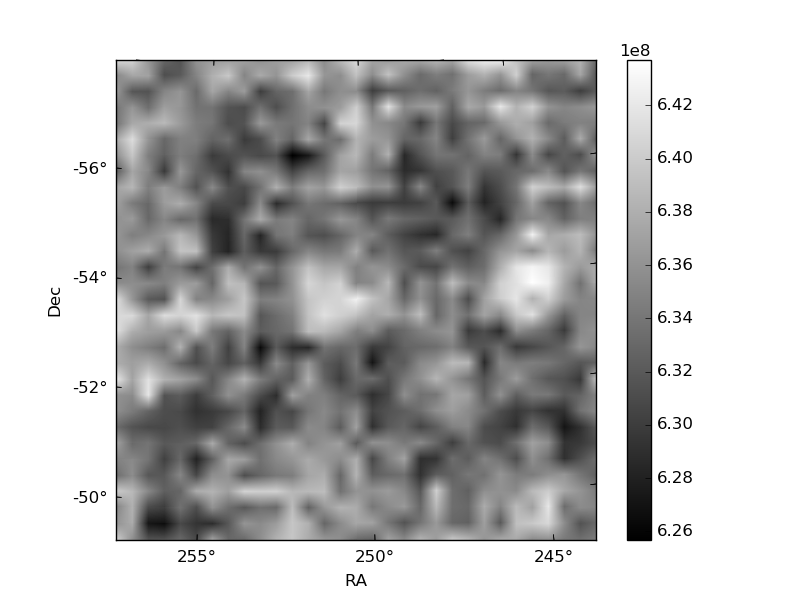
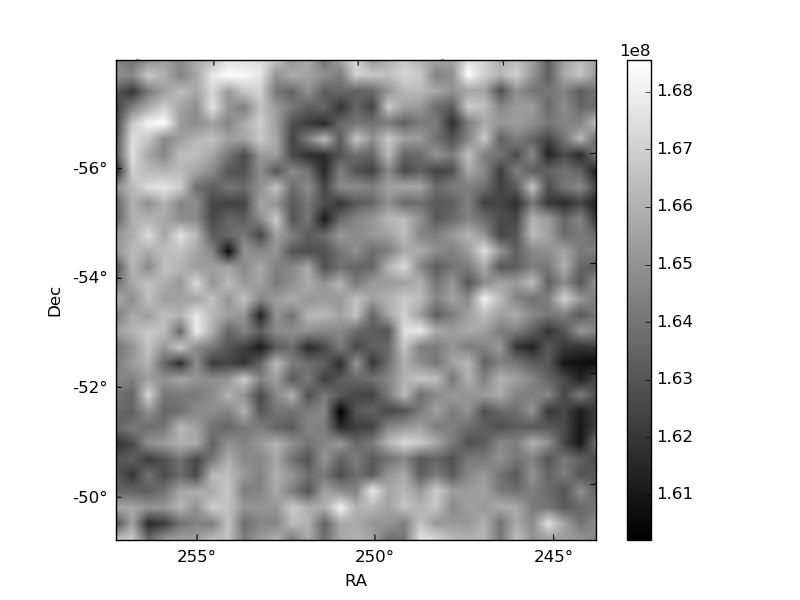
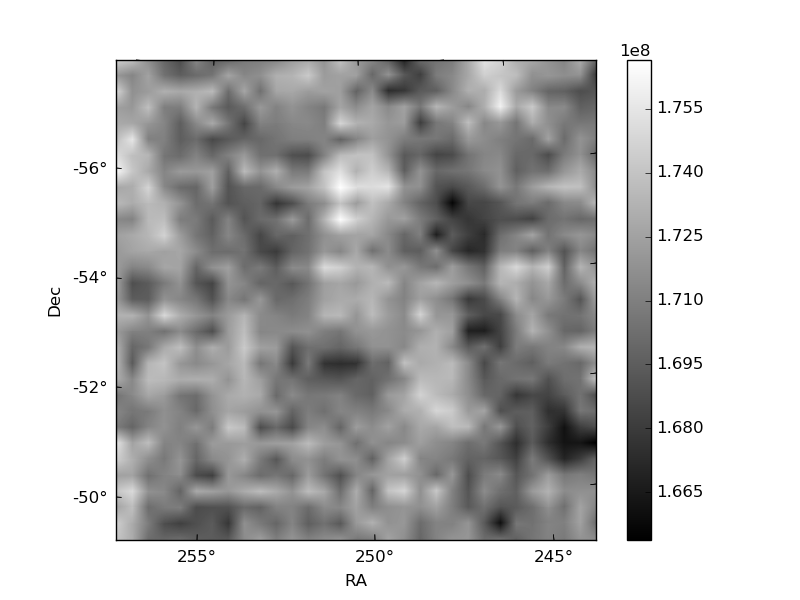
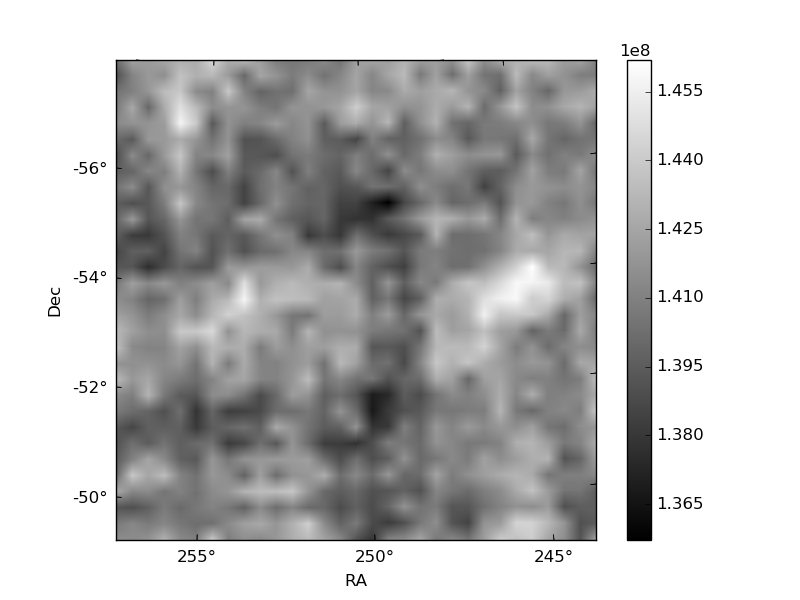
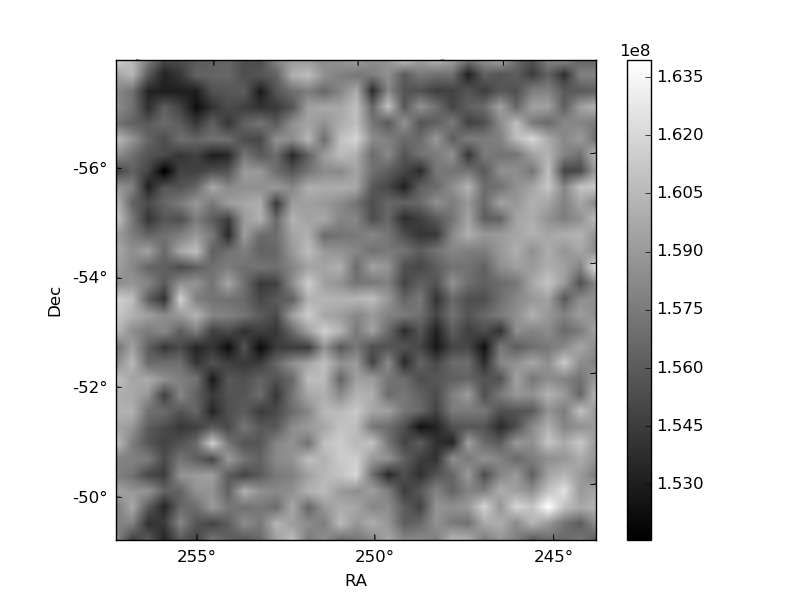
Histogram calculated using DETX and DETY for each event in the final _common_clean file
| Quadrant A | 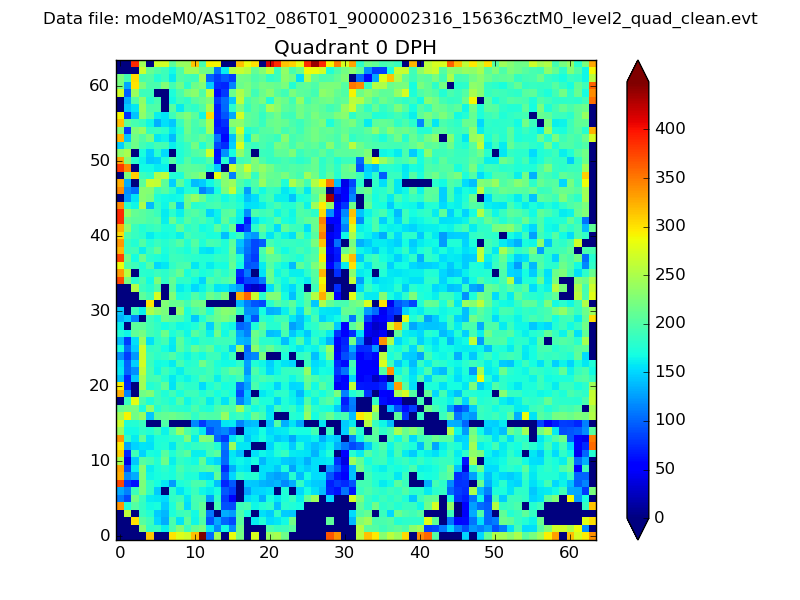 |
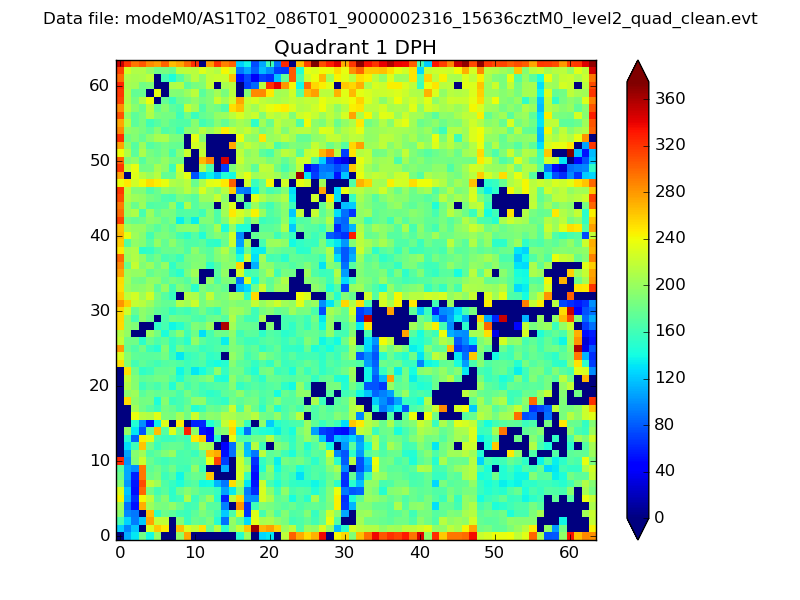 |
Quadrant B |
|---|---|---|---|
| Quadrant D | 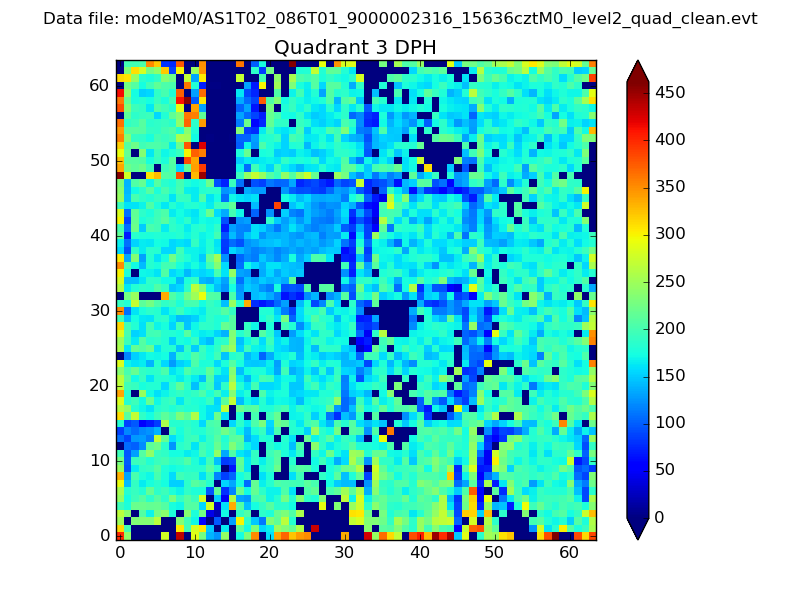 |
 |
Quadrant C |
| Plot type | Count rate plots | Images |
|---|---|---|
| Comparison with Poisson distribution Blue bars denote a histogram of data divided into 1 sec bins. Red curve is a Poisson curve with rate = median count rate of data. |
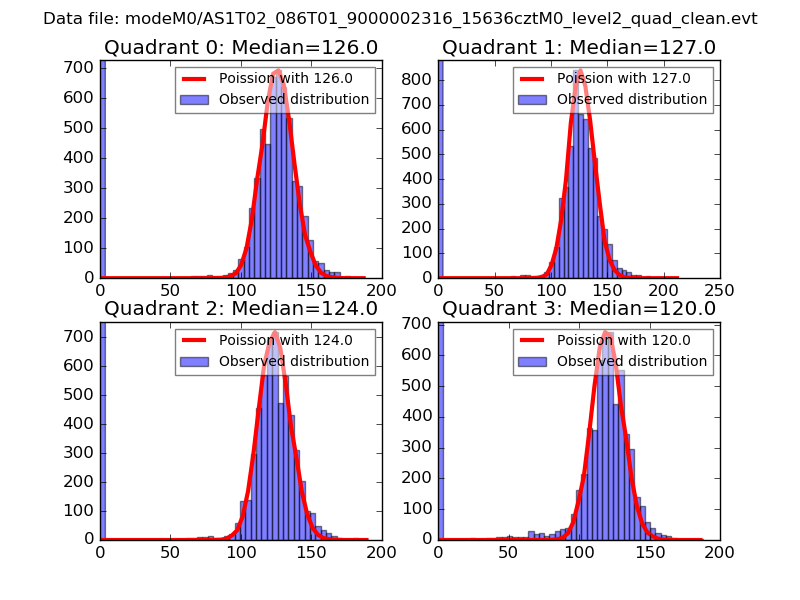 |
 |
| Quadrant-wise count rates Data is divided into 100 sec bins |
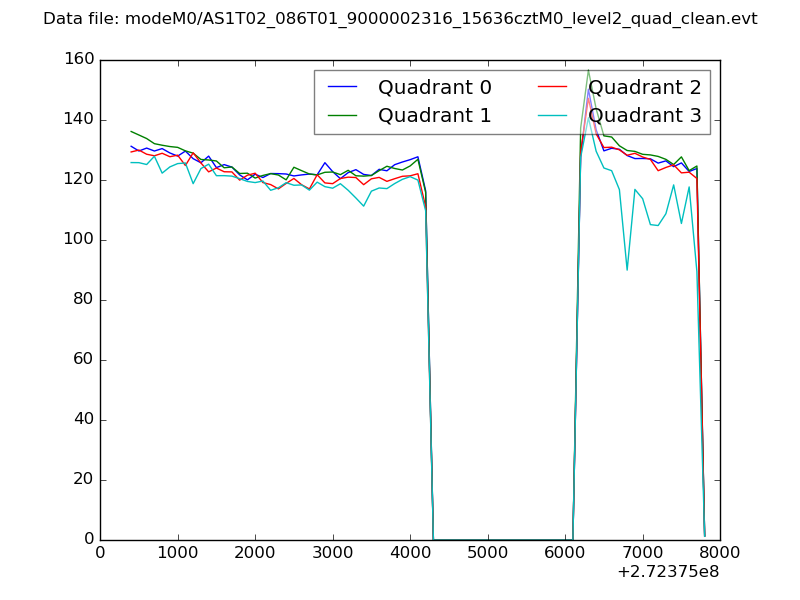 |
|
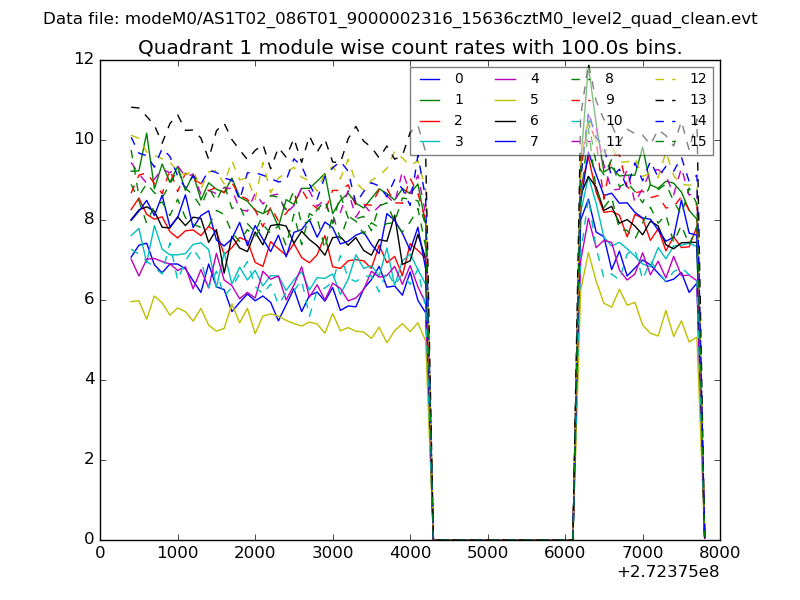
| Module-wise count rates for Quadrant A Data is divided into 100 sec bins |
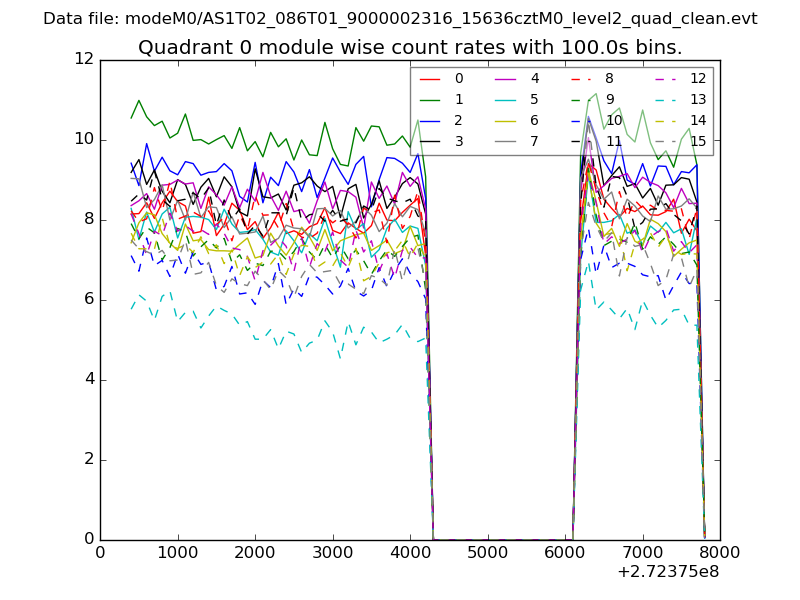 |
 |
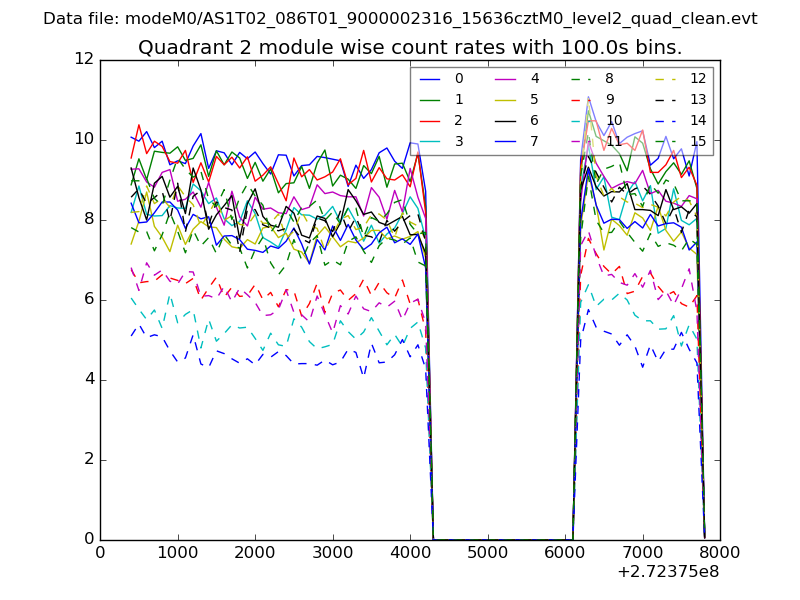
| Module-wise count rates for Quadrant B Data is divided into 100 sec bins |
 |
 |
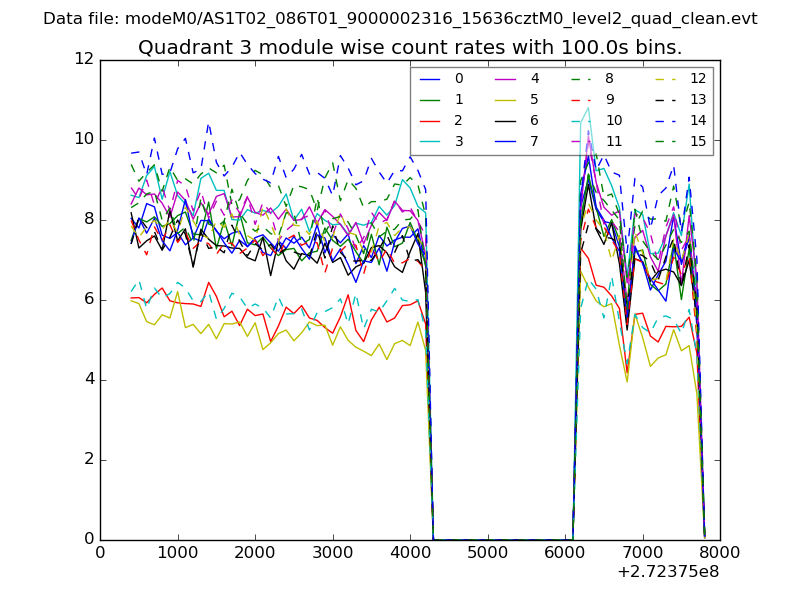
| Module-wise count rates for Quadrant C Data is divided into 100 sec bins |
 |
 |
| Module-wise count rates for Quadrant D Data is divided into 100 sec bins |
 |
 |
| Parameter | Plot |
|---|---|
| CZT HV Monitor | 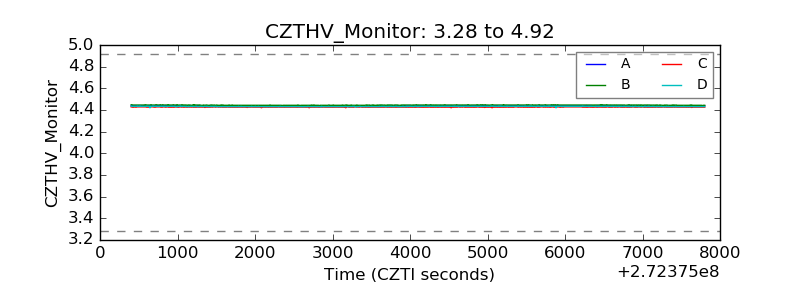 |
| D_VDD | 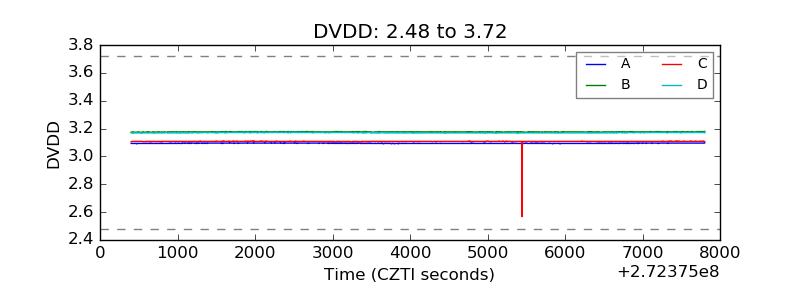 |
| Temperature 1 | 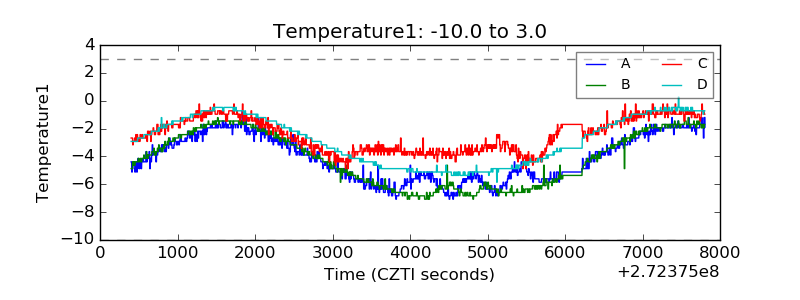 |
| Veto HV Monitor | 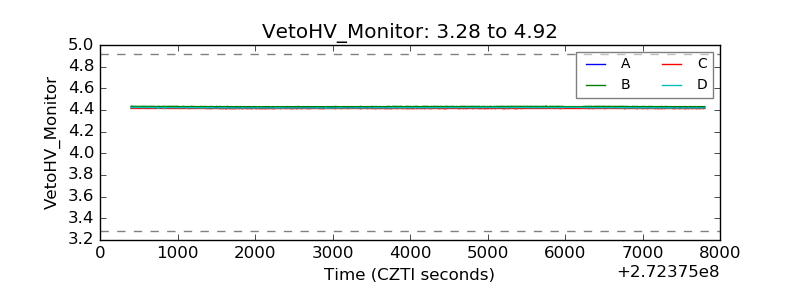 |
| Veto LLD | 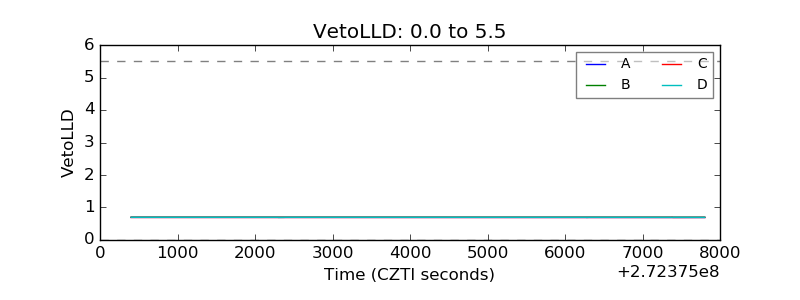 |
| Alpha Counter | 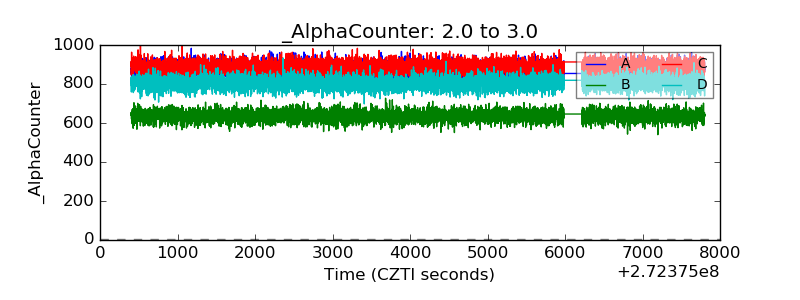 |
| _CPM_Rate | 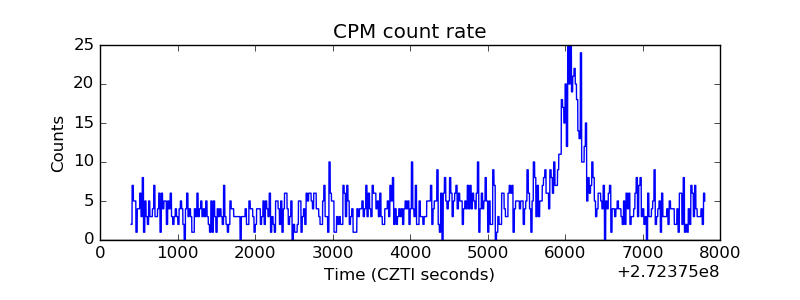 |
| CZT Counter | 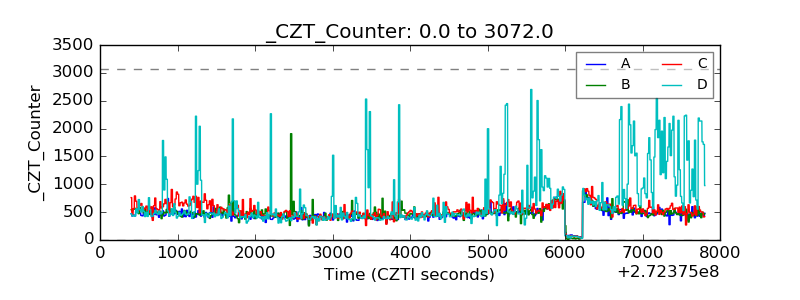 |
| +2.5 Volts monitor |  |
| +5 Volts monitor | 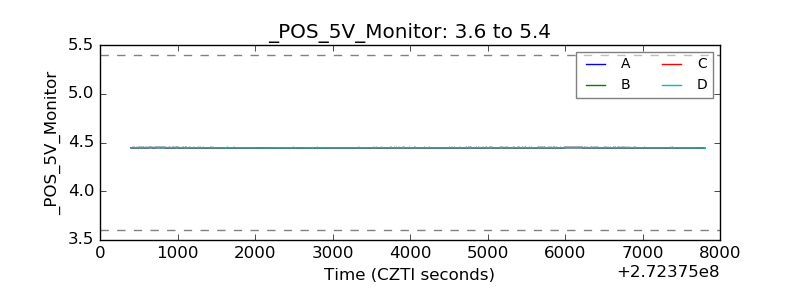 |
| _ROLL_ROT | 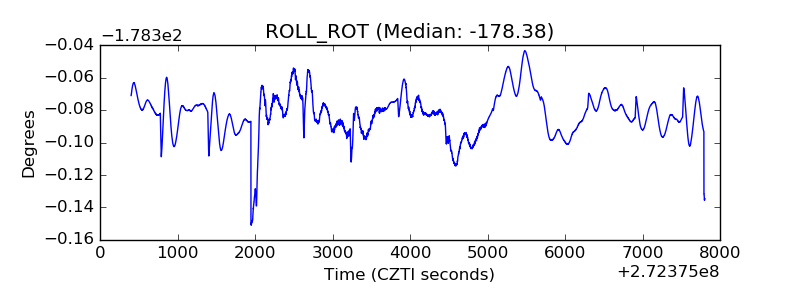 |
| _Roll_DEC | 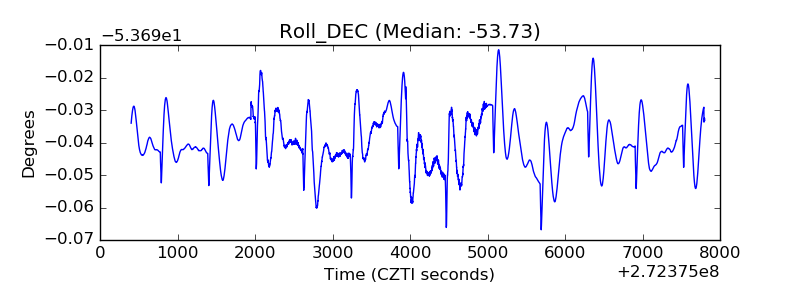 |
| _Roll_RA | 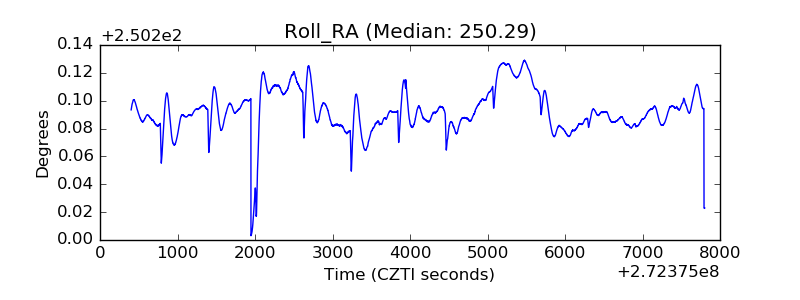 |
| Veto Counter | 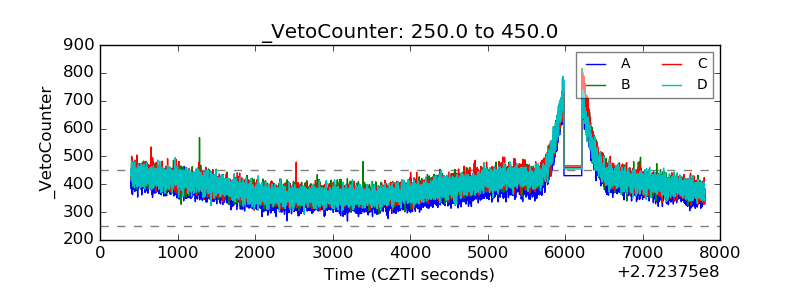 |