| Param | Original file | Final file |
|---|---|---|
| Filename | modeM0/AS1T02_086T01_9000002316_15637cztM0_level2.evt | modeM0/AS1T02_086T01_9000002316_15637cztM0_level2_quad_clean.evt |
| Size (bytes) | 523,330,560 | 101,180,160 |
| Size | 499.1 MB | 96.5 MB |
| Events in quadrant A | 3,288,249 | 653,968 |
| Events in quadrant B | 3,364,937 | 657,597 |
| Events in quadrant C | 3,690,829 | 643,357 |
| Events in quadrant D | 5,023,447 | 614,929 |
| Mode SS | |||
|---|---|---|---|
| Quadrant | BADHDUFLAG | Total packets | Discarded packets |
| A | 0 | 144 | 0 |
| B | 0 | 144 | 0 |
| C | 0 | 144 | 0 |
| D | 0 | 144 | 0 |
| Mode M9 | |||
|---|---|---|---|
| Quadrant | BADHDUFLAG | Total packets | Discarded packets |
| A | 0 | 2 | 0 |
| B | 0 | 2 | 0 |
| C | 0 | 2 | 0 |
| D | 0 | 2 | 0 |
| Mode M0 | |||
|---|---|---|---|
| Quadrant | BADHDUFLAG | Total packets | Discarded packets |
| A | 0 | 14623 | 2 |
| B | 0 | 14658 | 1 |
| C | 0 | 15312 | 1 |
| D | 0 | 19720 | 1 |
| Quadrant | Total seconds | Saturated seconds | Saturation percentage |
|---|---|---|---|
| A | 7097 | 72 | 1.014513% |
| B | 7097 | 86 | 1.211780% |
| C | 7097 | 102 | 1.437227% |
| D | 7097 | 402 | 5.664365% |
Noise dominated data is calculated using 1-second bins in cleaned event files. If a bin has >2000 counts, and if more than 50% of those come from <1% of pixels, then it is considered to be noise-dominated and hence unusable.
| Quadrant | # 1 sec bins | Bins with >0 counts | Bins with >2000 counts | High rate bins dominated by noise | Noise dominated (total time) | Noise dominated (detector-on time) | Marked lightcurve |
|---|---|---|---|---|---|---|---|
| A | 7298 | 7099 | 1 | 1 | 0.01% | 0.01% |  |
| B | 7298 | 7099 | 0 | 0 | 0.00% | 0.00% | 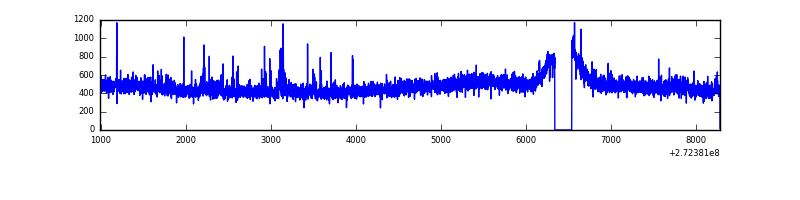 |
| C | 7298 | 7098 | 0 | 0 | 0.00% | 0.00% | 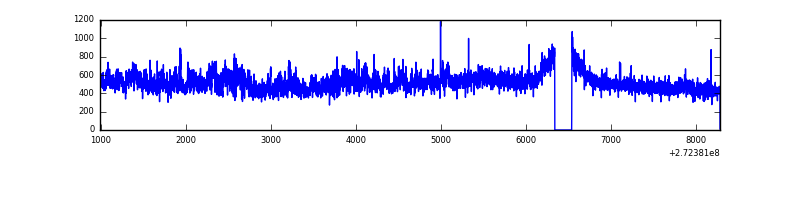 |
| D | 7298 | 7098 | 363 | 363 | 4.97% | 5.11% | 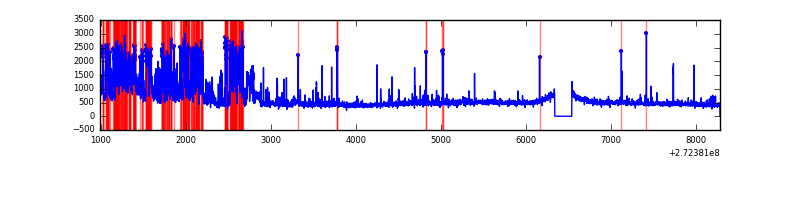 |
Top three noisy pixels from each quadrant. If the there are fewer than three noisy pixels in the level2.evt file, extra rows are filled as -1
| Pixel properties | Quadrant properties | ||||||
|---|---|---|---|---|---|---|---|
| Quadrant | DetID | PixID | Counts | Sigma | Mean | Median | Sigma |
| A | 13 | 248 | 23731 | 132.71 | 845 | 826 | 172.6 |
| A | 0 | 226 | 7786 | 40.33 | 845 | 826 | 172.6 |
| A | 3 | 80 | 7274 | 37.36 | 845 | 826 | 172.6 |
| B | 0 | 189 | 24108 | 143.23 | 842 | 820 | 162.6 |
| B | 12 | 111 | 18818 | 110.69 | 842 | 820 | 162.6 |
| B | 11 | 111 | 15684 | 91.42 | 842 | 820 | 162.6 |
| C | 3 | 233 | 421012 | 2225.46 | 805 | 809 | 188.8 |
| C | 14 | 238 | 123268 | 648.56 | 805 | 809 | 188.8 |
| C | 13 | 61 | 5860 | 26.75 | 805 | 809 | 188.8 |
| D | 1 | 52 | 1613904 | 8114.1 | 809 | 784 | 198.8 |
| D | 12 | 110 | 254928 | 1278.36 | 809 | 784 | 198.8 |
| D | 2 | 234 | 29763 | 145.77 | 809 | 784 | 198.8 |
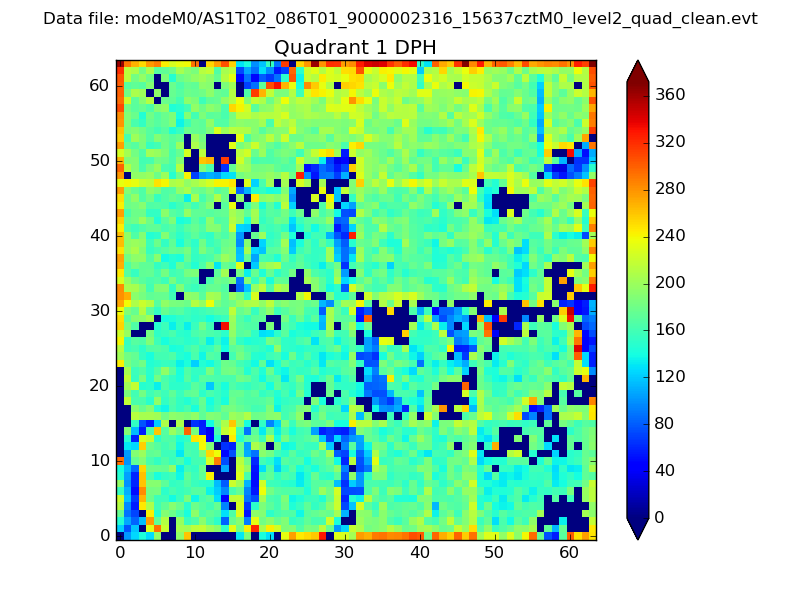
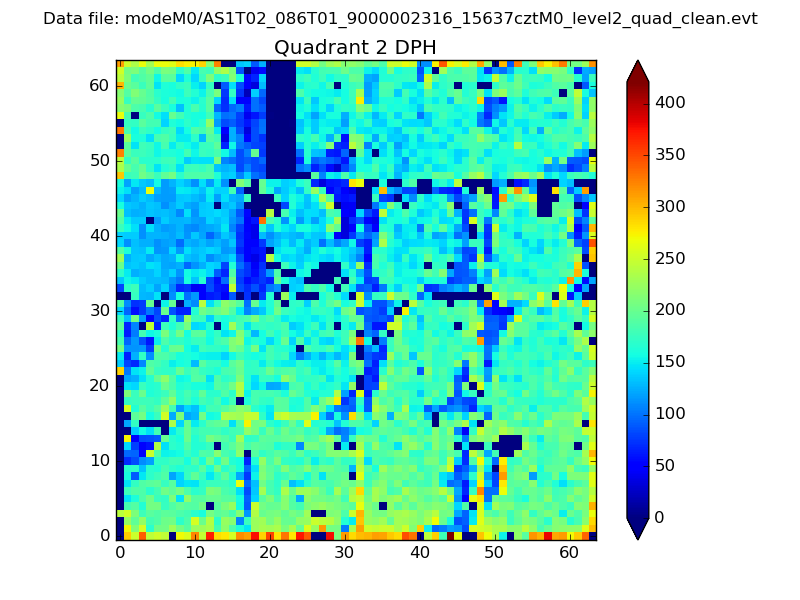
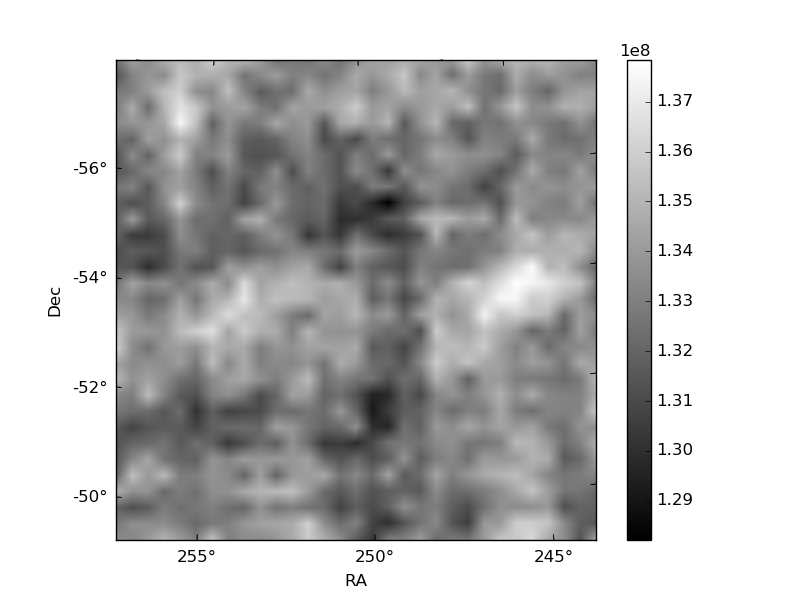
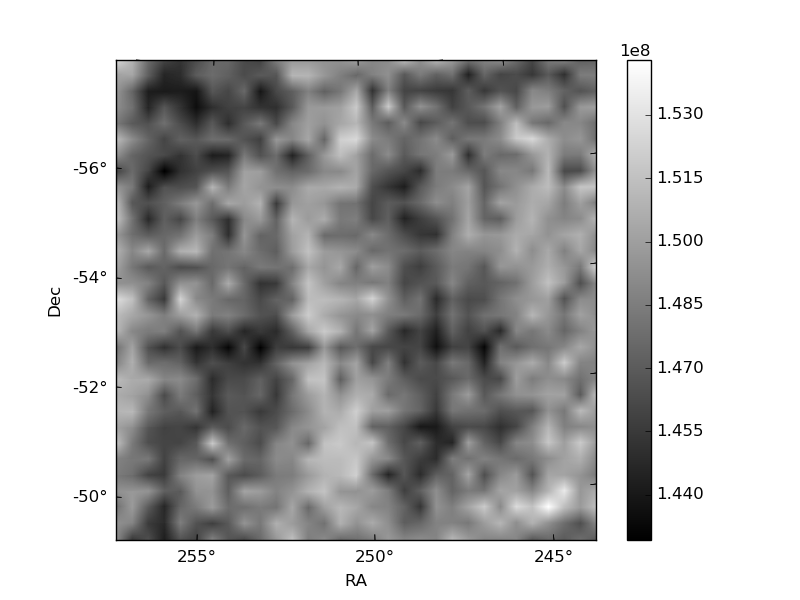
Histogram calculated using DETX and DETY for each event in the final _common_clean file
| Quadrant A | 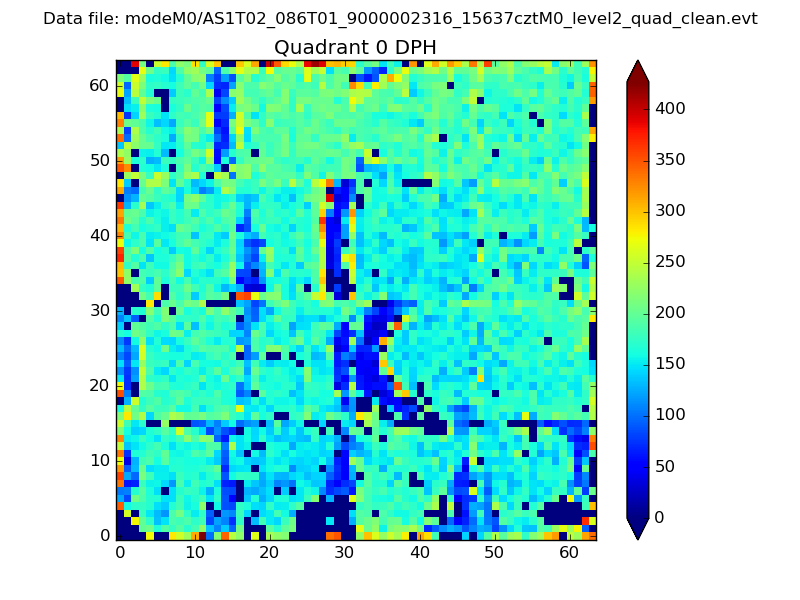 |
 |
Quadrant B |
|---|---|---|---|
| Quadrant D | 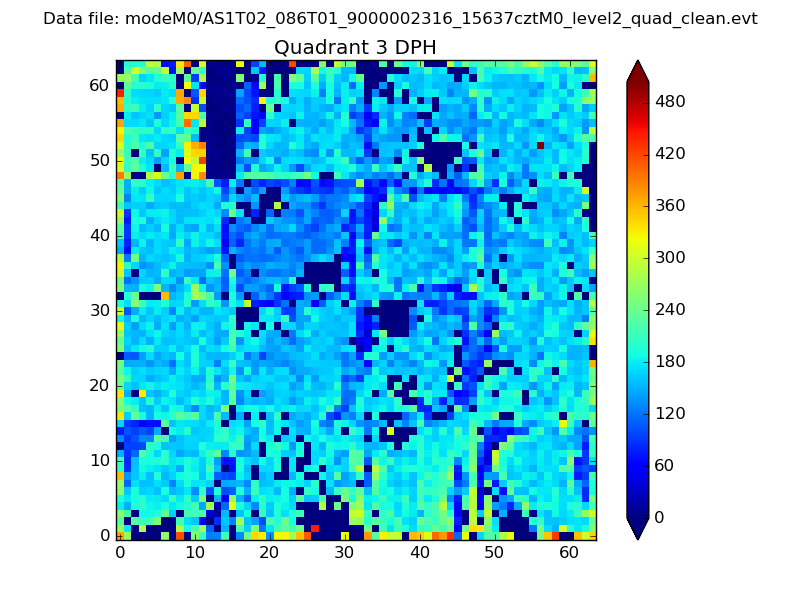 |
 |
Quadrant C |
| Plot type | Count rate plots | Images |
|---|---|---|
| Comparison with Poisson distribution Blue bars denote a histogram of data divided into 1 sec bins. Red curve is a Poisson curve with rate = median count rate of data. |
 |
 |
| Quadrant-wise count rates Data is divided into 100 sec bins |
 |
|
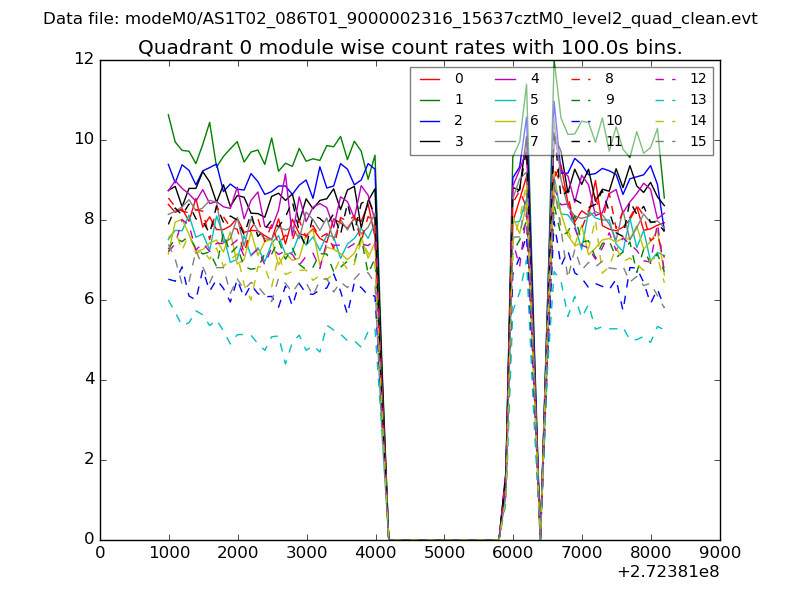
| Module-wise count rates for Quadrant A Data is divided into 100 sec bins |
 |
 |
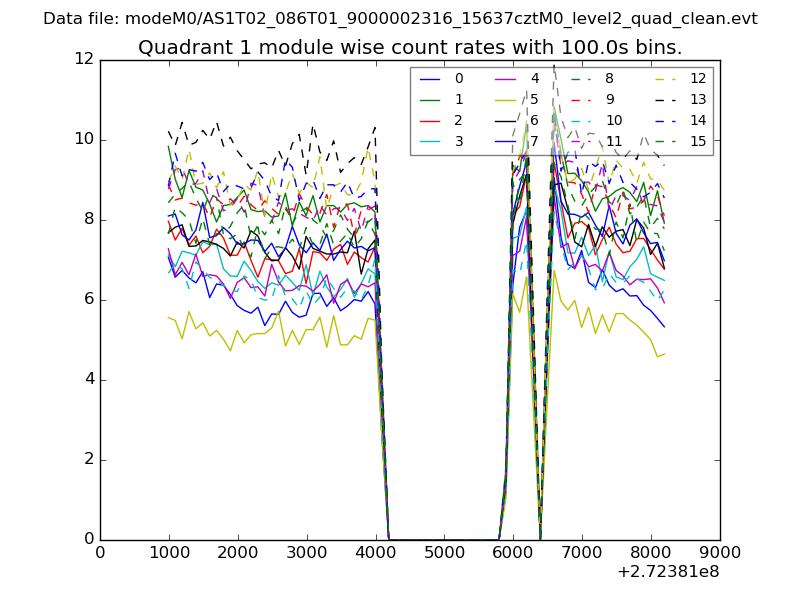
| Module-wise count rates for Quadrant B Data is divided into 100 sec bins |
 |
 |
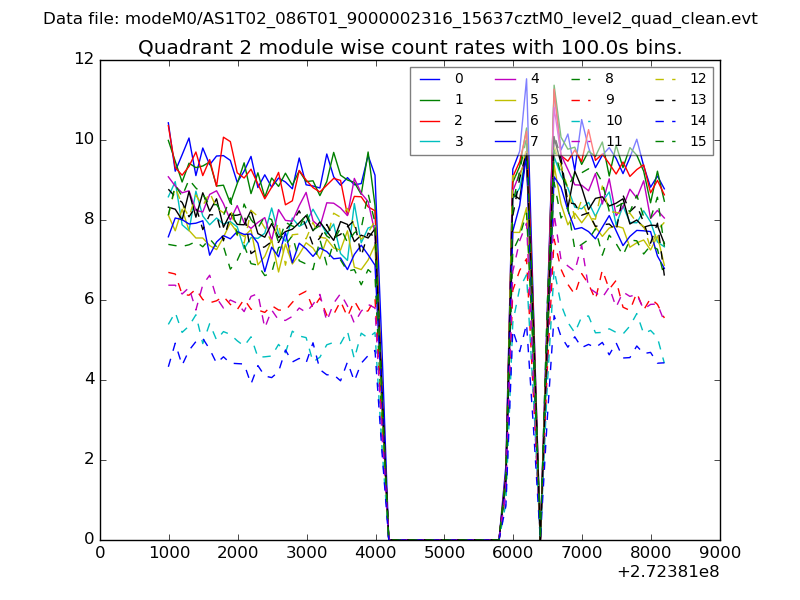
| Module-wise count rates for Quadrant C Data is divided into 100 sec bins |
 |
 |
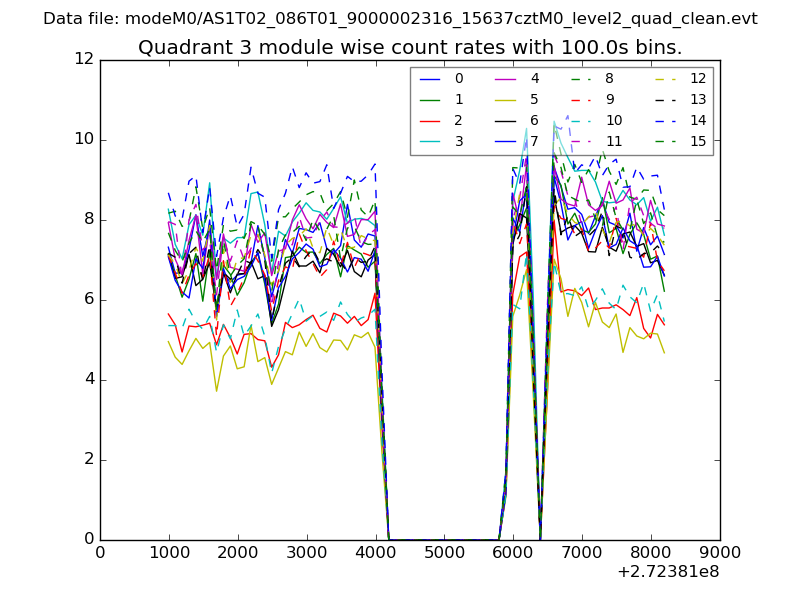
| Module-wise count rates for Quadrant D Data is divided into 100 sec bins |
 |
 |
| Parameter | Plot |
|---|---|
| CZT HV Monitor | 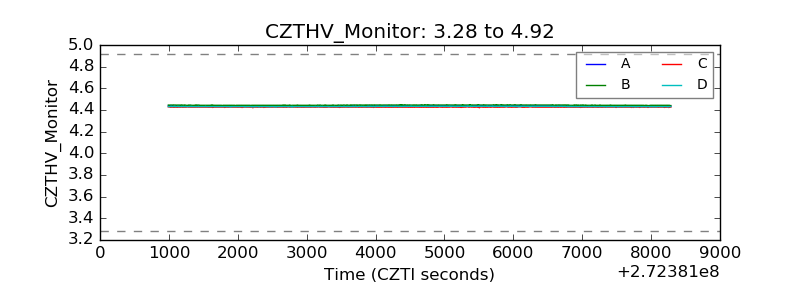 |
| D_VDD | 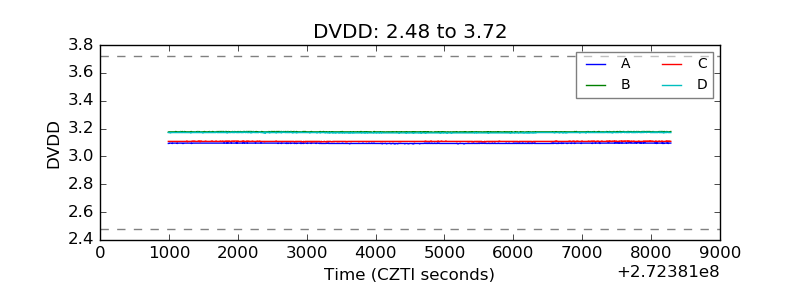 |
| Temperature 1 | 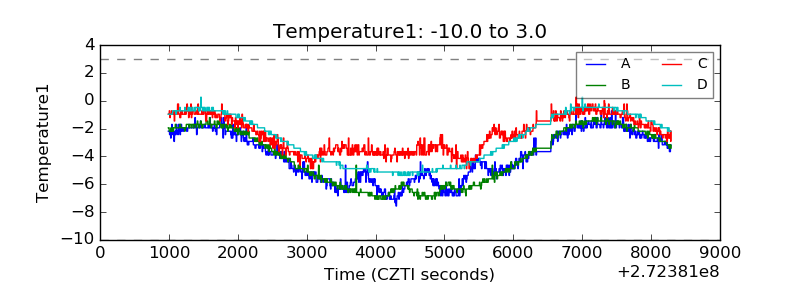 |
| Veto HV Monitor | 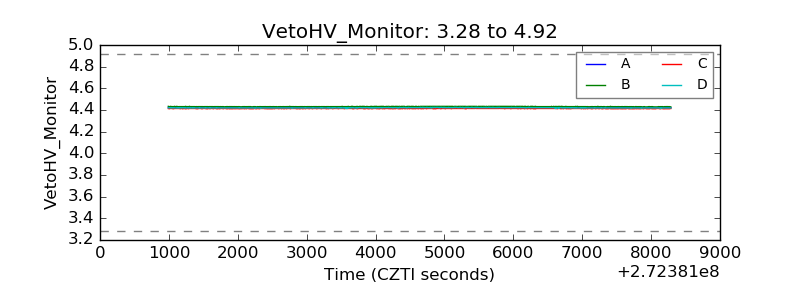 |
| Veto LLD | 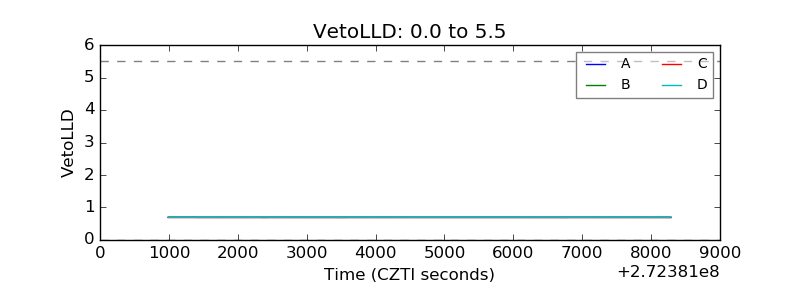 |
| Alpha Counter | 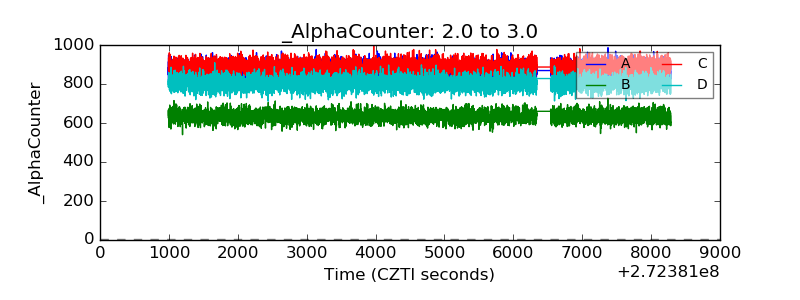 |
| _CPM_Rate | 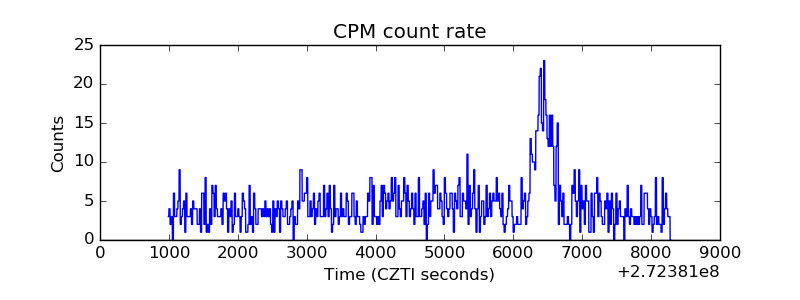 |
| CZT Counter | 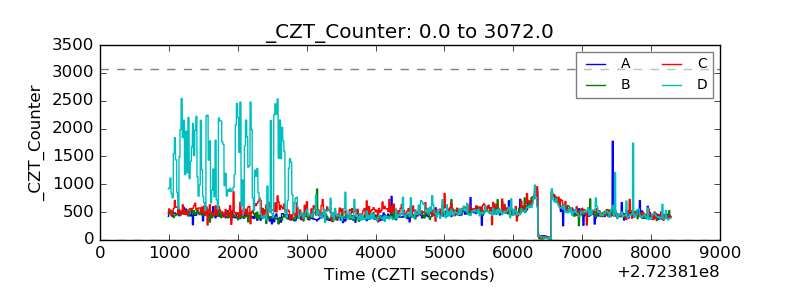 |
| +2.5 Volts monitor |  |
| +5 Volts monitor | 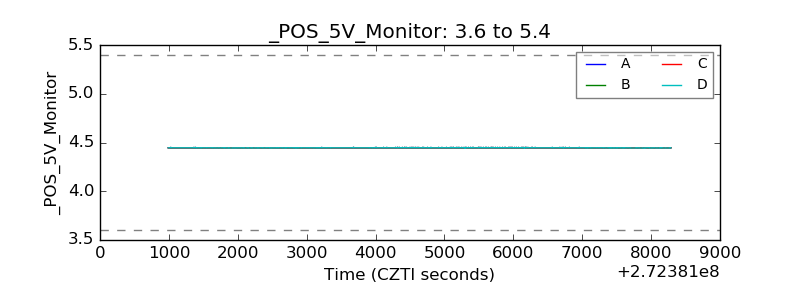 |
| _ROLL_ROT | 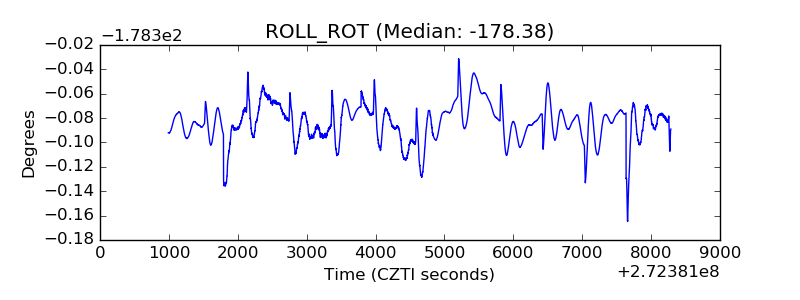 |
| _Roll_DEC | 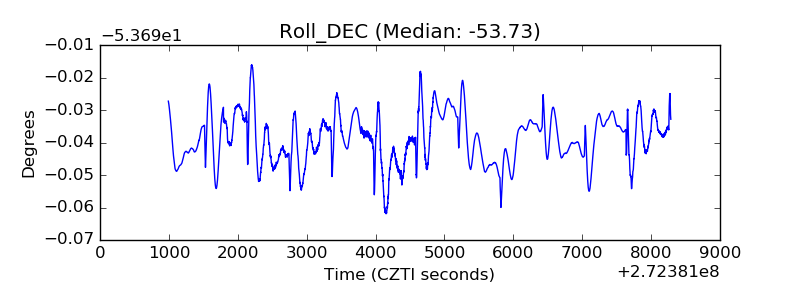 |
| _Roll_RA | 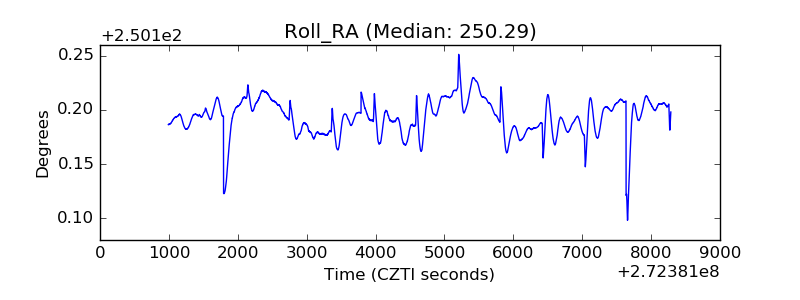 |
| Veto Counter | 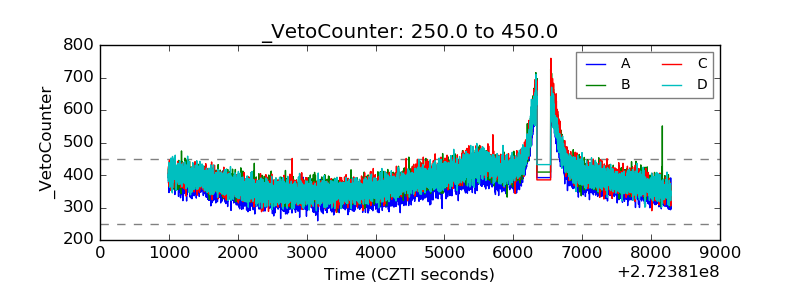 |