| Param | Original file | Final file |
|---|---|---|
| Filename | modeM0/AS1T02_086T01_9000002316_15640cztM0_level2.evt | modeM0/AS1T02_086T01_9000002316_15640cztM0_level2_quad_clean.evt |
| Size (bytes) | 899,475,840 | 177,952,320 |
| Size | 857.8 MB | 169.7 MB |
| Events in quadrant A | 5,954,836 | 1,144,818 |
| Events in quadrant B | 6,146,124 | 1,157,667 |
| Events in quadrant C | 6,275,727 | 1,126,397 |
| Events in quadrant D | 7,989,988 | 1,068,582 |
| Mode SS | |||
|---|---|---|---|
| Quadrant | BADHDUFLAG | Total packets | Discarded packets |
| A | 0 | 262 | 0 |
| B | 0 | 262 | 0 |
| C | 0 | 262 | 0 |
| D | 0 | 262 | 0 |
| Mode M9 | |||
|---|---|---|---|
| Quadrant | BADHDUFLAG | Total packets | Discarded packets |
| A | 0 | 15 | 0 |
| B | 0 | 15 | 0 |
| C | 0 | 15 | 0 |
| D | 0 | 16 | 0 |
| Mode M0 | |||
|---|---|---|---|
| Quadrant | BADHDUFLAG | Total packets | Discarded packets |
| A | 0 | 26519 | 4 |
| B | 0 | 26621 | 3 |
| C | 0 | 26972 | 3 |
| D | 0 | 32627 | 3 |
| Quadrant | Total seconds | Saturated seconds | Saturation percentage |
|---|---|---|---|
| A | 12911 | 64 | 0.495701% |
| B | 12911 | 63 | 0.487956% |
| C | 12911 | 119 | 0.921695% |
| D | 12911 | 591 | 4.577492% |
Noise dominated data is calculated using 1-second bins in cleaned event files. If a bin has >2000 counts, and if more than 50% of those come from <1% of pixels, then it is considered to be noise-dominated and hence unusable.
| Quadrant | # 1 sec bins | Bins with >0 counts | Bins with >2000 counts | High rate bins dominated by noise | Noise dominated (total time) | Noise dominated (detector-on time) | Marked lightcurve |
|---|---|---|---|---|---|---|---|
| A | 14182 | 12913 | 16 | 16 | 0.11% | 0.12% | 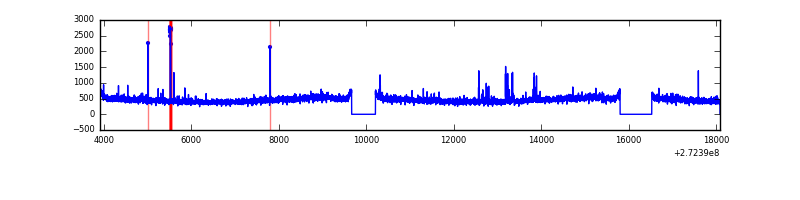 |
| B | 14182 | 12912 | 1 | 1 | 0.01% | 0.01% | 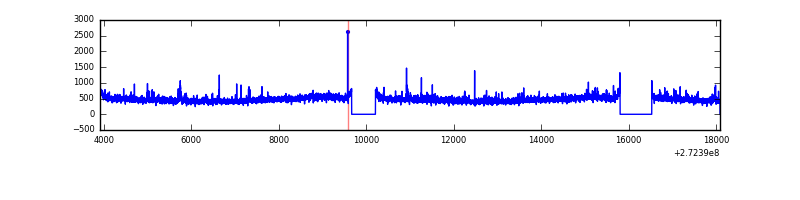 |
| C | 14182 | 12912 | 4 | 4 | 0.03% | 0.03% | 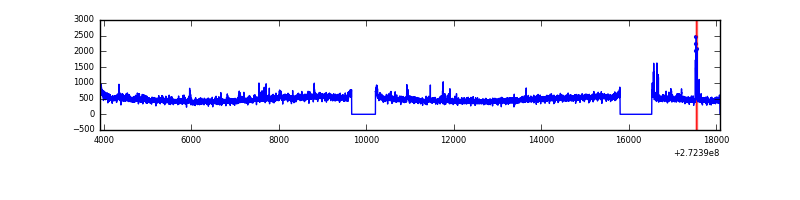 |
| D | 14182 | 12913 | 458 | 458 | 3.23% | 3.55% | 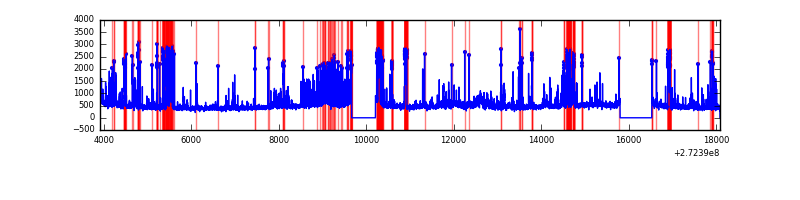 |
Top three noisy pixels from each quadrant. If the there are fewer than three noisy pixels in the level2.evt file, extra rows are filled as -1
| Pixel properties | Quadrant properties | ||||||
|---|---|---|---|---|---|---|---|
| Quadrant | DetID | PixID | Counts | Sigma | Mean | Median | Sigma |
| A | 4 | 2 | 59530 | 192.8 | 1509 | 1478 | 301.1 |
| A | 15 | 223 | 32210 | 102.07 | 1509 | 1478 | 301.1 |
| A | 3 | 80 | 20514 | 63.22 | 1509 | 1478 | 301.1 |
| B | 0 | 189 | 41918 | 139.9 | 1512 | 1471 | 289.1 |
| B | 12 | 111 | 33481 | 110.72 | 1512 | 1471 | 289.1 |
| B | 4 | 173 | 32623 | 107.75 | 1512 | 1471 | 289.1 |
| C | 3 | 233 | 378387 | 1110.04 | 1442 | 1452 | 339.6 |
| C | 14 | 238 | 223687 | 654.46 | 1442 | 1452 | 339.6 |
| C | 10 | 22 | 44961 | 128.13 | 1442 | 1452 | 339.6 |
| D | 1 | 52 | 2244363 | 6433.18 | 1427 | 1384 | 348.7 |
| D | 4 | 239 | 52203 | 145.76 | 1427 | 1384 | 348.7 |
| D | 2 | 234 | 52075 | 145.39 | 1427 | 1384 | 348.7 |
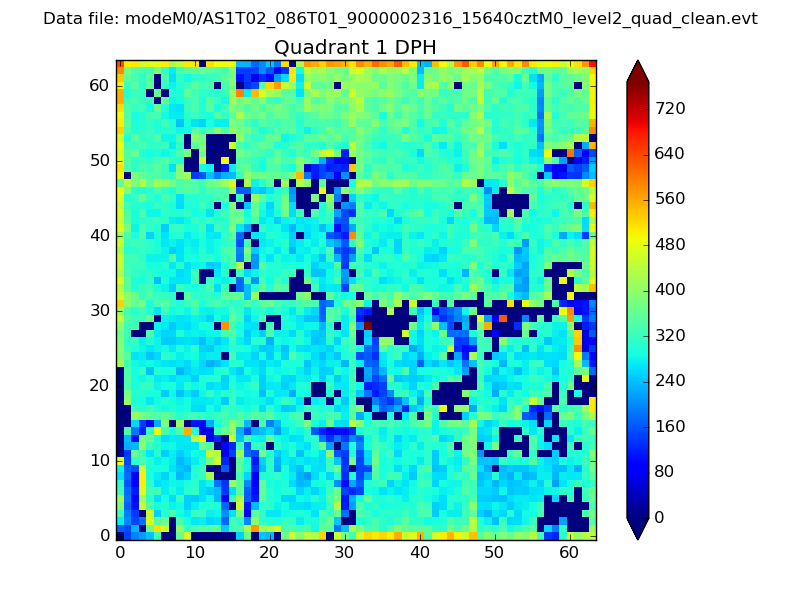
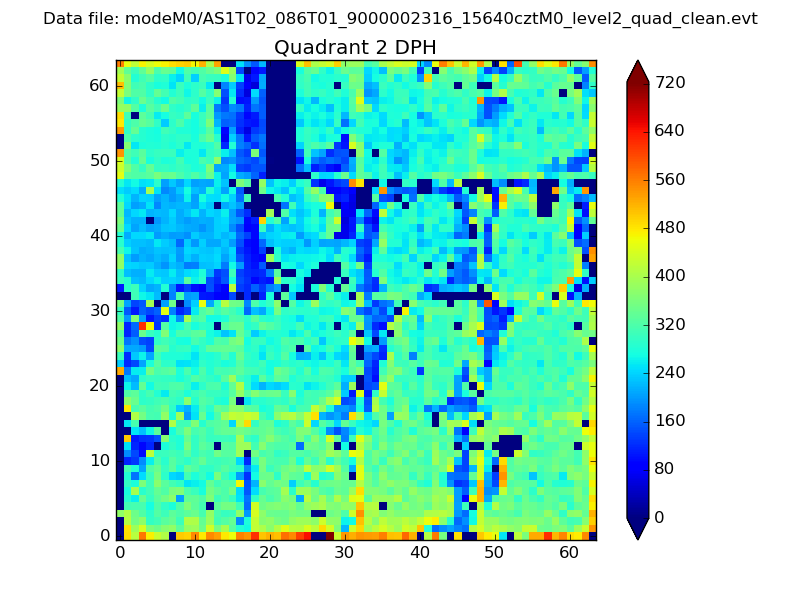
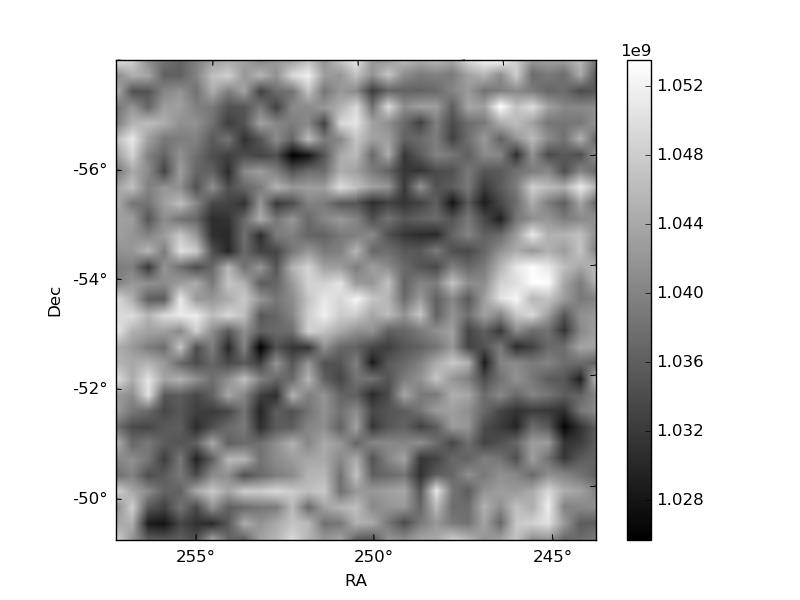
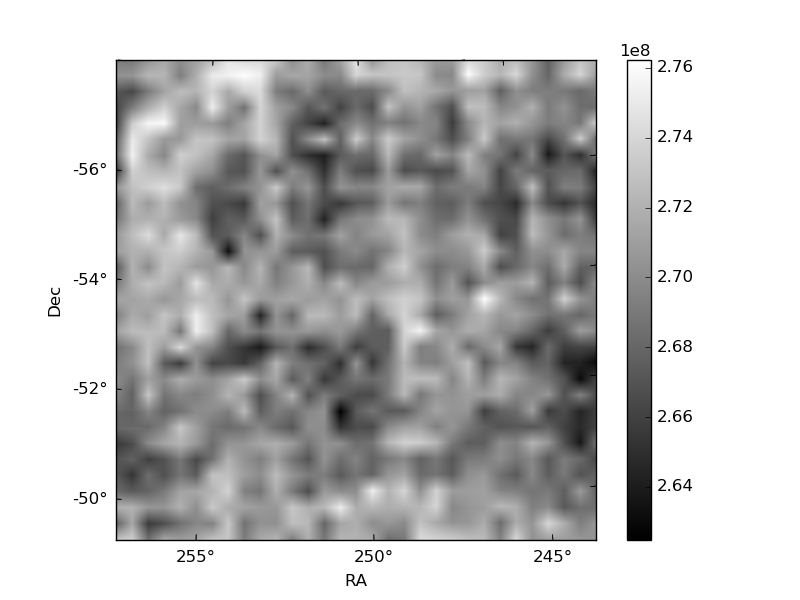
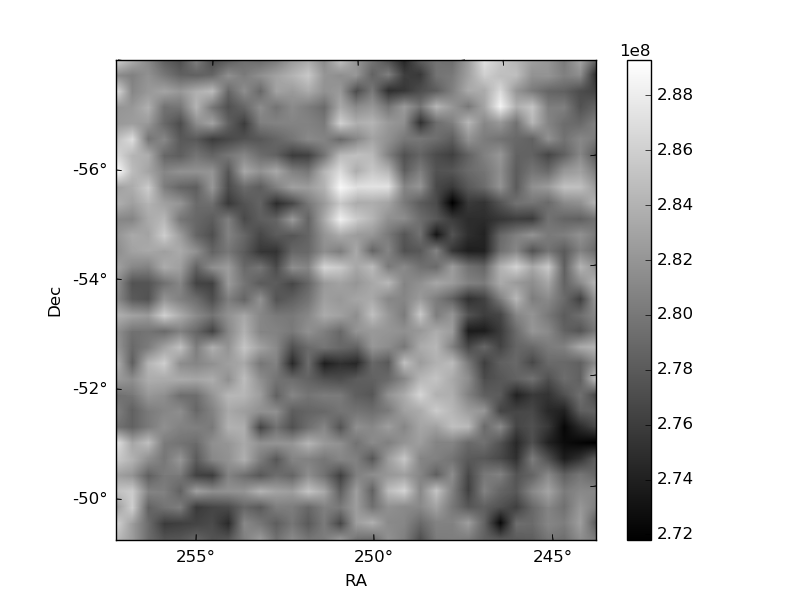
Histogram calculated using DETX and DETY for each event in the final _common_clean file
| Quadrant A |  |
 |
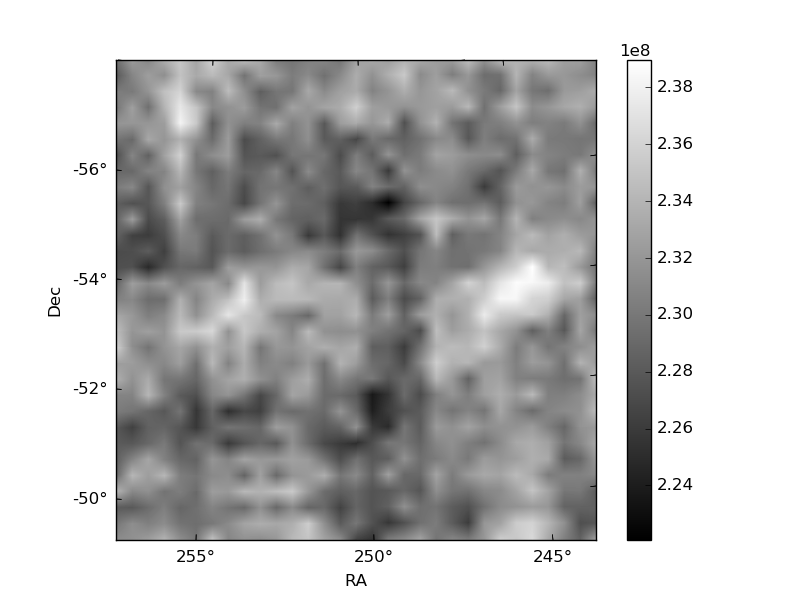
Quadrant B |
|---|---|---|---|
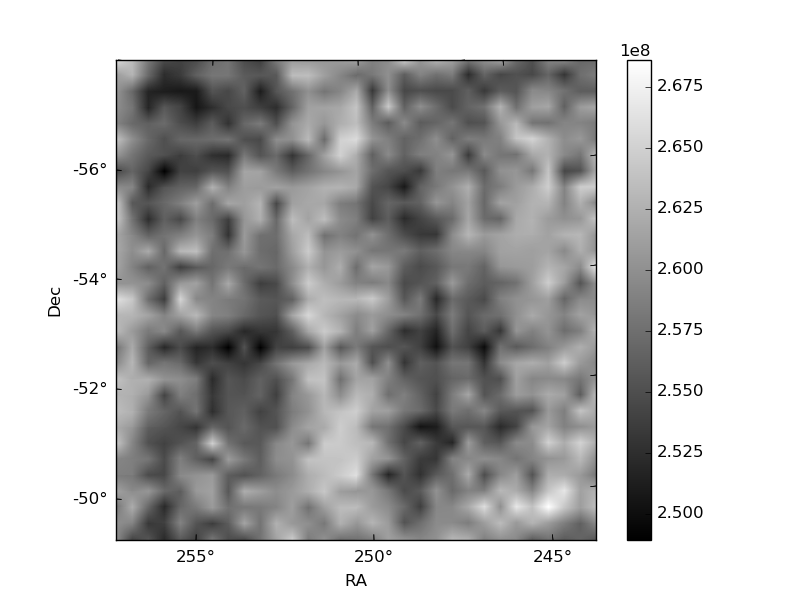
| Quadrant D | 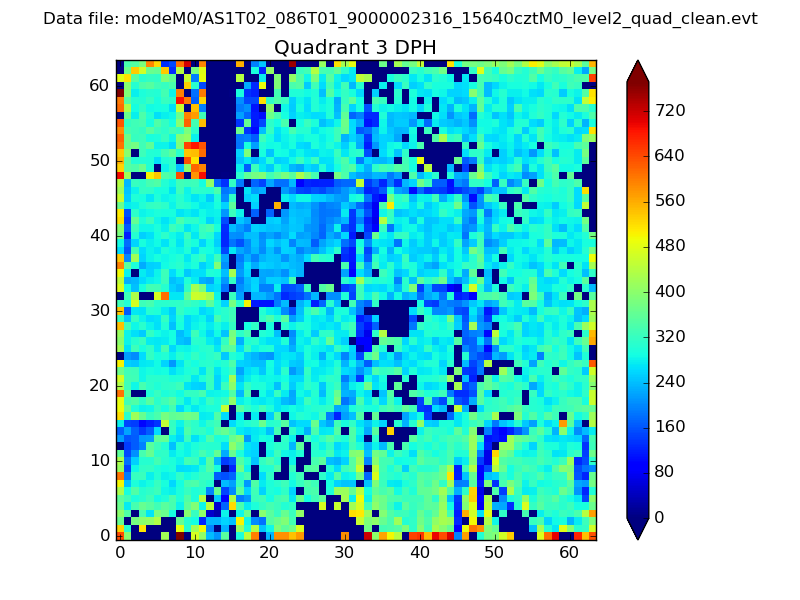 |
 |
Quadrant C |
| Plot type | Count rate plots | Images |
|---|---|---|
| Comparison with Poisson distribution Blue bars denote a histogram of data divided into 1 sec bins. Red curve is a Poisson curve with rate = median count rate of data. |
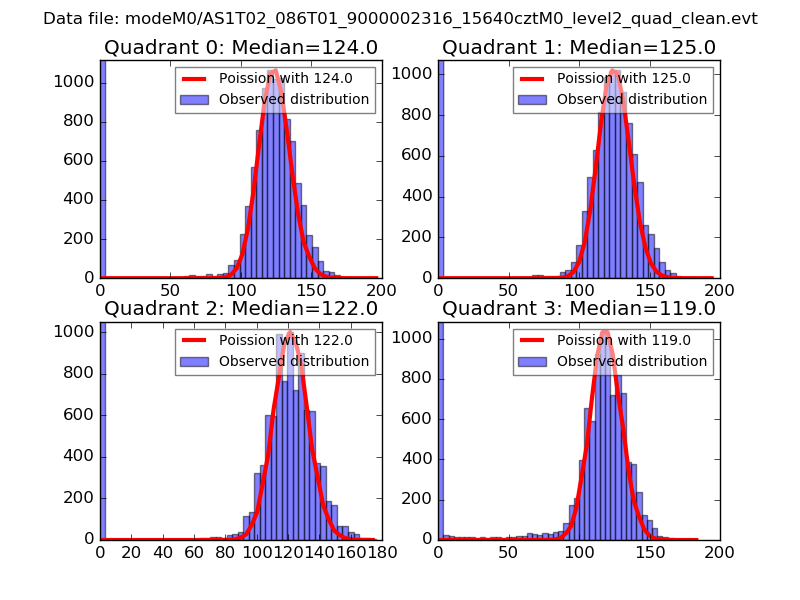 |
 |
| Quadrant-wise count rates Data is divided into 100 sec bins |
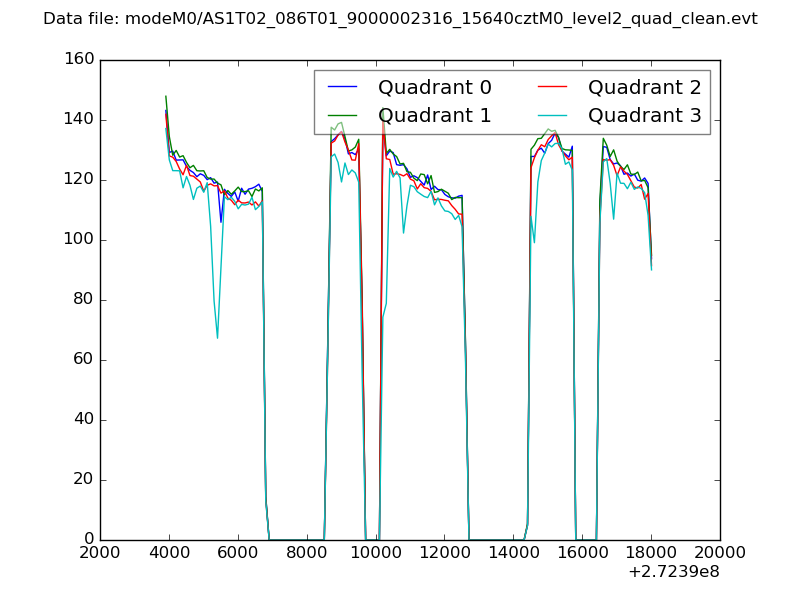 |
|
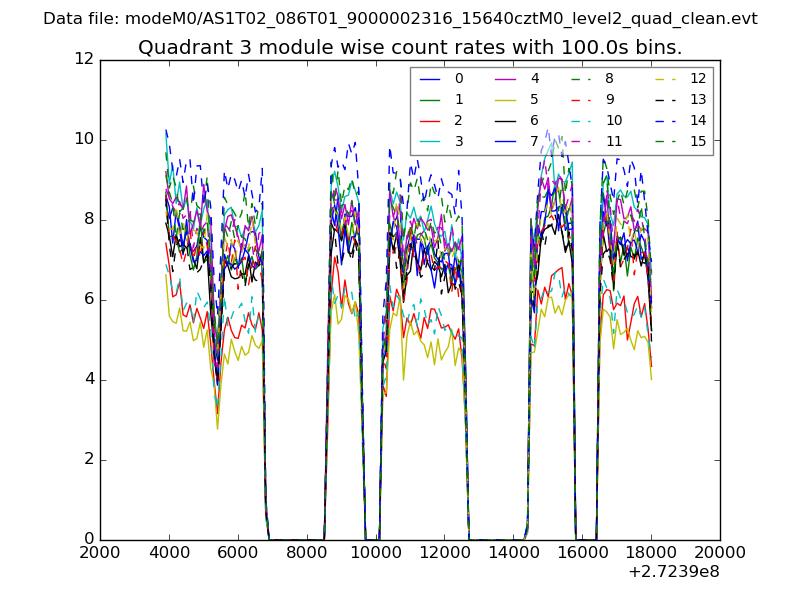
| Module-wise count rates for Quadrant A Data is divided into 100 sec bins |
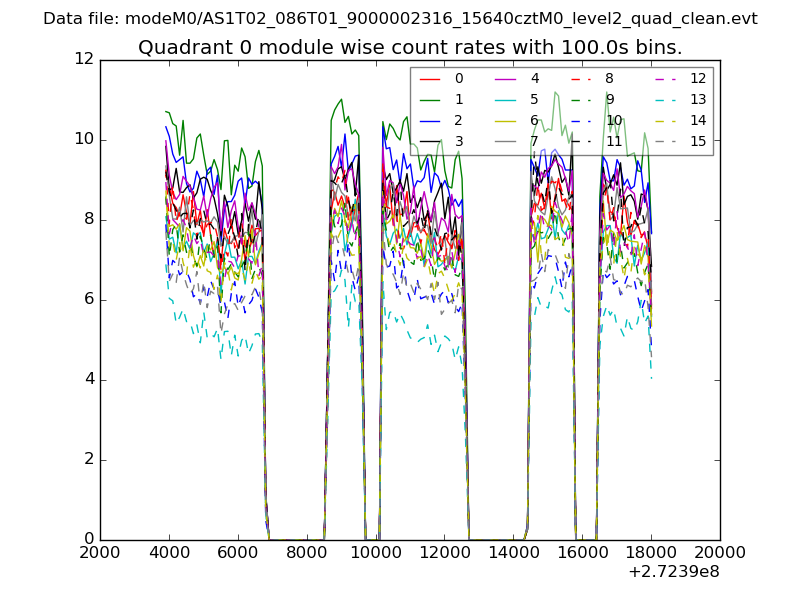 |
 |
| Module-wise count rates for Quadrant B Data is divided into 100 sec bins |
 |
 |
| Module-wise count rates for Quadrant C Data is divided into 100 sec bins |
 |
 |
| Module-wise count rates for Quadrant D Data is divided into 100 sec bins |
 |
 |
| Parameter | Plot |
|---|---|
| CZT HV Monitor |  |
| D_VDD | 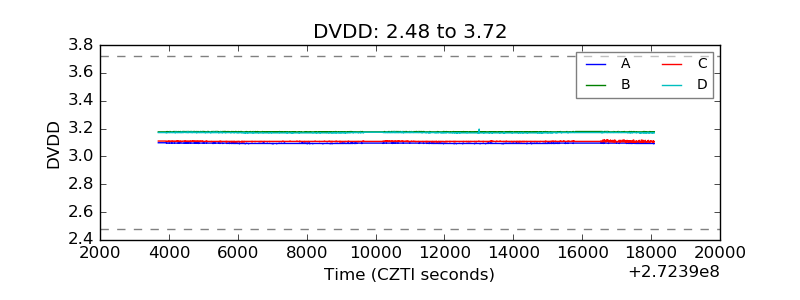 |
| Temperature 1 | 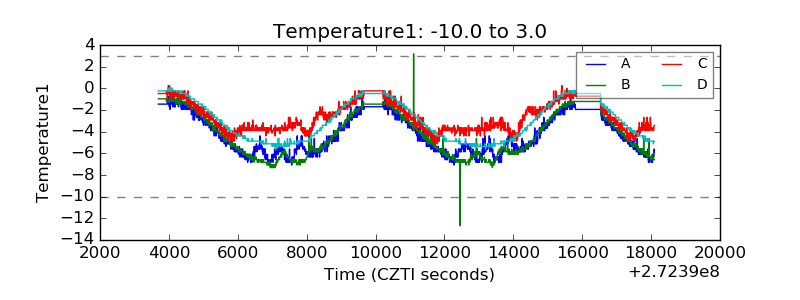 |
| Veto HV Monitor | 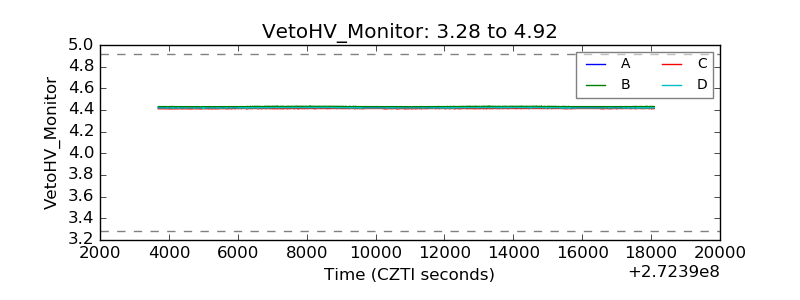 |
| Veto LLD | 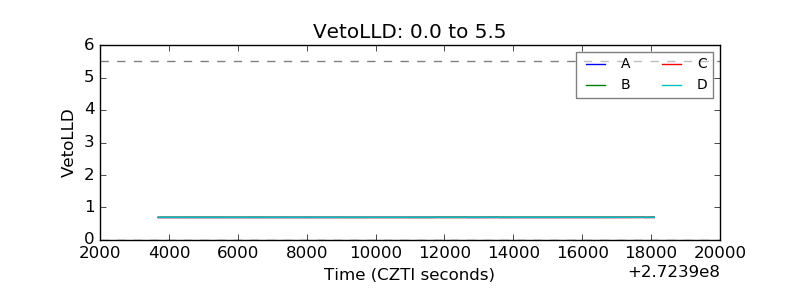 |
| Alpha Counter | 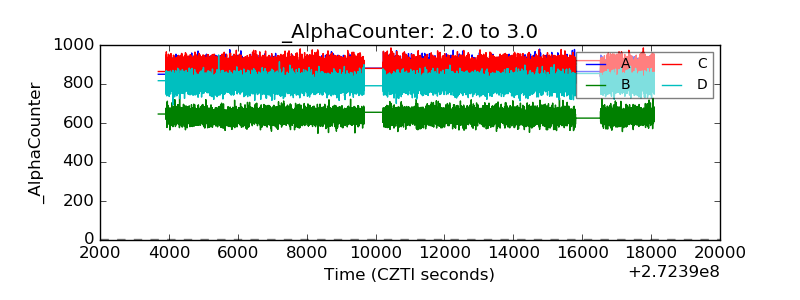 |
| _CPM_Rate | 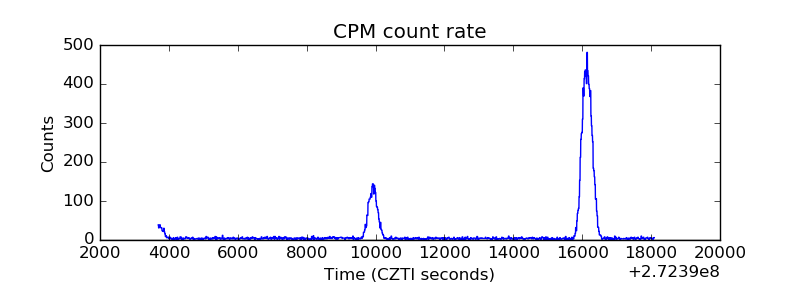 |
| CZT Counter | 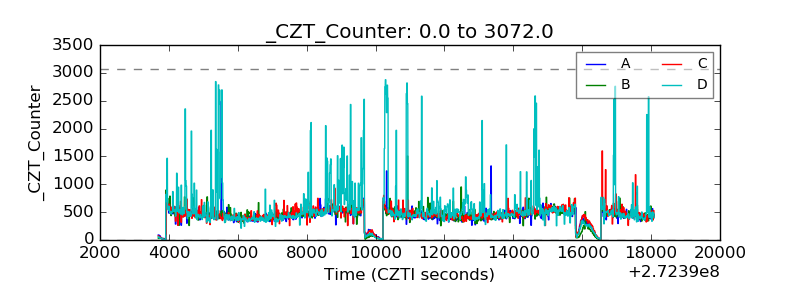 |
| +2.5 Volts monitor |  |
| +5 Volts monitor | 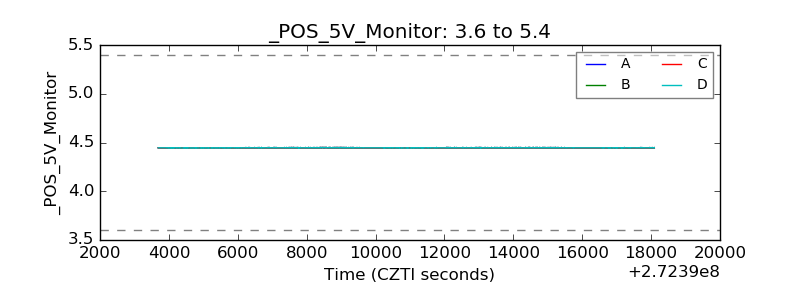 |
| _ROLL_ROT | 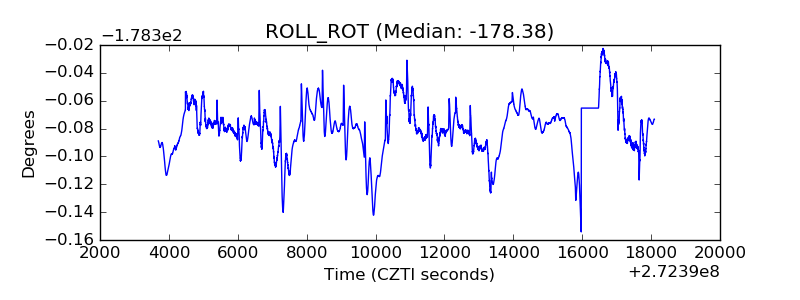 |
| _Roll_DEC | 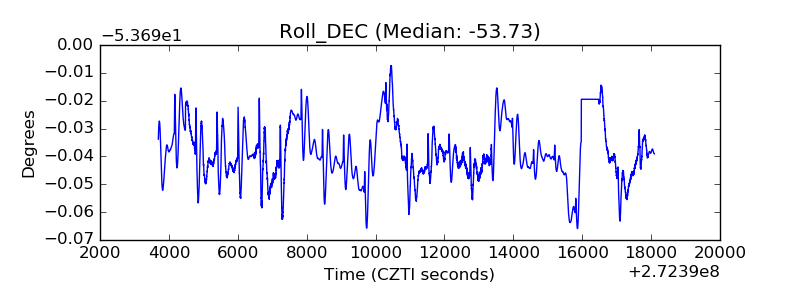 |
| _Roll_RA | 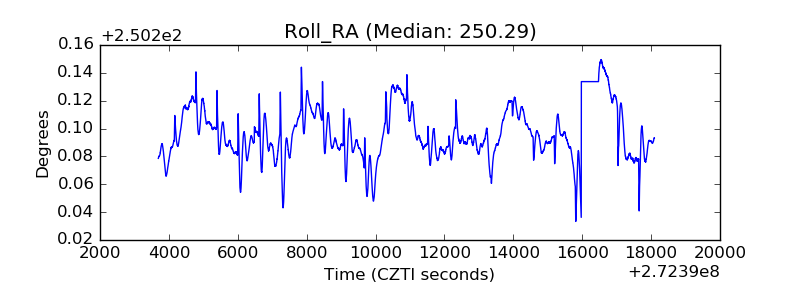 |
| Veto Counter | 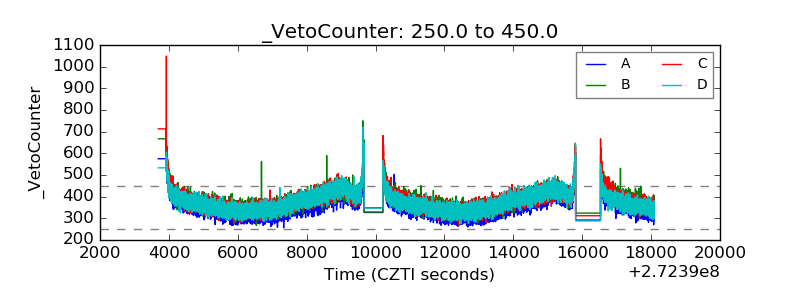 |