| Param | Original file | Final file |
|---|---|---|
| Filename | modeM0/AS1T02_086T01_9000002316_15642cztM0_level2.evt | modeM0/AS1T02_086T01_9000002316_15642cztM0_level2_quad_clean.evt |
| Size (bytes) | 453,052,800 | 93,015,360 |
| Size | 432.1 MB | 88.7 MB |
| Events in quadrant A | 3,422,920 | 590,965 |
| Events in quadrant B | 3,206,832 | 604,817 |
| Events in quadrant C | 3,255,221 | 587,126 |
| Events in quadrant D | 3,385,805 | 572,184 |
| Mode SS | |||
|---|---|---|---|
| Quadrant | BADHDUFLAG | Total packets | Discarded packets |
| A | 0 | 134 | 0 |
| B | 0 | 134 | 0 |
| C | 0 | 134 | 0 |
| D | 0 | 134 | 0 |
| Mode M9 | |||
|---|---|---|---|
| Quadrant | BADHDUFLAG | Total packets | Discarded packets |
| A | 0 | 15 | 0 |
| B | 0 | 15 | 0 |
| C | 0 | 15 | 0 |
| D | 0 | 16 | 0 |
| Mode M0 | |||
|---|---|---|---|
| Quadrant | BADHDUFLAG | Total packets | Discarded packets |
| A | 0 | 14531 | 3 |
| B | 0 | 13799 | 2 |
| C | 0 | 13713 | 2 |
| D | 0 | 14671 | 2 |
| Quadrant | Total seconds | Saturated seconds | Saturation percentage |
|---|---|---|---|
| A | 6624 | 74 | 1.117150% |
| B | 6624 | 41 | 0.618961% |
| C | 6624 | 52 | 0.785024% |
| D | 6624 | 78 | 1.177536% |
Noise dominated data is calculated using 1-second bins in cleaned event files. If a bin has >2000 counts, and if more than 50% of those come from <1% of pixels, then it is considered to be noise-dominated and hence unusable.
| Quadrant | # 1 sec bins | Bins with >0 counts | Bins with >2000 counts | High rate bins dominated by noise | Noise dominated (total time) | Noise dominated (detector-on time) | Marked lightcurve |
|---|---|---|---|---|---|---|---|
| A | 7655 | 6625 | 38 | 38 | 0.50% | 0.57% | 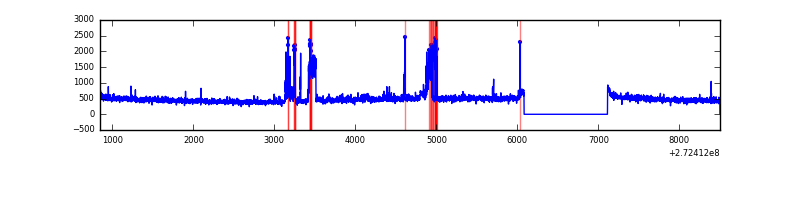 |
| B | 7655 | 6625 | 0 | 0 | 0.00% | 0.00% | 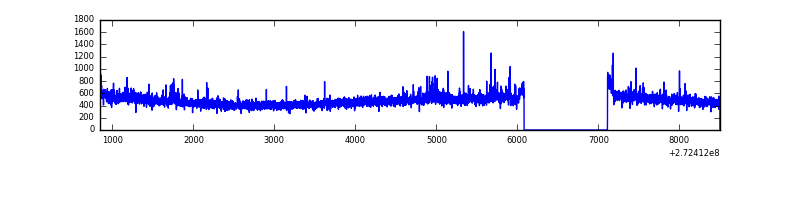 |
| C | 7655 | 6625 | 0 | 0 | 0.00% | 0.00% | 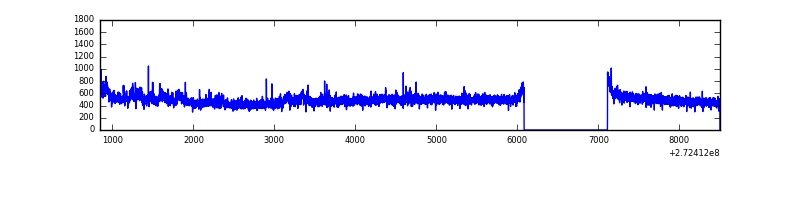 |
| D | 7655 | 6625 | 61 | 61 | 0.80% | 0.92% | 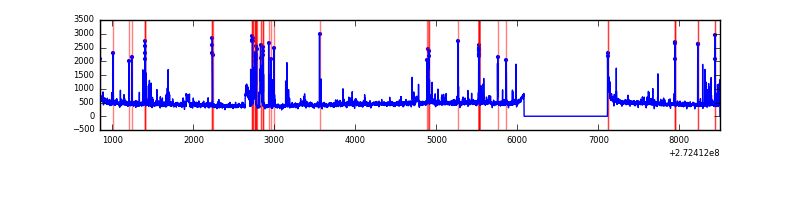 |
Top three noisy pixels from each quadrant. If the there are fewer than three noisy pixels in the level2.evt file, extra rows are filled as -1
| Pixel properties | Quadrant properties | ||||||
|---|---|---|---|---|---|---|---|
| Quadrant | DetID | PixID | Counts | Sigma | Mean | Median | Sigma |
| A | 15 | 157 | 387207 | 2440.26 | 783 | 768 | 158.4 |
| A | 3 | 80 | 17317 | 104.5 | 783 | 768 | 158.4 |
| A | 0 | 226 | 6966 | 39.14 | 783 | 768 | 158.4 |
| B | 0 | 189 | 46001 | 300.54 | 791 | 773 | 150.5 |
| B | 12 | 111 | 17401 | 110.49 | 791 | 773 | 150.5 |
| B | 3 | 209 | 16399 | 103.84 | 791 | 773 | 150.5 |
| C | 3 | 233 | 144711 | 819.63 | 757 | 764 | 175.6 |
| C | 14 | 238 | 117566 | 665.07 | 757 | 764 | 175.6 |
| C | 0 | 207 | 26933 | 149.01 | 757 | 764 | 175.6 |
| D | 1 | 52 | 269488 | 1463.28 | 759 | 737 | 183.7 |
| D | 2 | 16 | 113708 | 615.1 | 759 | 737 | 183.7 |
| D | 2 | 234 | 25754 | 136.21 | 759 | 737 | 183.7 |
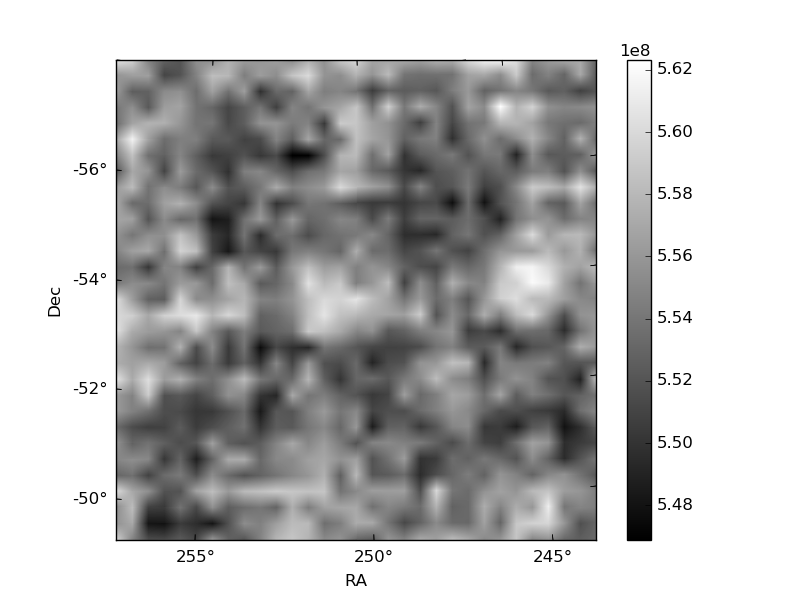
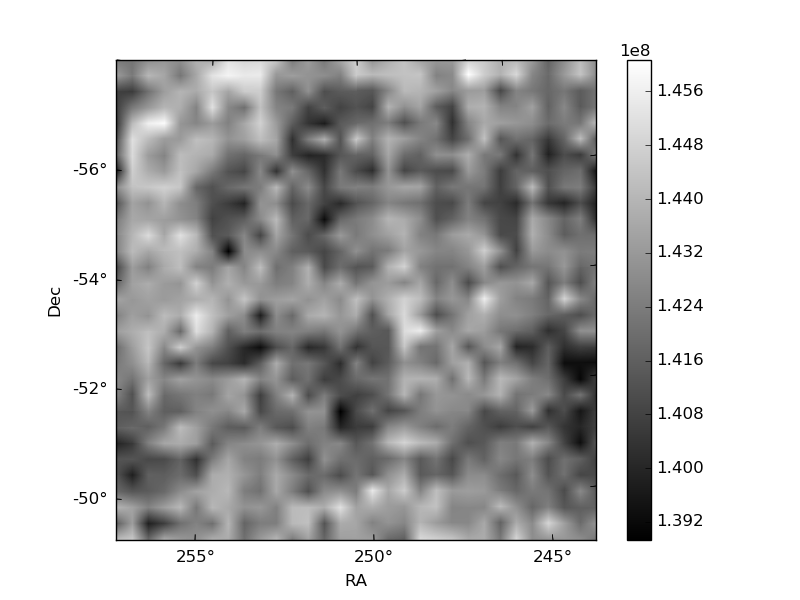
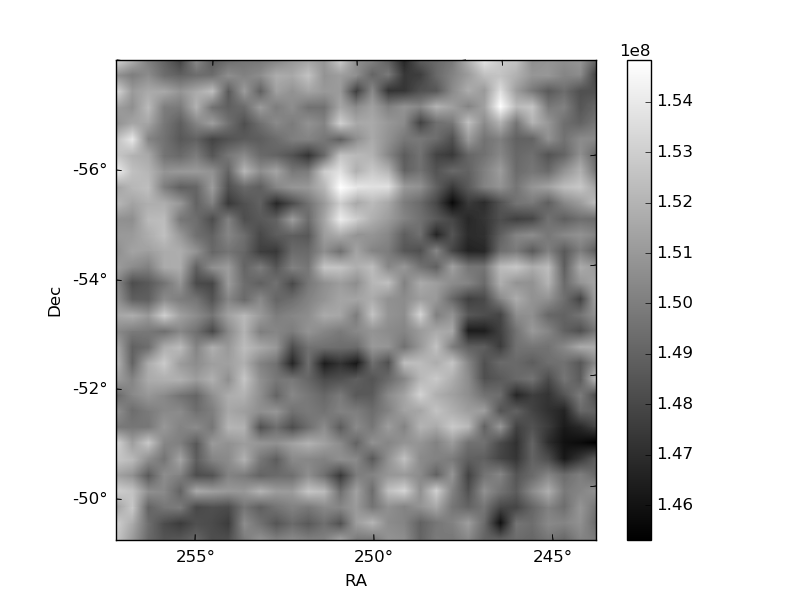
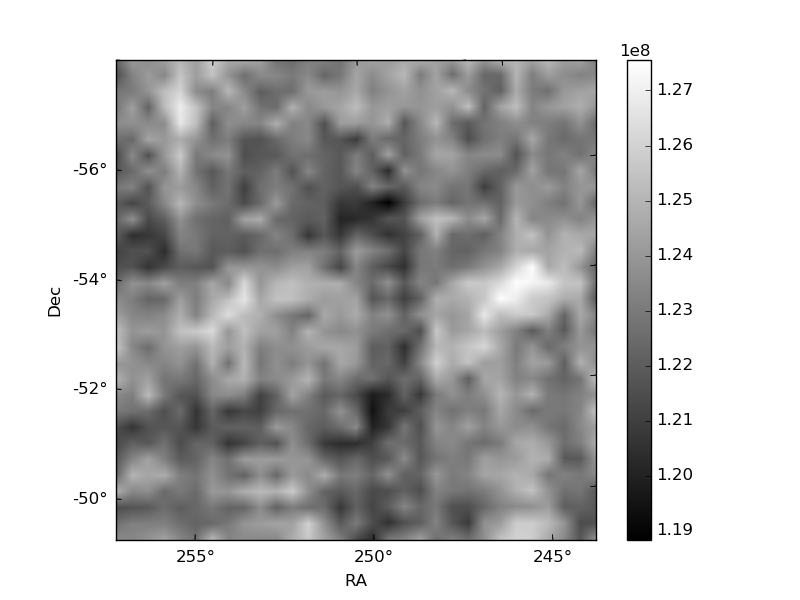
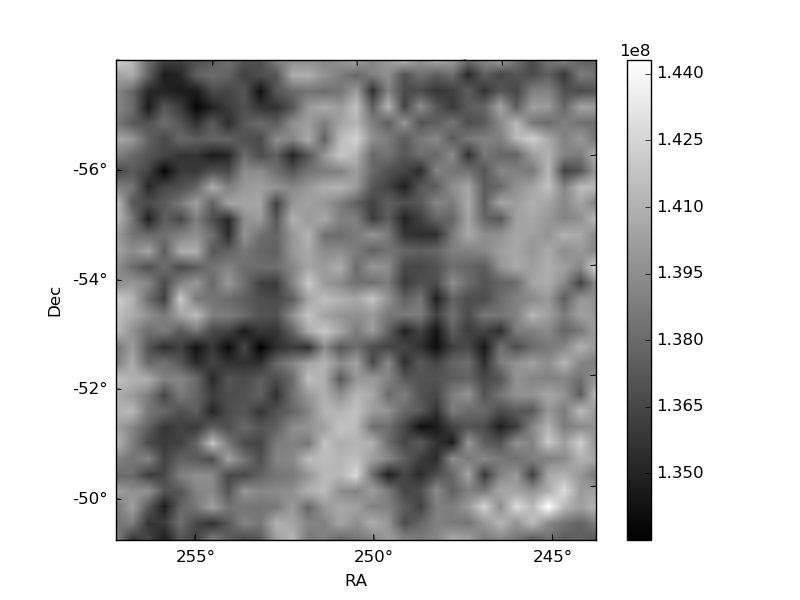
Histogram calculated using DETX and DETY for each event in the final _common_clean file
| Quadrant A | 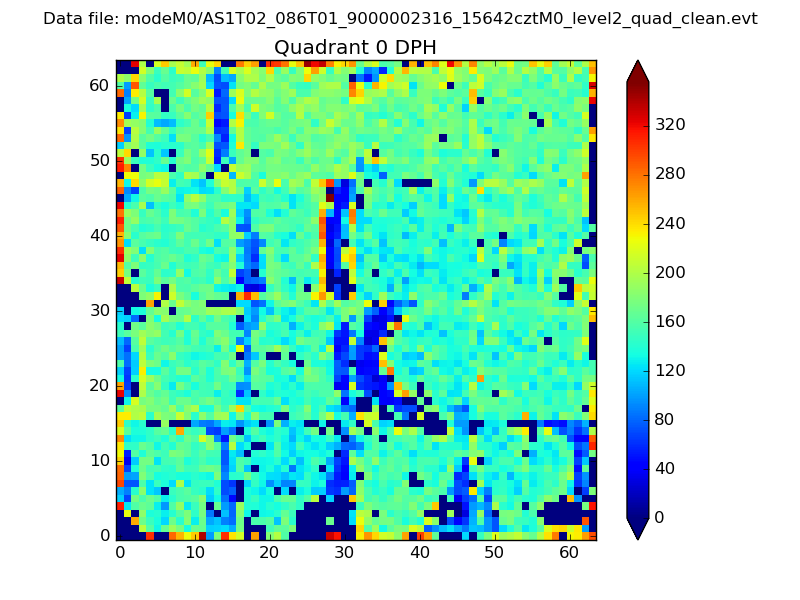 |
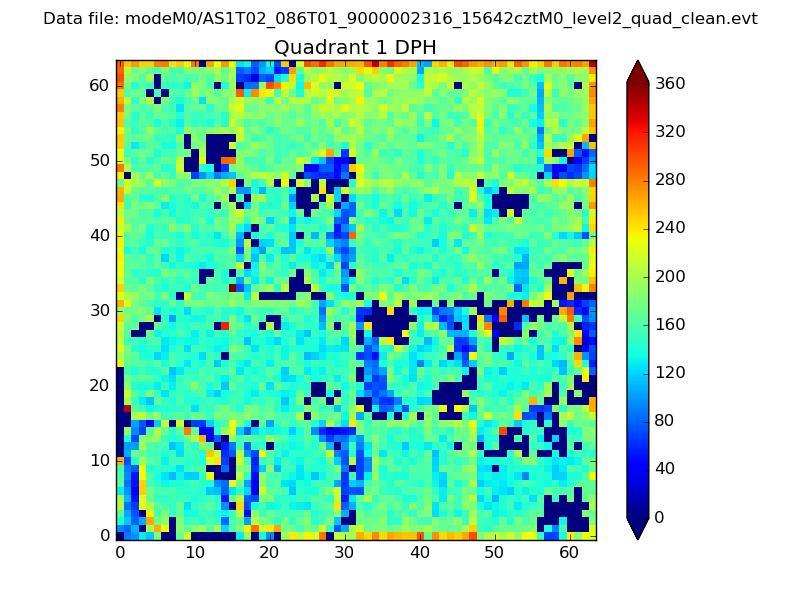 |
Quadrant B |
|---|---|---|---|
| Quadrant D | 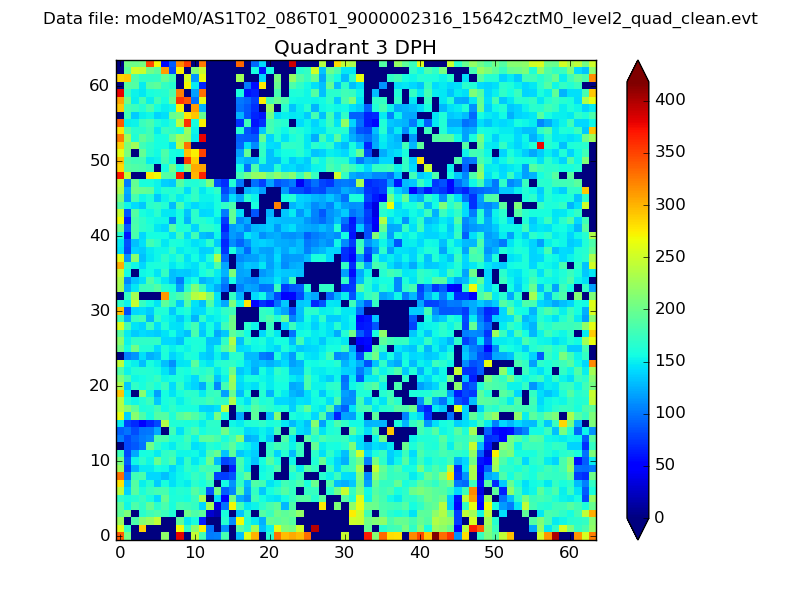 |
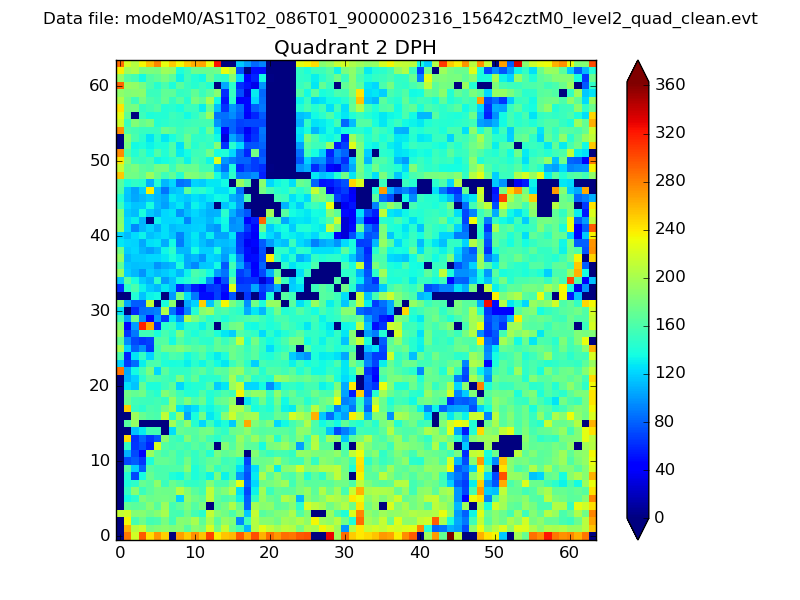 |
Quadrant C |
| Plot type | Count rate plots | Images |
|---|---|---|
| Comparison with Poisson distribution Blue bars denote a histogram of data divided into 1 sec bins. Red curve is a Poisson curve with rate = median count rate of data. |
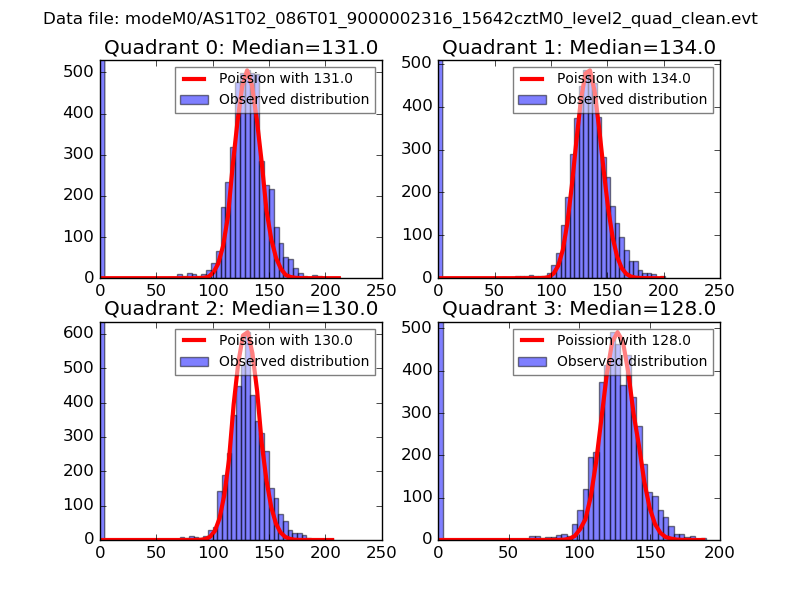 |
 |
| Quadrant-wise count rates Data is divided into 100 sec bins |
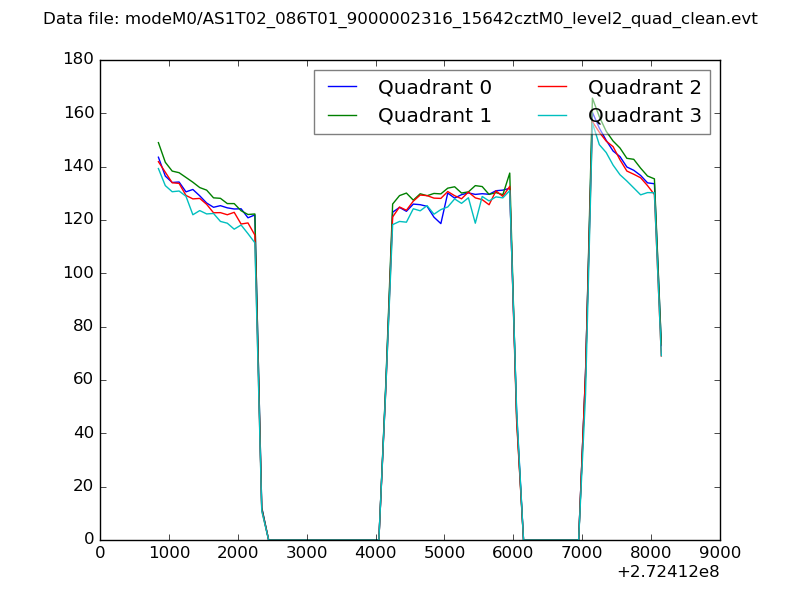 |
|
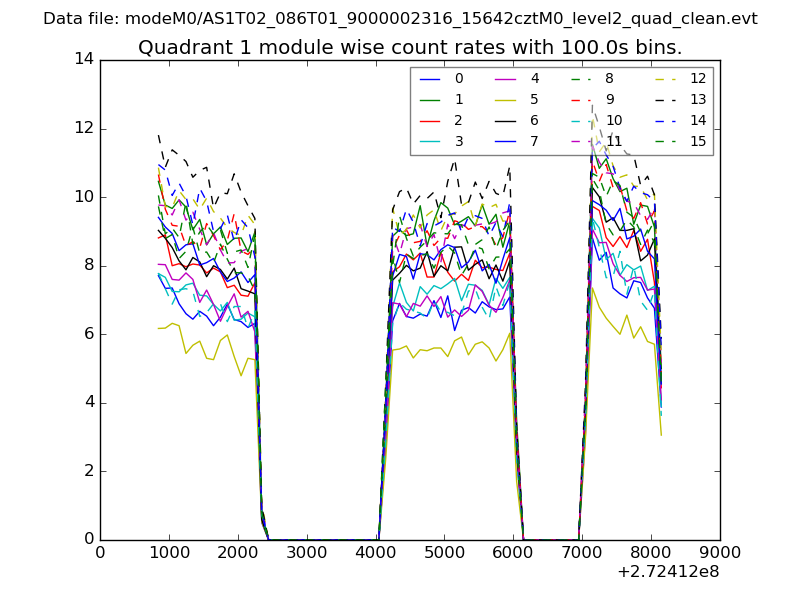
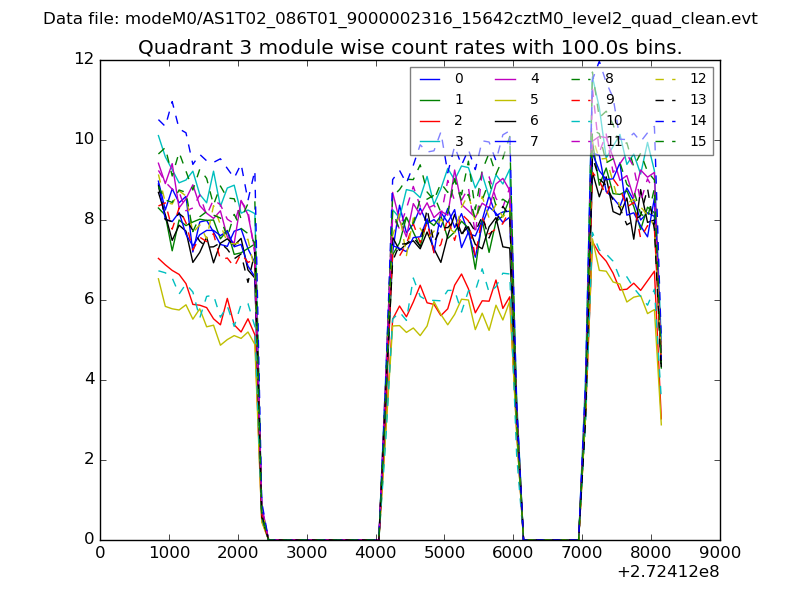
| Module-wise count rates for Quadrant A Data is divided into 100 sec bins |
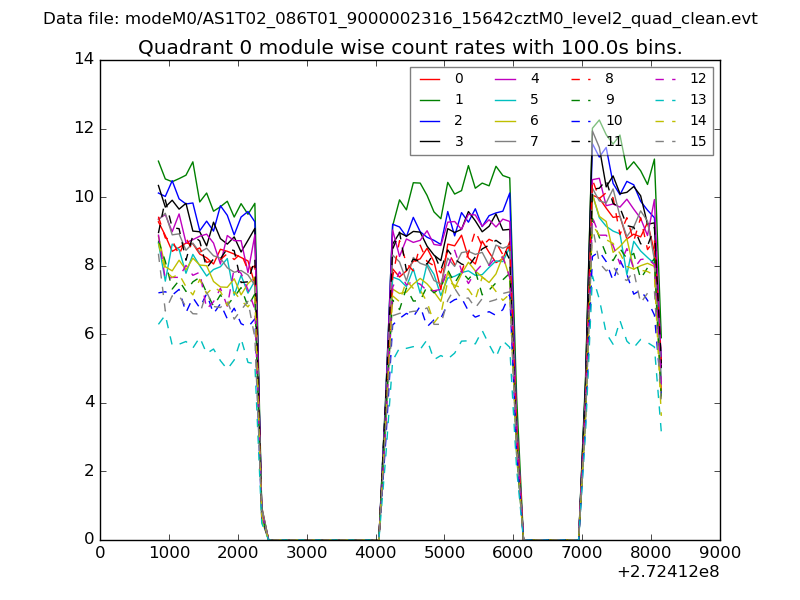 |
 |
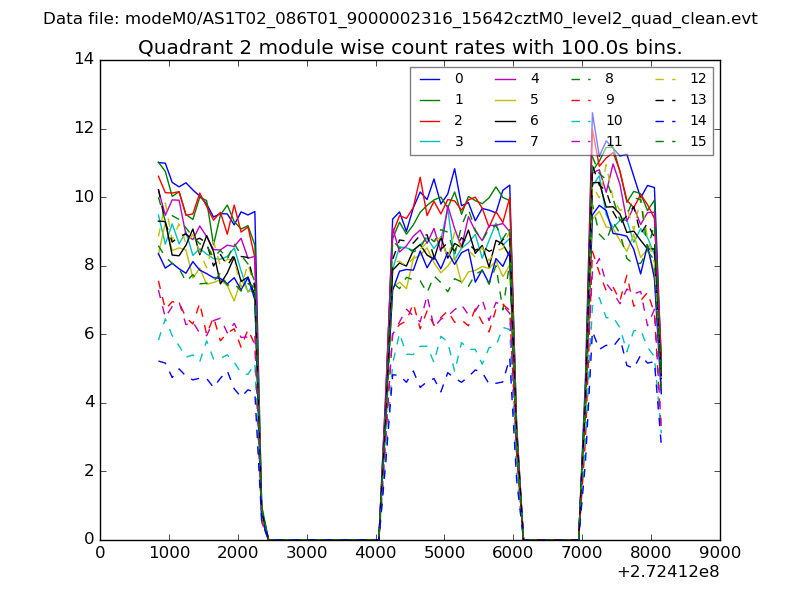
| Module-wise count rates for Quadrant B Data is divided into 100 sec bins |
 |
 |
| Module-wise count rates for Quadrant C Data is divided into 100 sec bins |
 |
 |
| Module-wise count rates for Quadrant D Data is divided into 100 sec bins |
 |
 |
| Parameter | Plot |
|---|---|
| CZT HV Monitor | 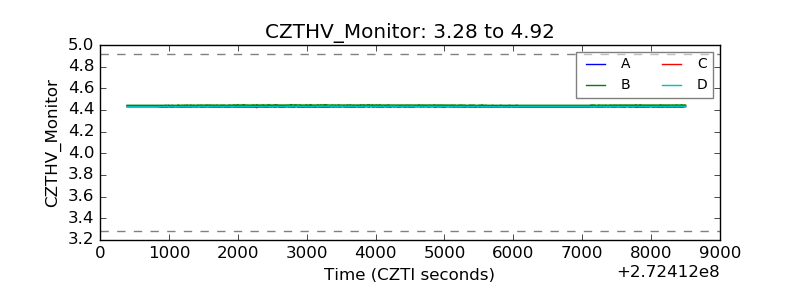 |
| D_VDD | 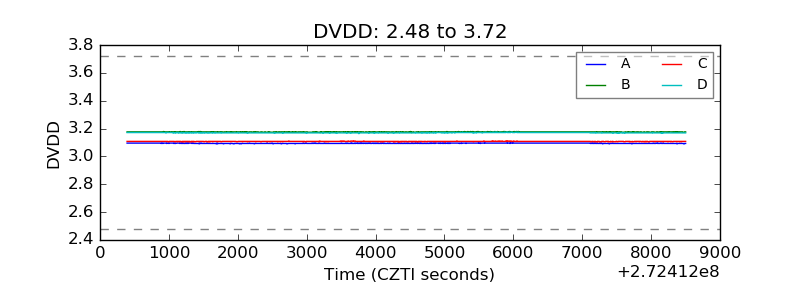 |
| Temperature 1 | 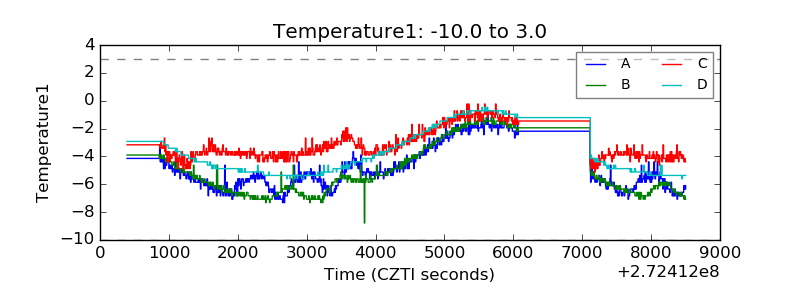 |
| Veto HV Monitor | 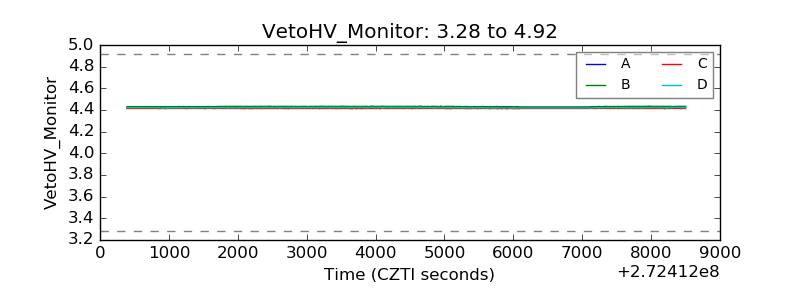 |
| Veto LLD | 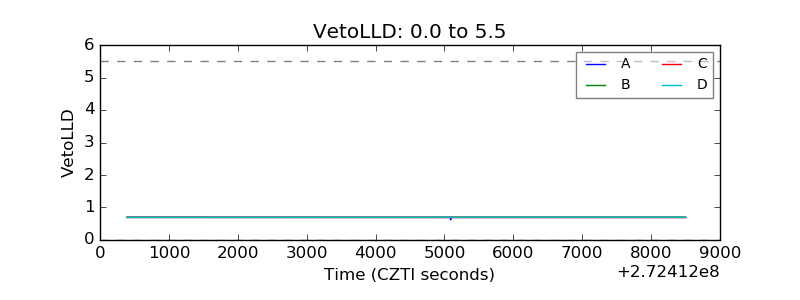 |
| Alpha Counter | 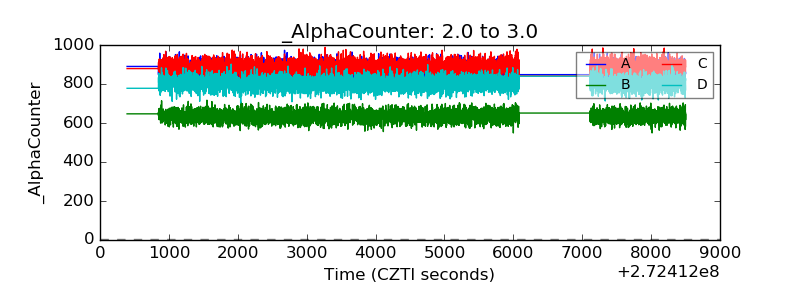 |
| _CPM_Rate | 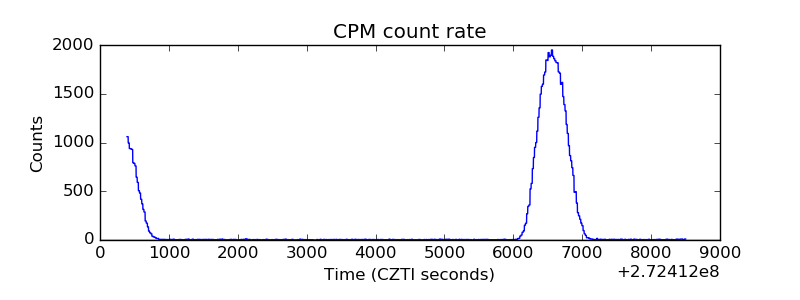 |
| CZT Counter | 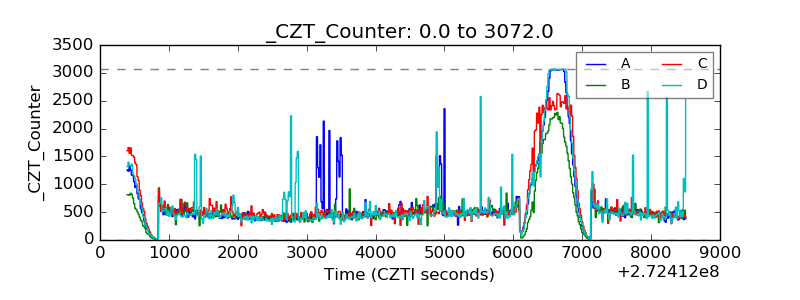 |
| +2.5 Volts monitor |  |
| +5 Volts monitor | 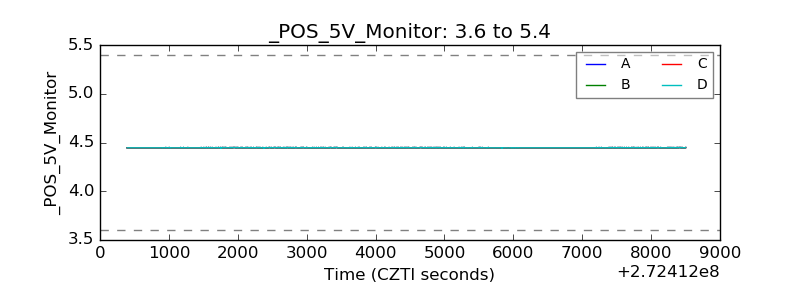 |
| _ROLL_ROT | 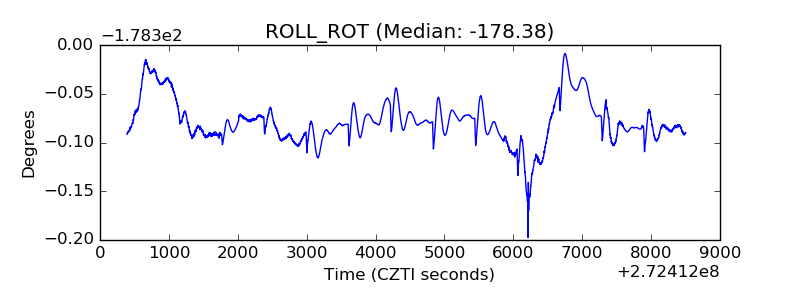 |
| _Roll_DEC | 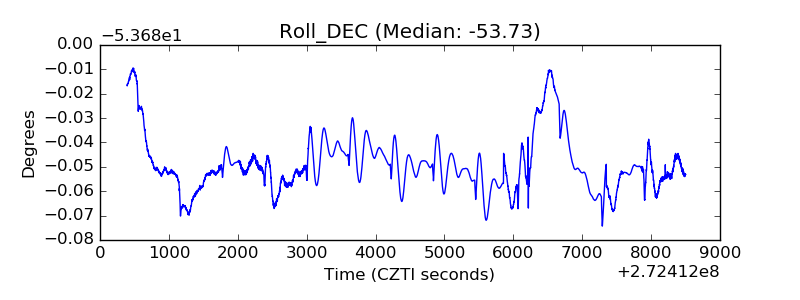 |
| _Roll_RA | 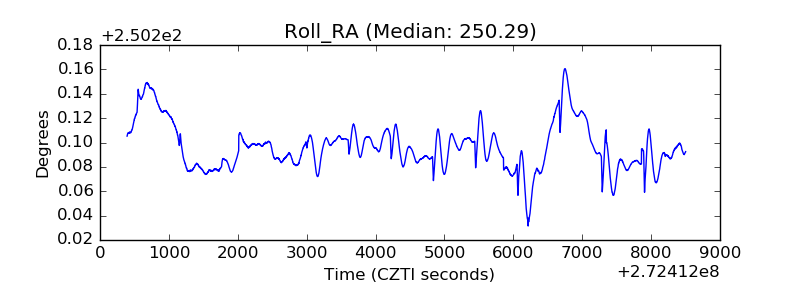 |
| Veto Counter | 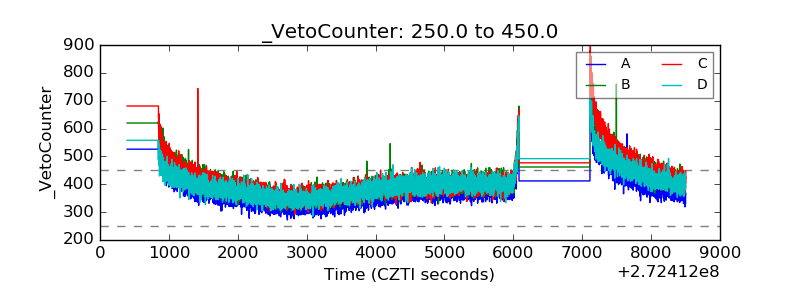 |