| Param | Original file | Final file |
|---|---|---|
| Filename | modeM0/AS1T02_086T01_9000002316_15645cztM0_level2.evt | modeM0/AS1T02_086T01_9000002316_15645cztM0_level2_quad_clean.evt |
| Size (bytes) | 448,966,080 | 74,502,720 |
| Size | 428.2 MB | 71.1 MB |
| Events in quadrant A | 3,285,634 | 453,545 |
| Events in quadrant B | 3,184,005 | 465,275 |
| Events in quadrant C | 3,222,477 | 454,387 |
| Events in quadrant D | 3,479,938 | 446,212 |
| Mode SS | |||
|---|---|---|---|
| Quadrant | BADHDUFLAG | Total packets | Discarded packets |
| A | 0 | 126 | 0 |
| B | 0 | 126 | 0 |
| C | 0 | 126 | 0 |
| D | 0 | 126 | 0 |
| Mode M9 | |||
|---|---|---|---|
| Quadrant | BADHDUFLAG | Total packets | Discarded packets |
| A | 0 | 13 | 0 |
| B | 0 | 13 | 0 |
| C | 0 | 13 | 0 |
| D | 0 | 13 | 0 |
| Mode M0 | |||
|---|---|---|---|
| Quadrant | BADHDUFLAG | Total packets | Discarded packets |
| A | 0 | 13715 | 2 |
| B | 0 | 13158 | 1 |
| C | 0 | 13234 | 1 |
| D | 0 | 14336 | 1 |
| Quadrant | Total seconds | Saturated seconds | Saturation percentage |
|---|---|---|---|
| A | 6259 | 49 | 0.782873% |
| B | 6259 | 56 | 0.894712% |
| C | 6259 | 116 | 1.853331% |
| D | 6259 | 102 | 1.629653% |
Noise dominated data is calculated using 1-second bins in cleaned event files. If a bin has >2000 counts, and if more than 50% of those come from <1% of pixels, then it is considered to be noise-dominated and hence unusable.
| Quadrant | # 1 sec bins | Bins with >0 counts | Bins with >2000 counts | High rate bins dominated by noise | Noise dominated (total time) | Noise dominated (detector-on time) | Marked lightcurve |
|---|---|---|---|---|---|---|---|
| A | 7510 | 6260 | 3 | 3 | 0.04% | 0.05% | 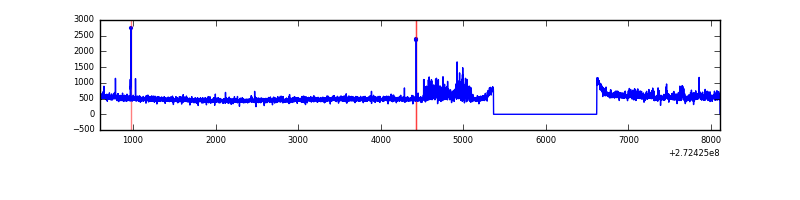 |
| B | 7510 | 6260 | 0 | 0 | 0.00% | 0.00% | 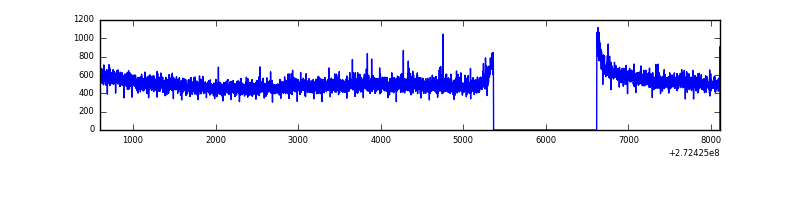 |
| C | 7510 | 6260 | 2 | 2 | 0.03% | 0.03% | 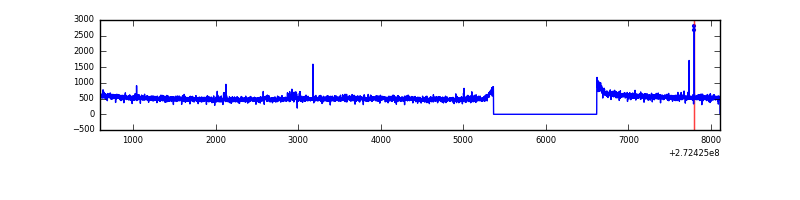 |
| D | 7510 | 6260 | 63 | 63 | 0.84% | 1.01% | 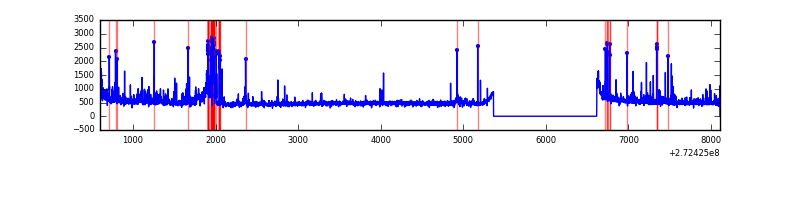 |
Top three noisy pixels from each quadrant. If the there are fewer than three noisy pixels in the level2.evt file, extra rows are filled as -1
| Pixel properties | Quadrant properties | ||||||
|---|---|---|---|---|---|---|---|
| Quadrant | DetID | PixID | Counts | Sigma | Mean | Median | Sigma |
| A | 15 | 249 | 191284 | 1192.29 | 799 | 783 | 159.8 |
| A | 15 | 157 | 8299 | 47.04 | 799 | 783 | 159.8 |
| A | 15 | 69 | 7607 | 42.71 | 799 | 783 | 159.8 |
| B | 0 | 214 | 21147 | 134.73 | 806 | 785 | 151.1 |
| B | 12 | 111 | 16879 | 106.49 | 806 | 785 | 151.1 |
| B | 11 | 111 | 14397 | 90.07 | 806 | 785 | 151.1 |
| C | 14 | 238 | 134833 | 751.19 | 781 | 789 | 178.4 |
| C | 3 | 233 | 14871 | 78.92 | 781 | 789 | 178.4 |
| C | 14 | 225 | 11648 | 60.85 | 781 | 789 | 178.4 |
| D | 1 | 52 | 501841 | 2669.46 | 784 | 760 | 187.7 |
| D | 2 | 234 | 23561 | 121.47 | 784 | 760 | 187.7 |
| D | 10 | 40 | 9851 | 48.43 | 784 | 760 | 187.7 |
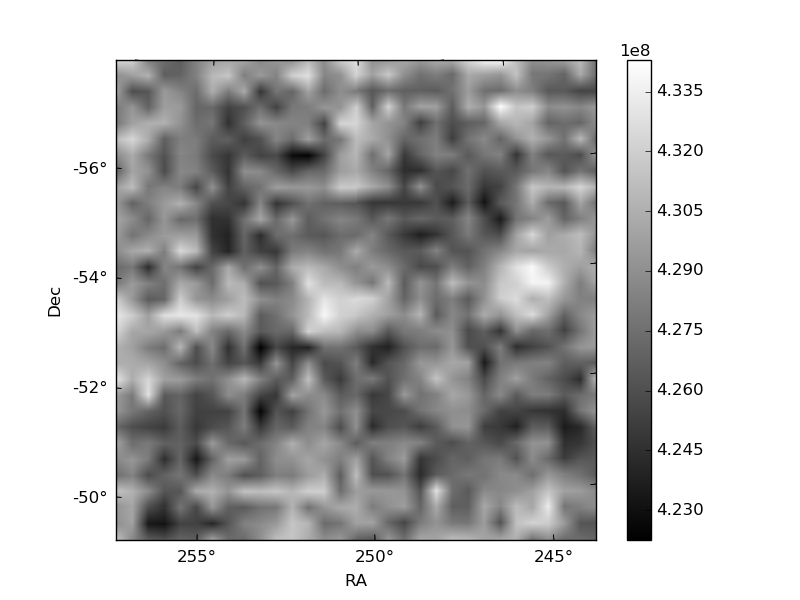
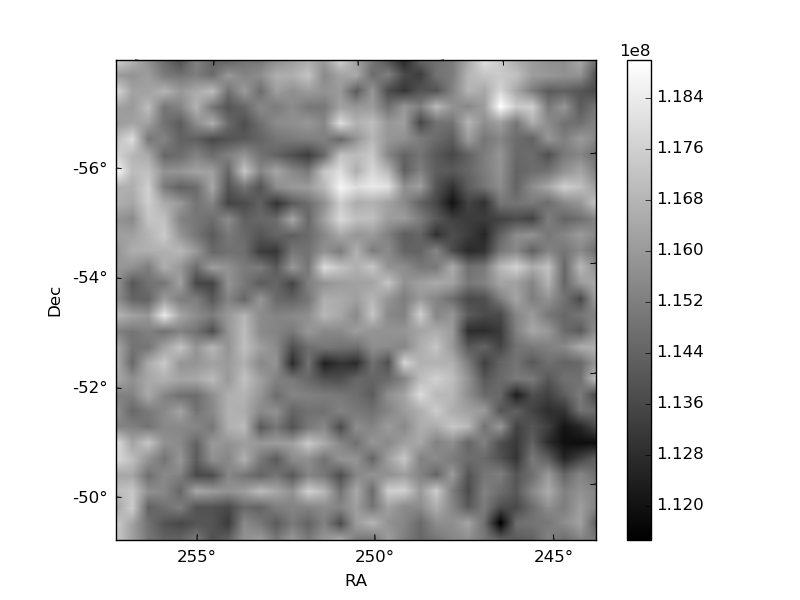
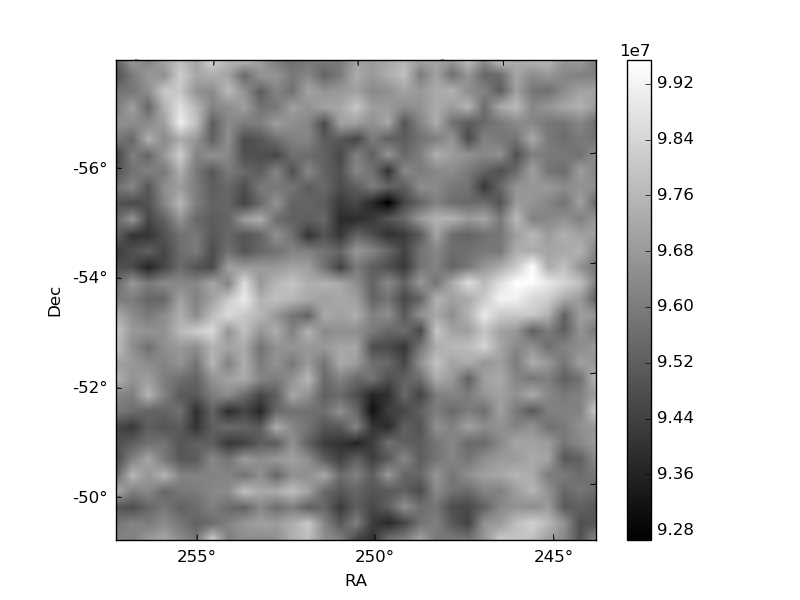
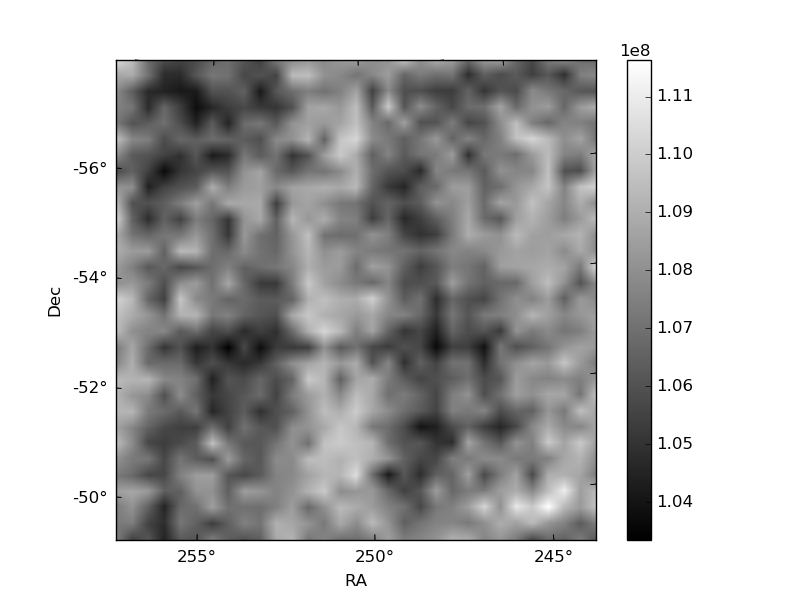
Histogram calculated using DETX and DETY for each event in the final _common_clean file
| Quadrant A | 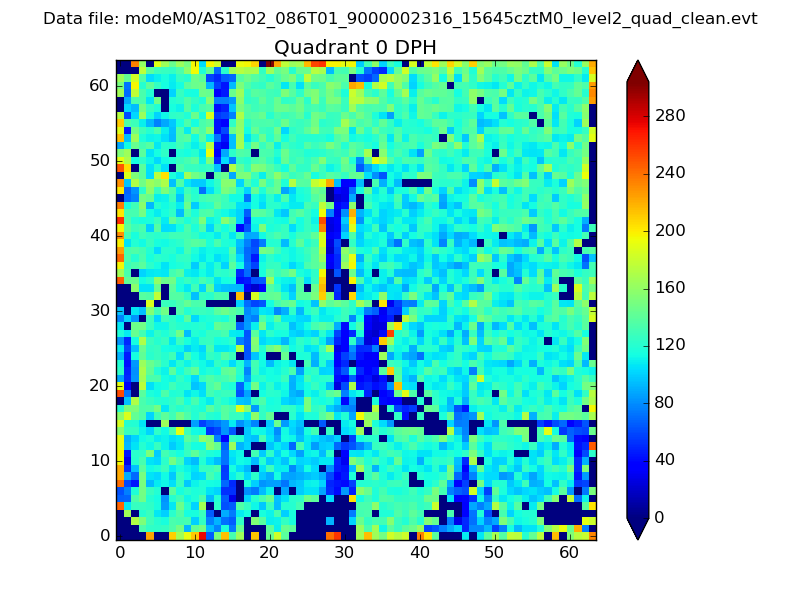 |
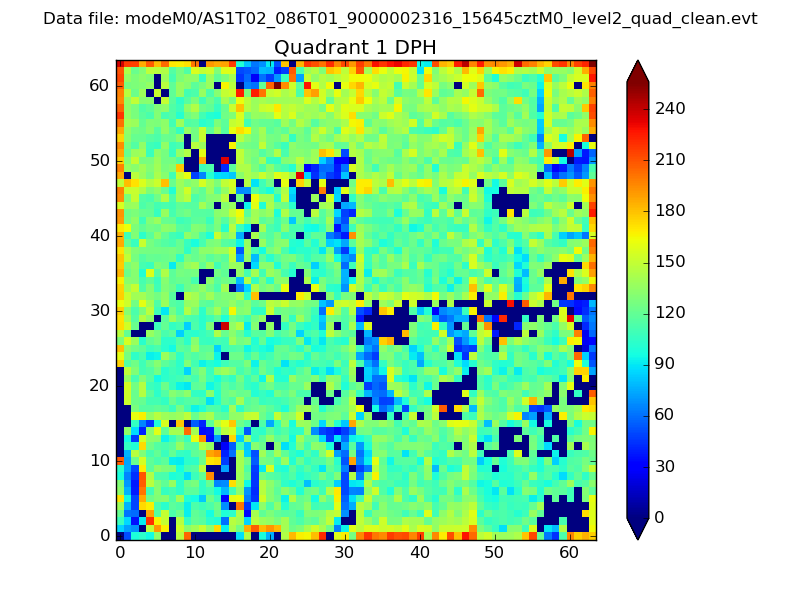 |
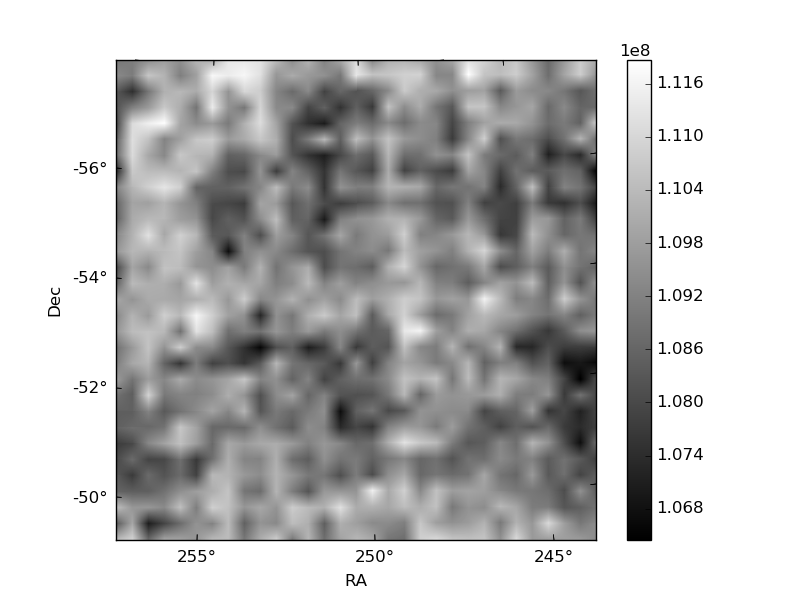
Quadrant B |
|---|---|---|---|
| Quadrant D |  |
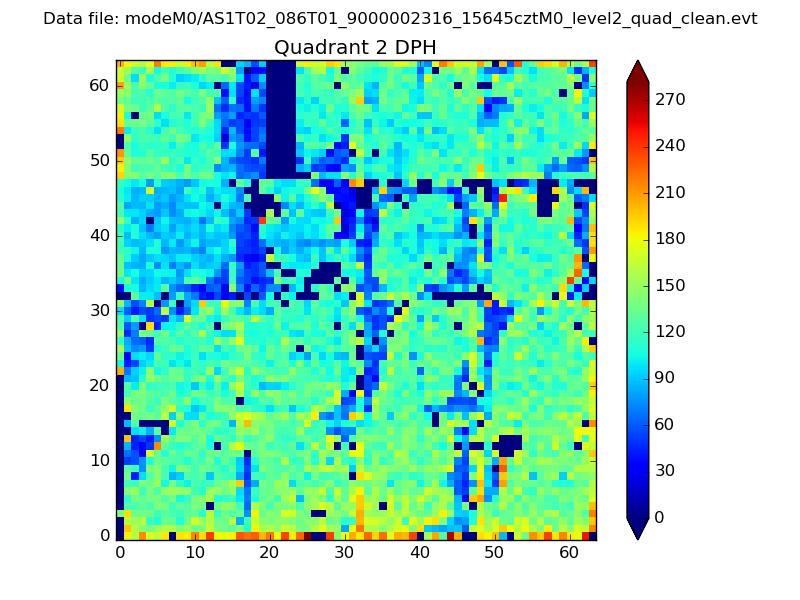 |
Quadrant C |
| Plot type | Count rate plots | Images |
|---|---|---|
| Comparison with Poisson distribution Blue bars denote a histogram of data divided into 1 sec bins. Red curve is a Poisson curve with rate = median count rate of data. |
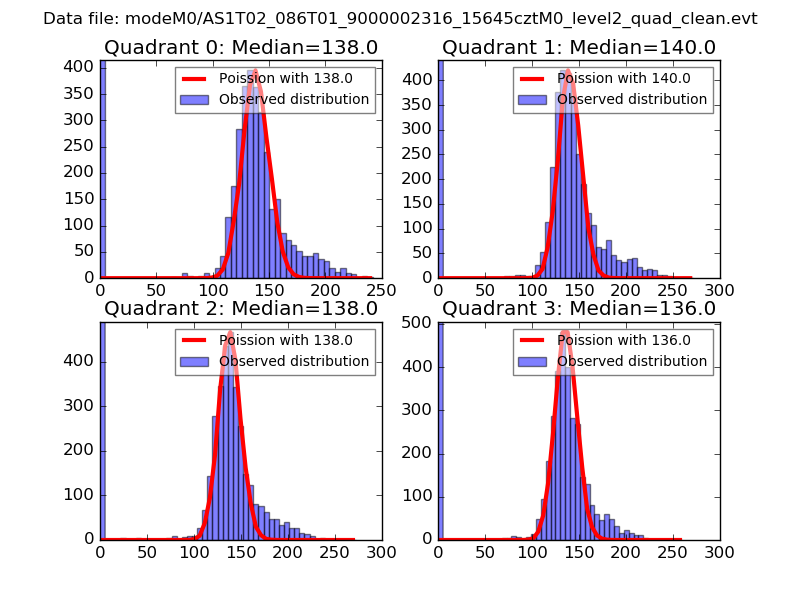 |
 |
| Quadrant-wise count rates Data is divided into 100 sec bins |
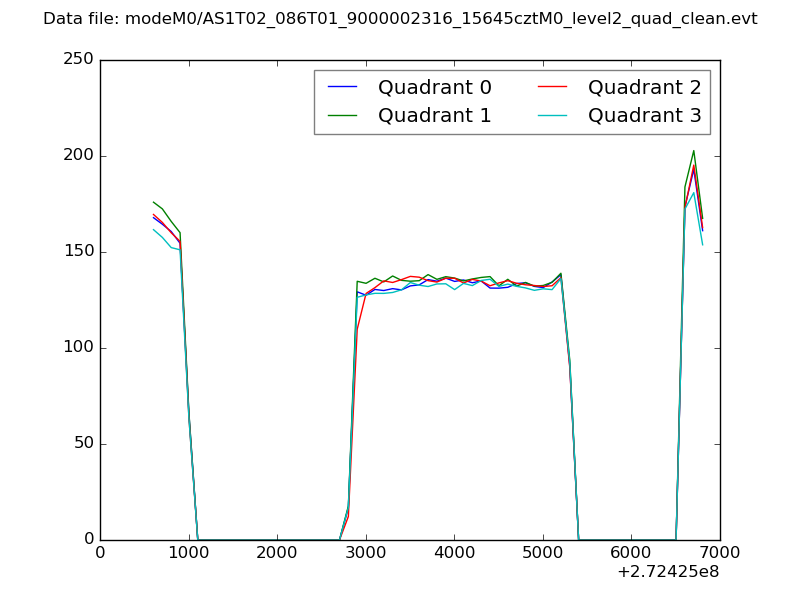 |
|
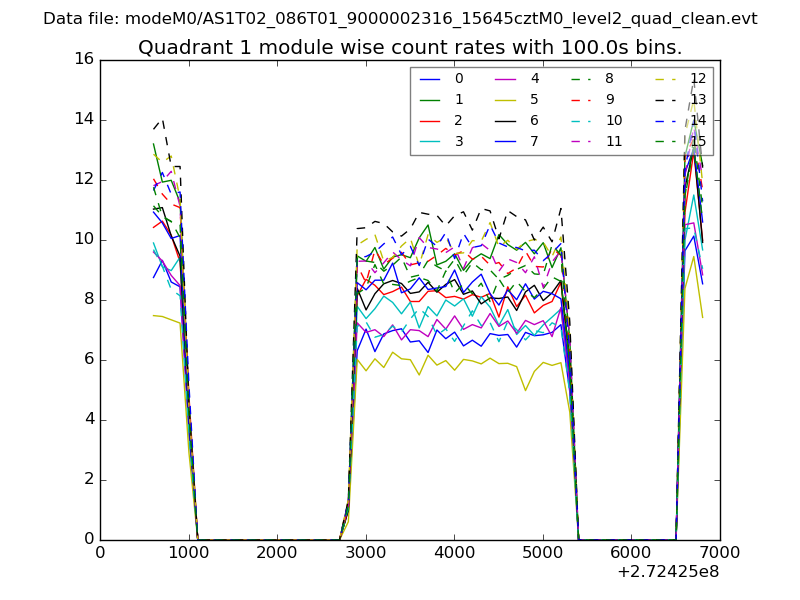
| Module-wise count rates for Quadrant A Data is divided into 100 sec bins |
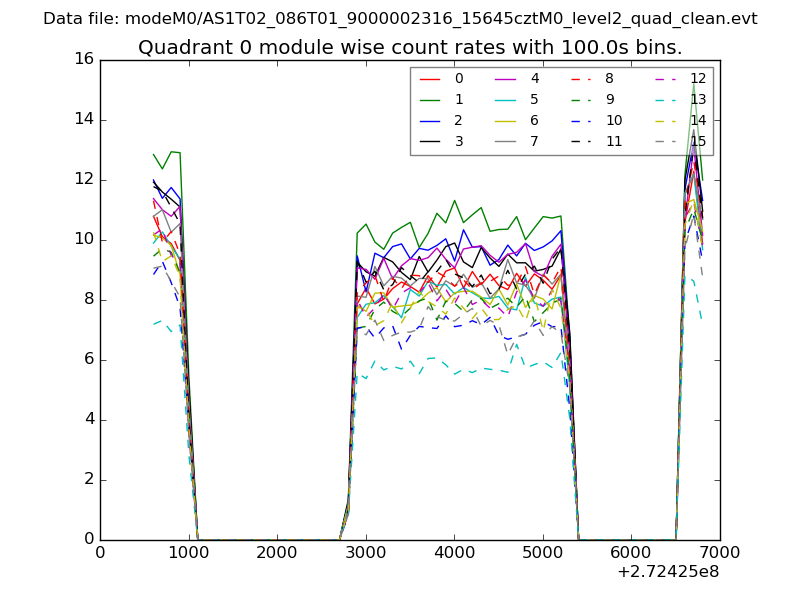 |
 |
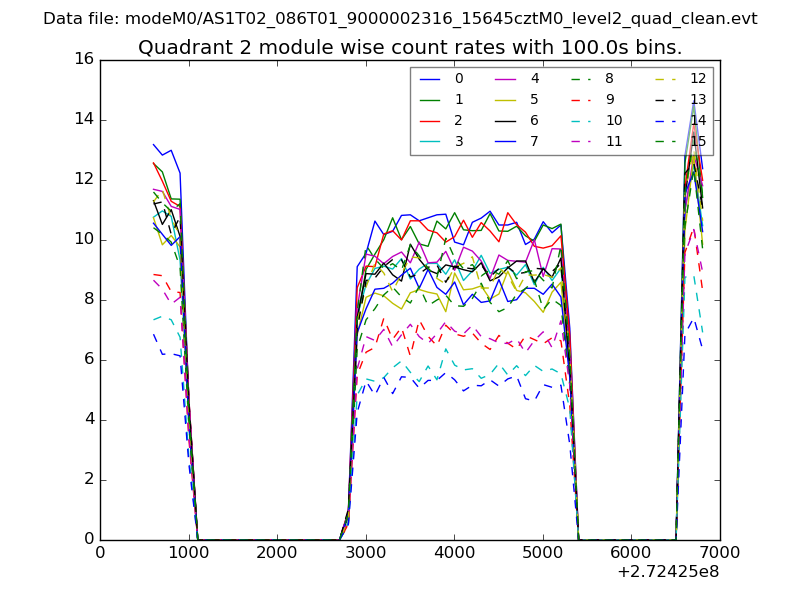
| Module-wise count rates for Quadrant B Data is divided into 100 sec bins |
 |
 |
| Module-wise count rates for Quadrant C Data is divided into 100 sec bins |
 |
 |
| Module-wise count rates for Quadrant D Data is divided into 100 sec bins |
 |
 |
| Parameter | Plot |
|---|---|
| CZT HV Monitor | 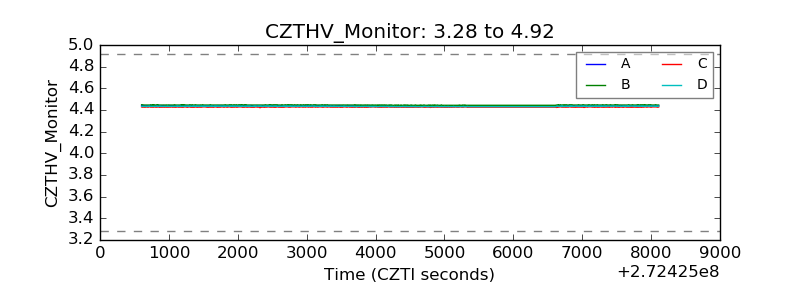 |
| D_VDD | 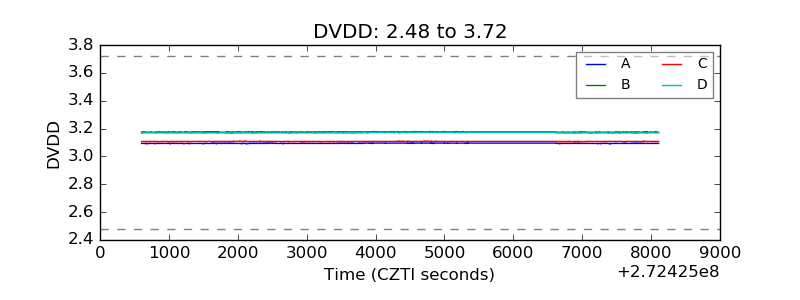 |
| Temperature 1 | 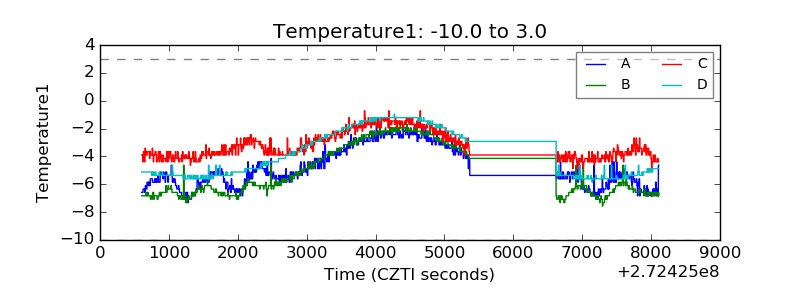 |
| Veto HV Monitor | 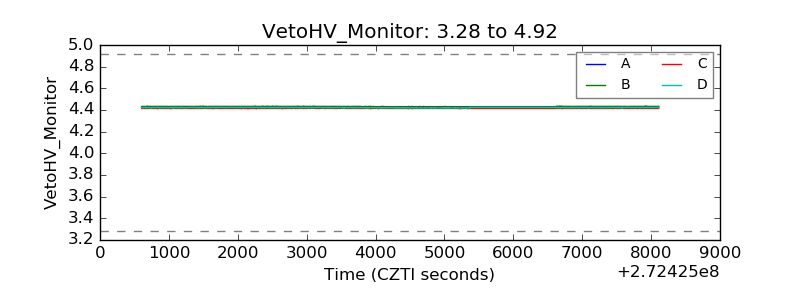 |
| Veto LLD | 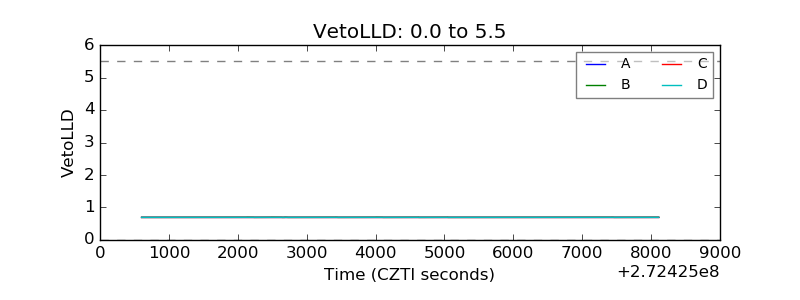 |
| Alpha Counter | 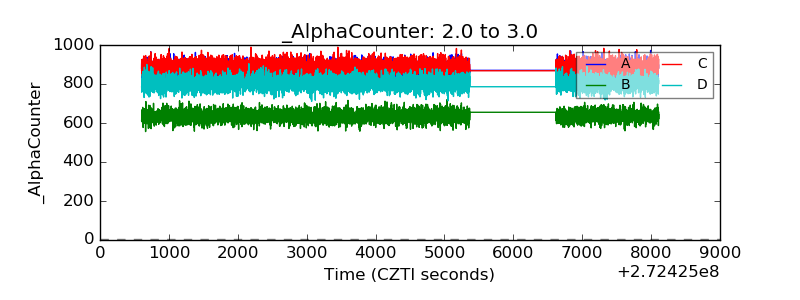 |
| _CPM_Rate | 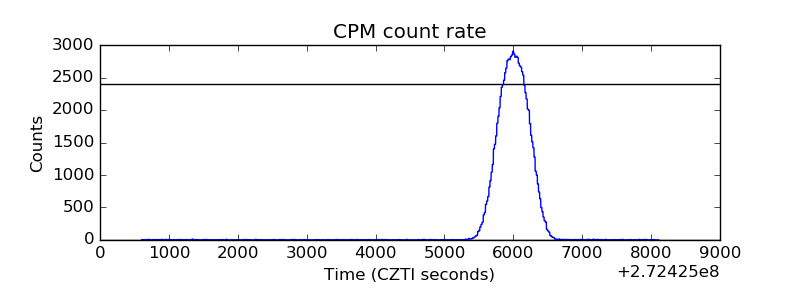 |
| CZT Counter | 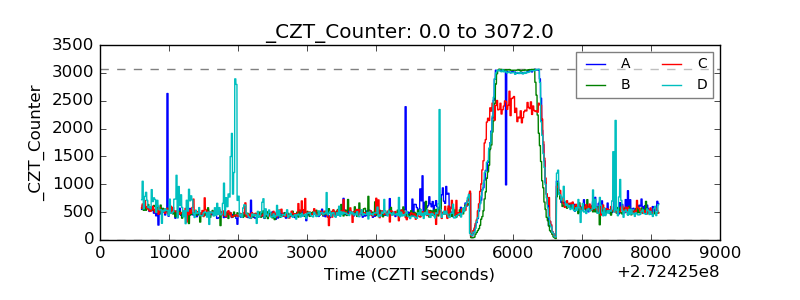 |
| +2.5 Volts monitor |  |
| +5 Volts monitor |  |
| _ROLL_ROT | 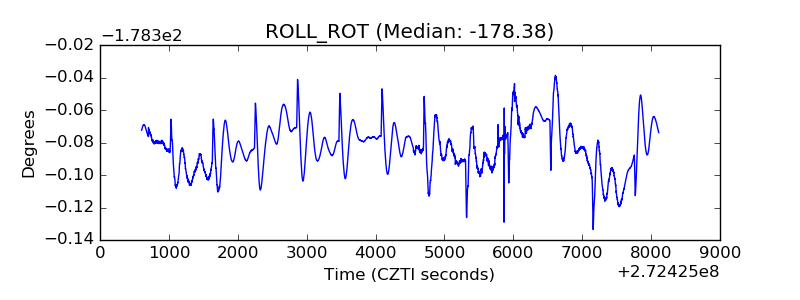 |
| _Roll_DEC | 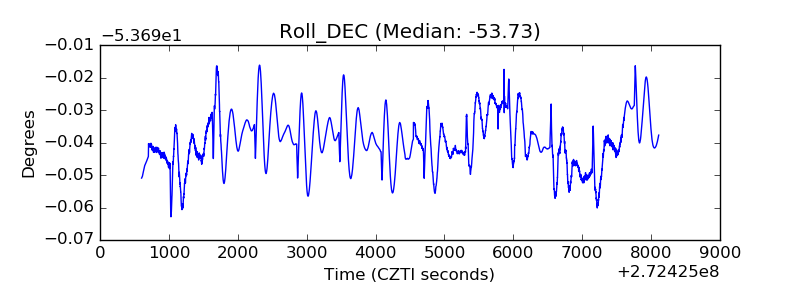 |
| _Roll_RA | 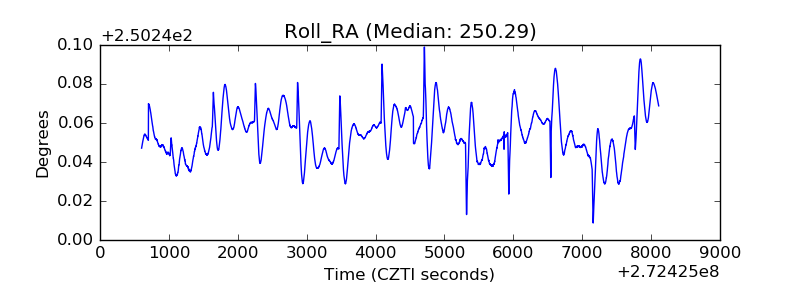 |
| Veto Counter | 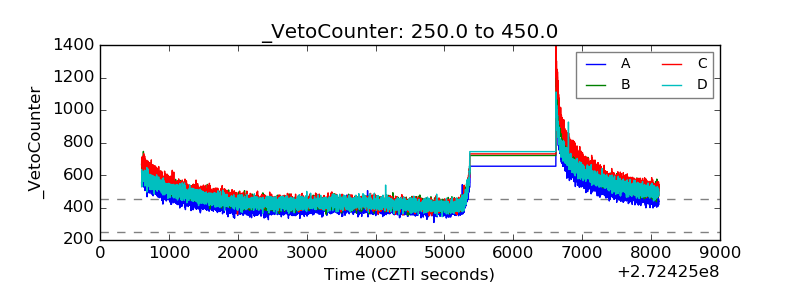 |