| Param | Original file | Final file |
|---|---|---|
| Filename | modeM0/AS1T02_086T01_9000002316_15646cztM0_level2.evt | modeM0/AS1T02_086T01_9000002316_15646cztM0_level2_quad_clean.evt |
| Size (bytes) | 483,773,760 | 72,907,200 |
| Size | 461.4 MB | 69.5 MB |
| Events in quadrant A | 3,794,080 | 440,729 |
| Events in quadrant B | 3,344,564 | 452,771 |
| Events in quadrant C | 3,462,979 | 447,098 |
| Events in quadrant D | 3,625,998 | 431,154 |
| Mode SS | |||
|---|---|---|---|
| Quadrant | BADHDUFLAG | Total packets | Discarded packets |
| A | 0 | 126 | 0 |
| B | 0 | 126 | 0 |
| C | 0 | 126 | 0 |
| D | 0 | 126 | 0 |
| Mode M9 | |||
|---|---|---|---|
| Quadrant | BADHDUFLAG | Total packets | Discarded packets |
| A | 0 | 17 | 0 |
| B | 0 | 17 | 0 |
| C | 0 | 17 | 0 |
| D | 0 | 18 | 0 |
| Mode M0 | |||
|---|---|---|---|
| Quadrant | BADHDUFLAG | Total packets | Discarded packets |
| A | 0 | 15208 | 3 |
| B | 0 | 13554 | 2 |
| C | 0 | 14085 | 2 |
| D | 0 | 14573 | 2 |
| Quadrant | Total seconds | Saturated seconds | Saturation percentage |
|---|---|---|---|
| A | 6245 | 104 | 1.665332% |
| B | 6245 | 102 | 1.633307% |
| C | 6245 | 151 | 2.417934% |
| D | 6245 | 178 | 2.850280% |
Noise dominated data is calculated using 1-second bins in cleaned event files. If a bin has >2000 counts, and if more than 50% of those come from <1% of pixels, then it is considered to be noise-dominated and hence unusable.
| Quadrant | # 1 sec bins | Bins with >0 counts | Bins with >2000 counts | High rate bins dominated by noise | Noise dominated (total time) | Noise dominated (detector-on time) | Marked lightcurve |
|---|---|---|---|---|---|---|---|
| A | 7576 | 6246 | 5 | 5 | 0.07% | 0.08% | 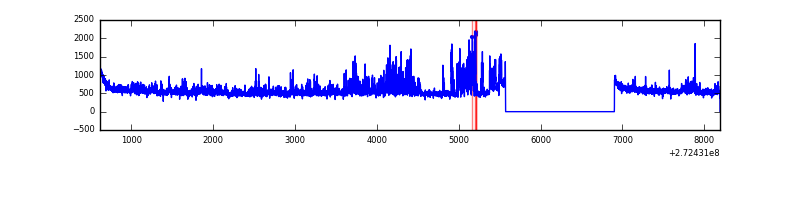 |
| B | 7576 | 6246 | 0 | 0 | 0.00% | 0.00% | 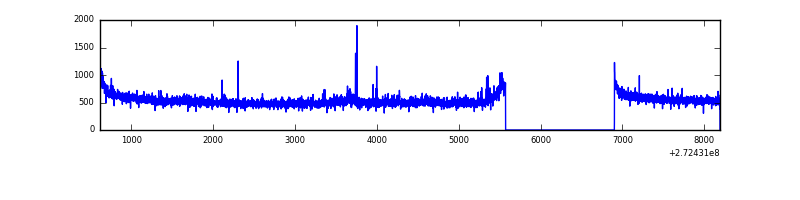 |
| C | 7576 | 6246 | 19 | 19 | 0.25% | 0.30% | 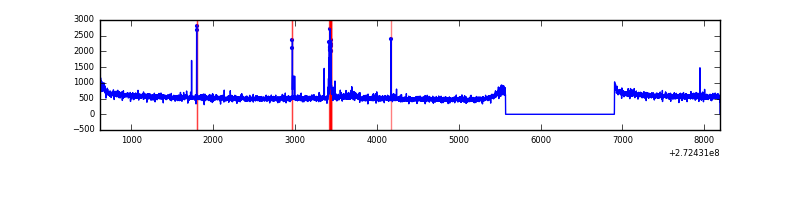 |
| D | 7576 | 6246 | 80 | 80 | 1.06% | 1.28% | 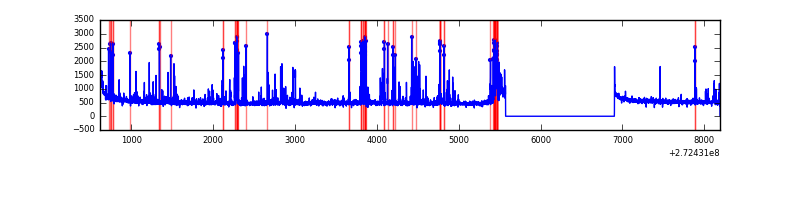 |
Top three noisy pixels from each quadrant. If the there are fewer than three noisy pixels in the level2.evt file, extra rows are filled as -1
| Pixel properties | Quadrant properties | ||||||
|---|---|---|---|---|---|---|---|
| Quadrant | DetID | PixID | Counts | Sigma | Mean | Median | Sigma |
| A | 15 | 249 | 547774 | 3282.5 | 836 | 820 | 166.6 |
| A | 15 | 157 | 29183 | 170.22 | 836 | 820 | 166.6 |
| A | 0 | 226 | 7397 | 39.47 | 836 | 820 | 166.6 |
| B | 0 | 219 | 30920 | 192.8 | 841 | 823 | 156.1 |
| B | 12 | 111 | 17185 | 104.81 | 841 | 823 | 156.1 |
| B | 0 | 214 | 14678 | 88.75 | 841 | 823 | 156.1 |
| C | 14 | 238 | 129870 | 697.66 | 820 | 827 | 185.0 |
| C | 14 | 225 | 111221 | 596.83 | 820 | 827 | 185.0 |
| C | 3 | 233 | 20880 | 108.41 | 820 | 827 | 185.0 |
| D | 1 | 52 | 343289 | 1733.91 | 821 | 799 | 197.5 |
| D | 10 | 70 | 105540 | 530.27 | 821 | 799 | 197.5 |
| D | 2 | 120 | 51817 | 258.29 | 821 | 799 | 197.5 |
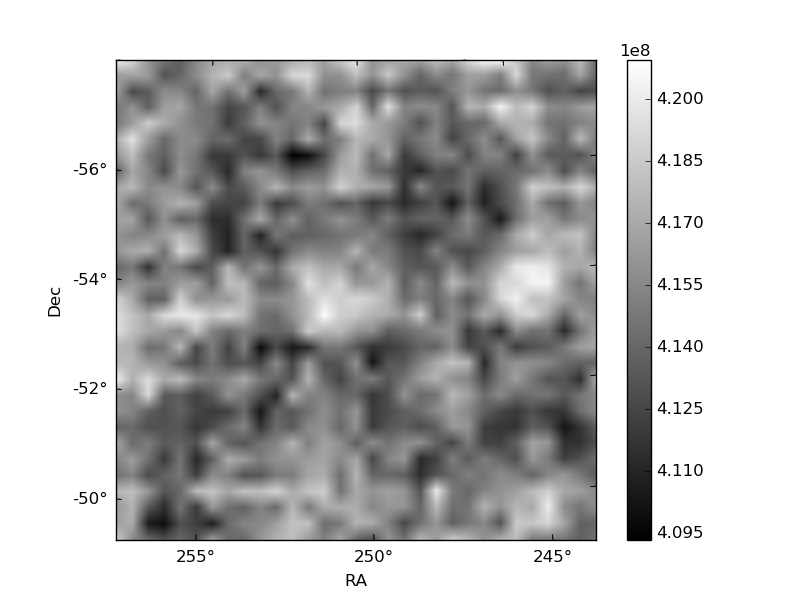
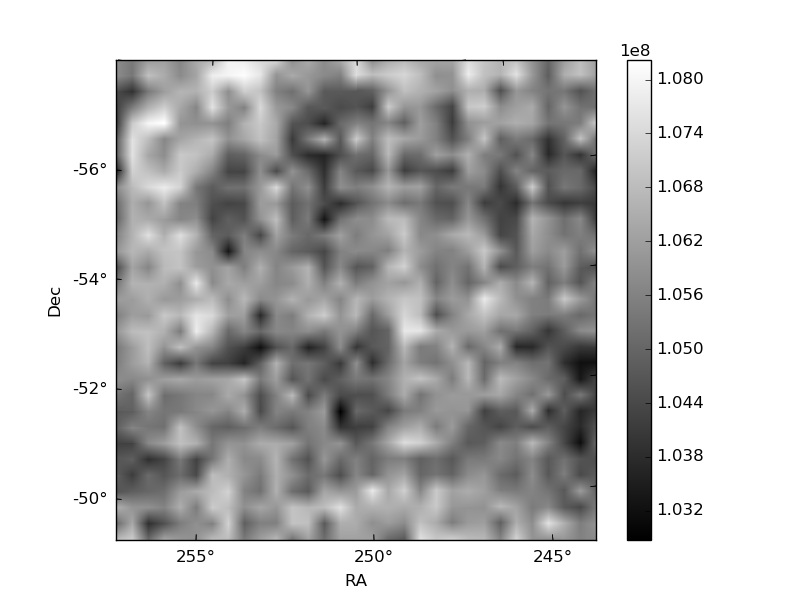
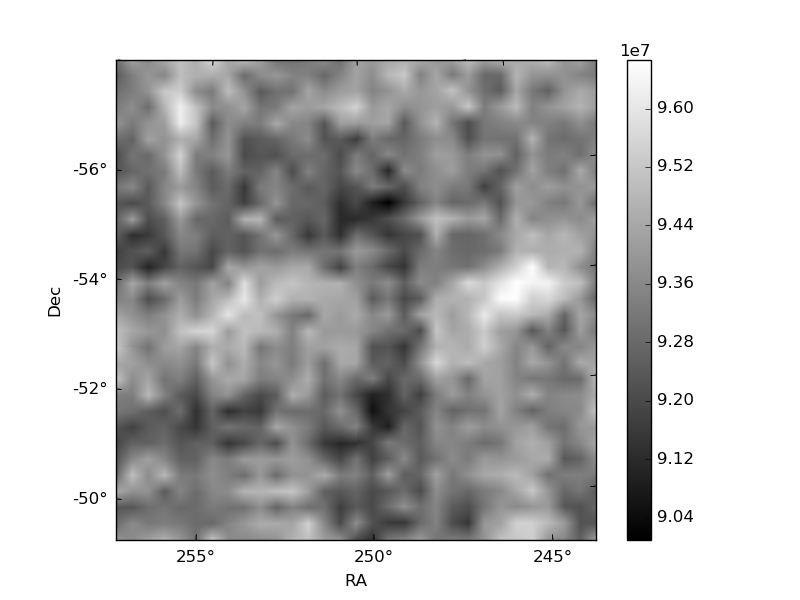
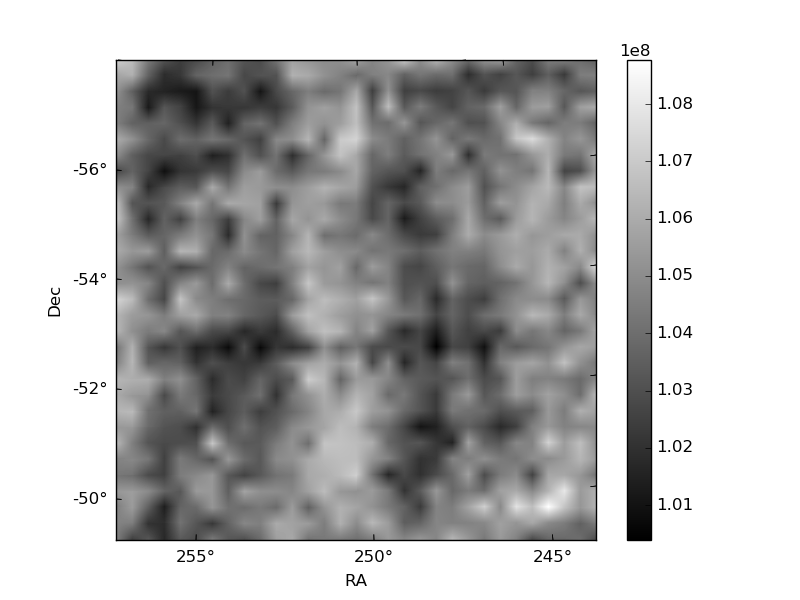
Histogram calculated using DETX and DETY for each event in the final _common_clean file
| Quadrant A | 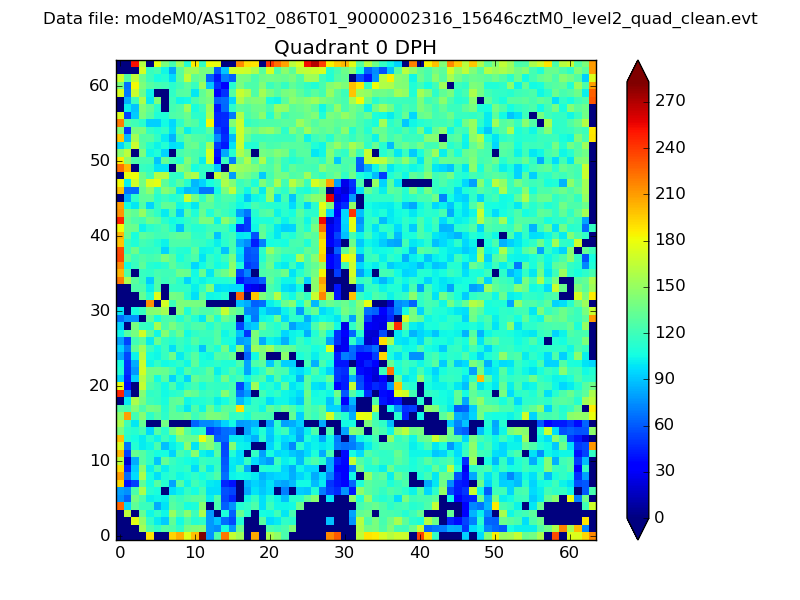 |
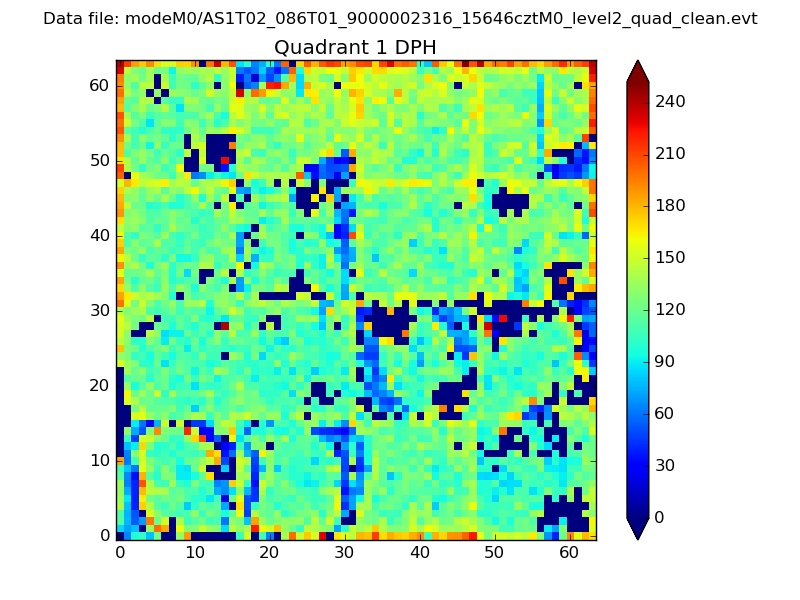 |
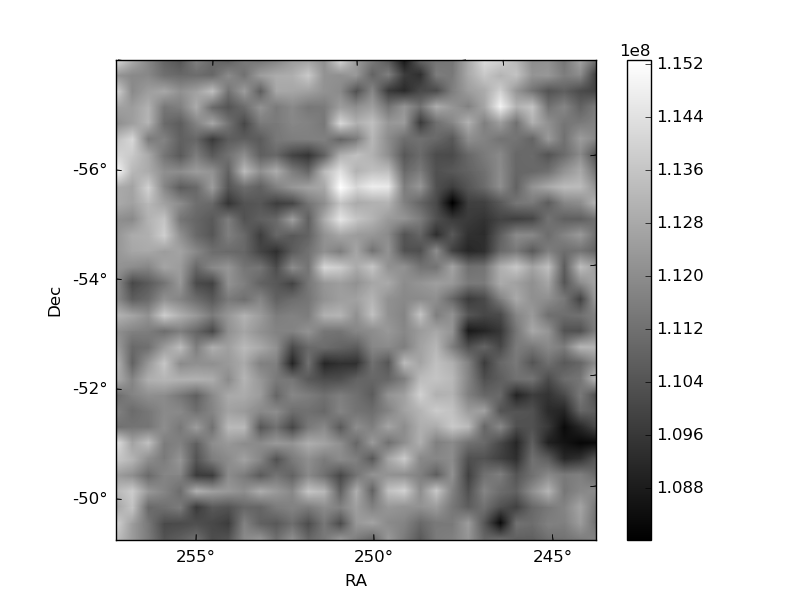
Quadrant B |
|---|---|---|---|
| Quadrant D | 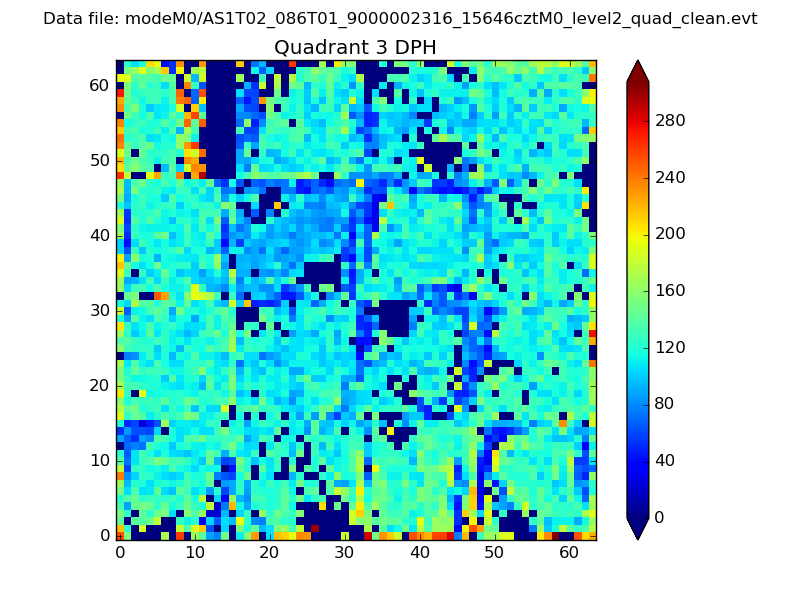 |
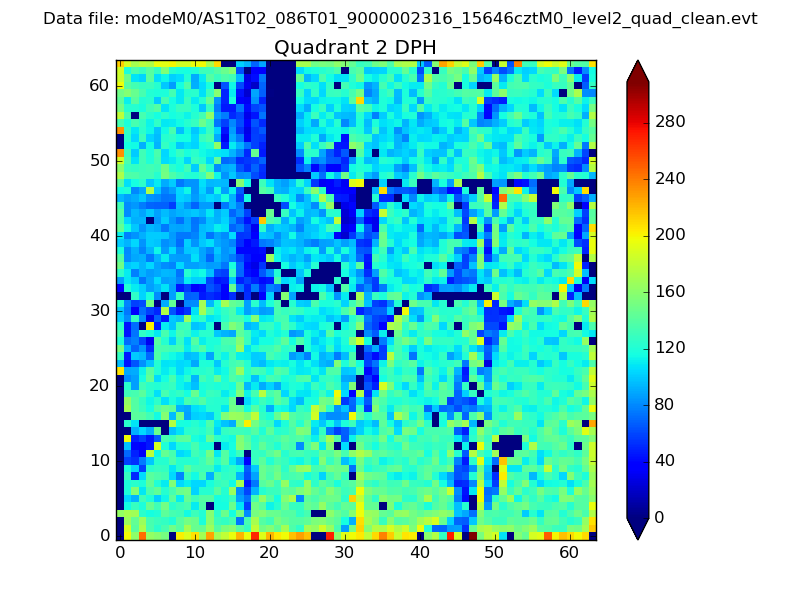 |
Quadrant C |
| Plot type | Count rate plots | Images |
|---|---|---|
| Comparison with Poisson distribution Blue bars denote a histogram of data divided into 1 sec bins. Red curve is a Poisson curve with rate = median count rate of data. |
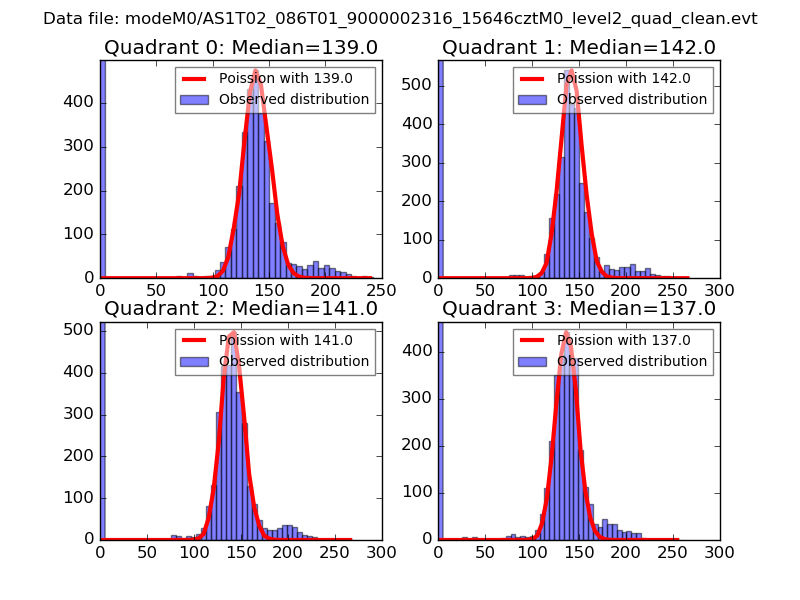 |
 |
| Quadrant-wise count rates Data is divided into 100 sec bins |
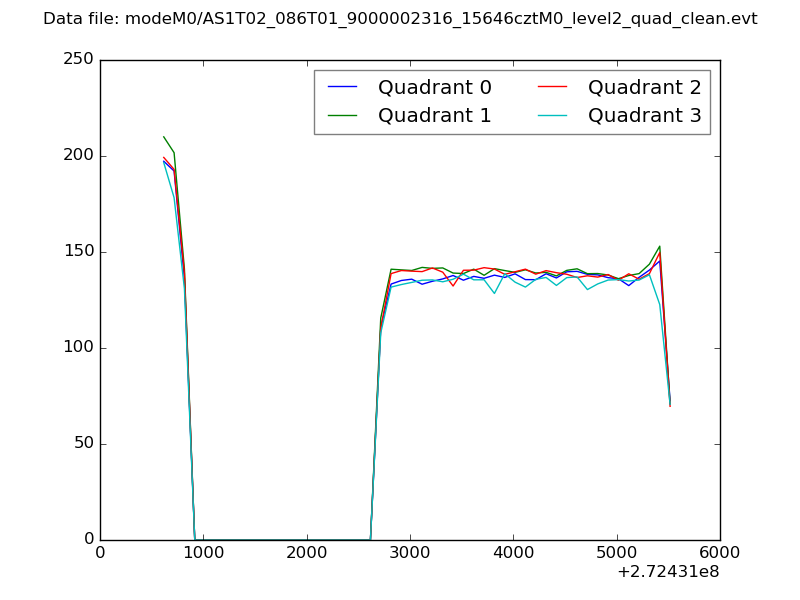 |
|
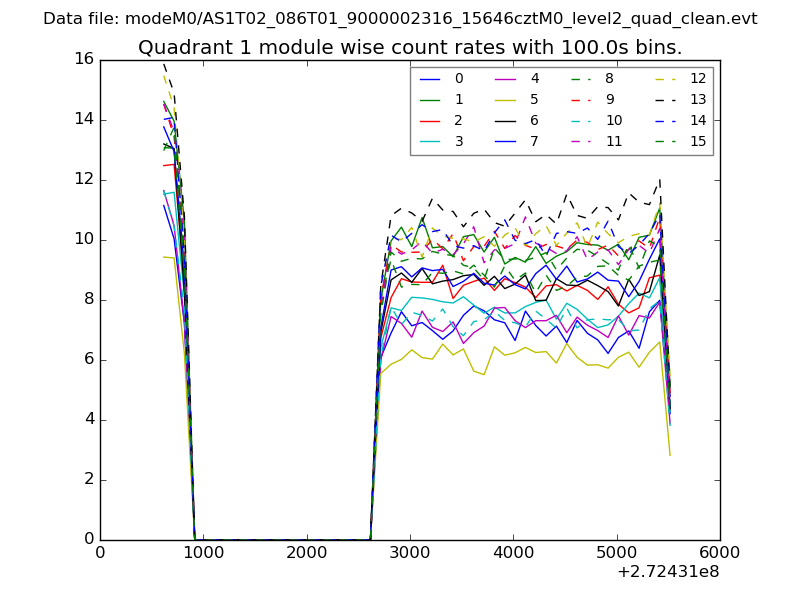
| Module-wise count rates for Quadrant A Data is divided into 100 sec bins |
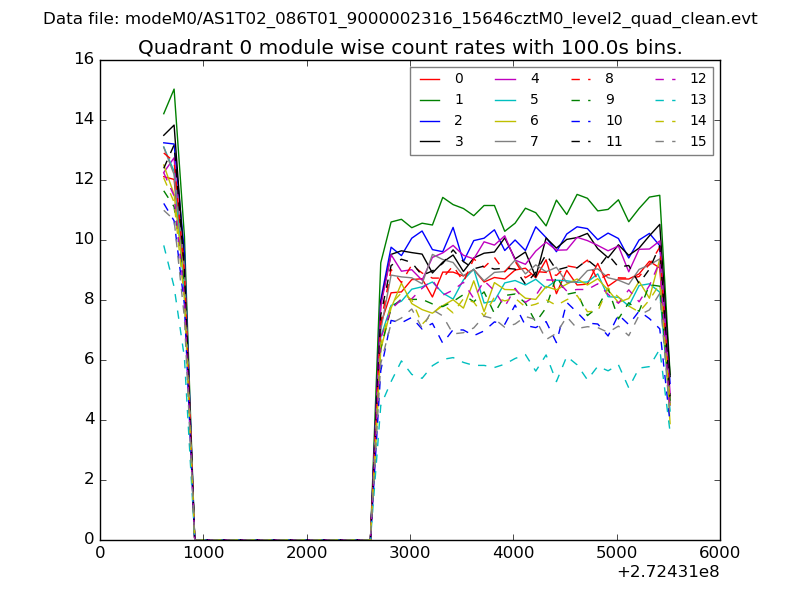 |
 |
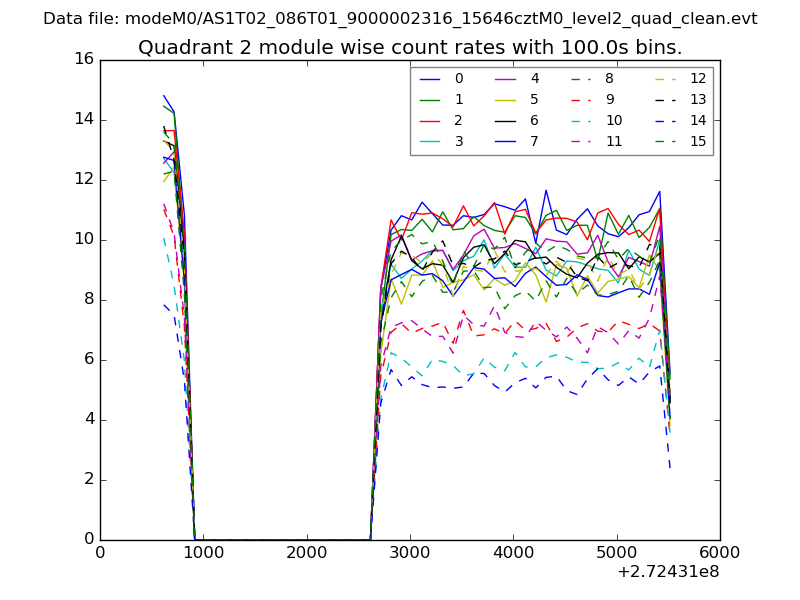
| Module-wise count rates for Quadrant B Data is divided into 100 sec bins |
 |
 |
| Module-wise count rates for Quadrant C Data is divided into 100 sec bins |
 |
 |
| Module-wise count rates for Quadrant D Data is divided into 100 sec bins |
 |
 |
| Parameter | Plot |
|---|---|
| CZT HV Monitor | 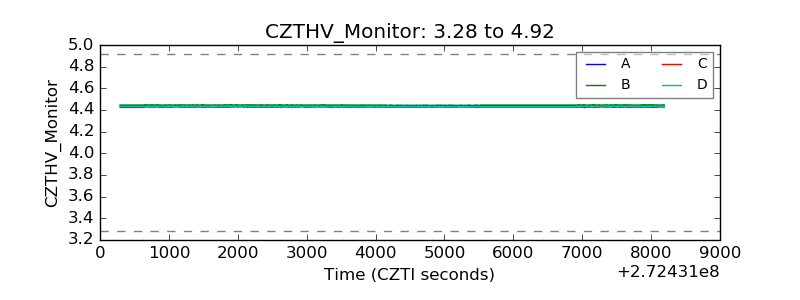 |
| D_VDD | 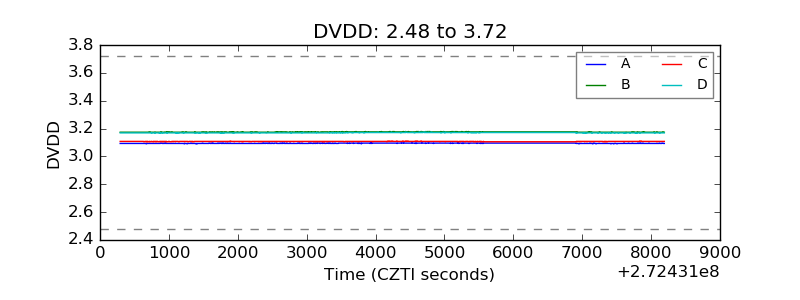 |
| Temperature 1 | 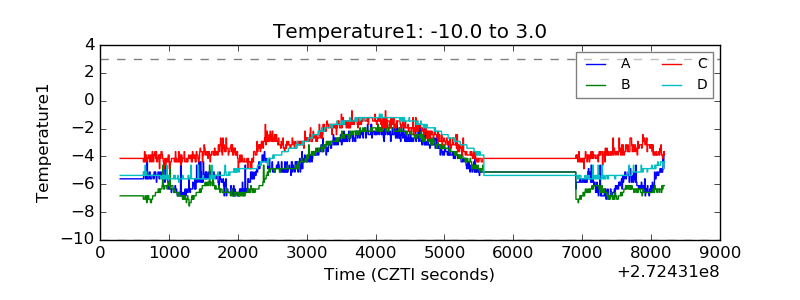 |
| Veto HV Monitor | 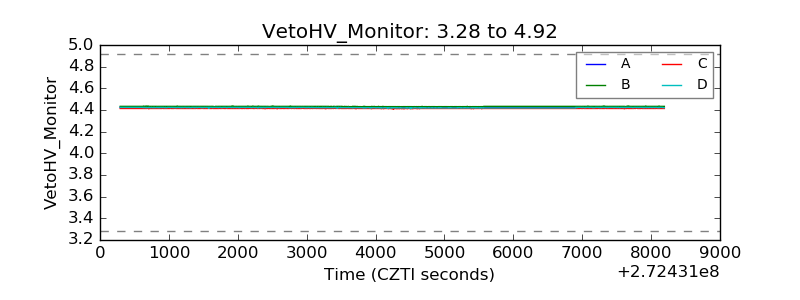 |
| Veto LLD | 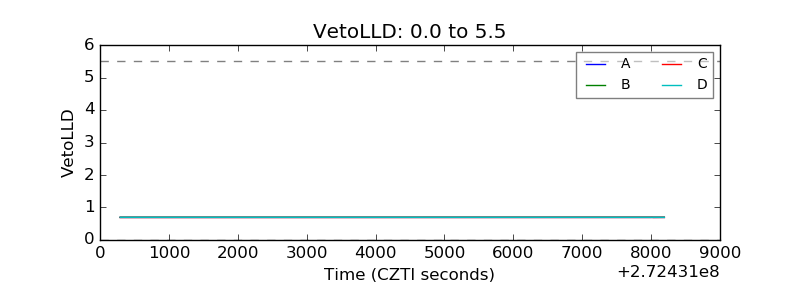 |
| Alpha Counter | 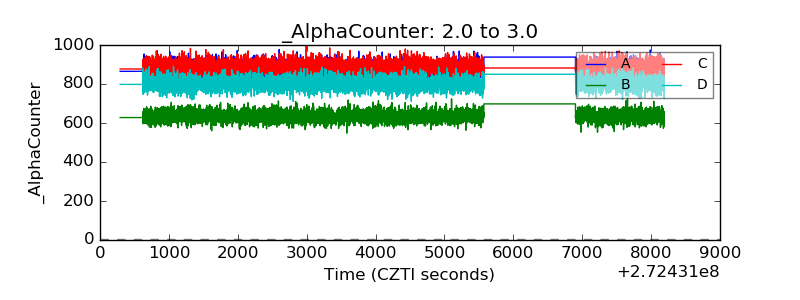 |
| _CPM_Rate | 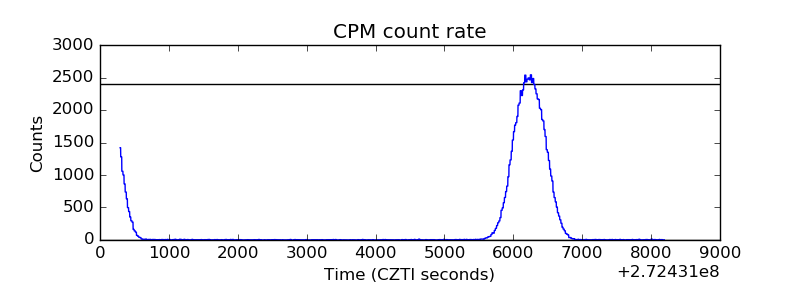 |
| CZT Counter | 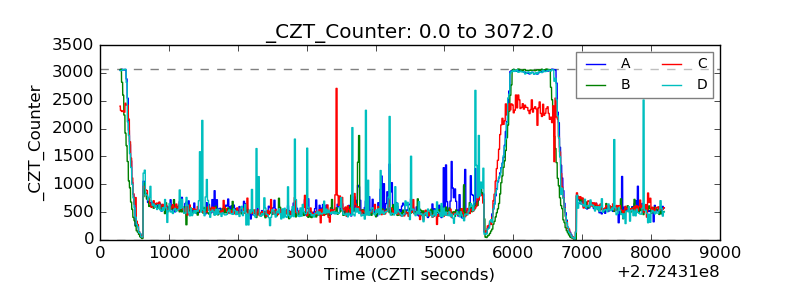 |
| +2.5 Volts monitor |  |
| +5 Volts monitor |  |
| _ROLL_ROT | 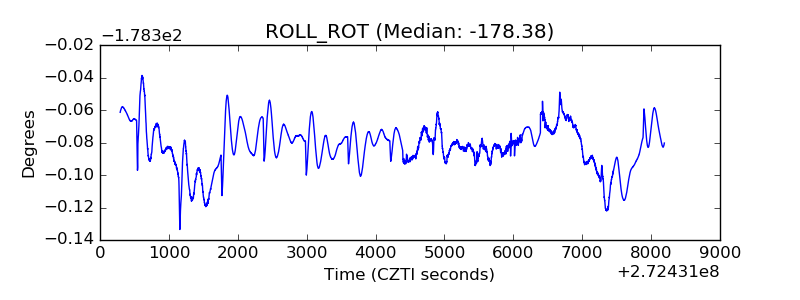 |
| _Roll_DEC | 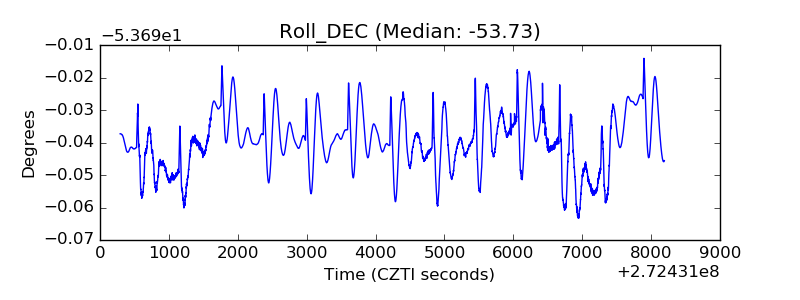 |
| _Roll_RA | 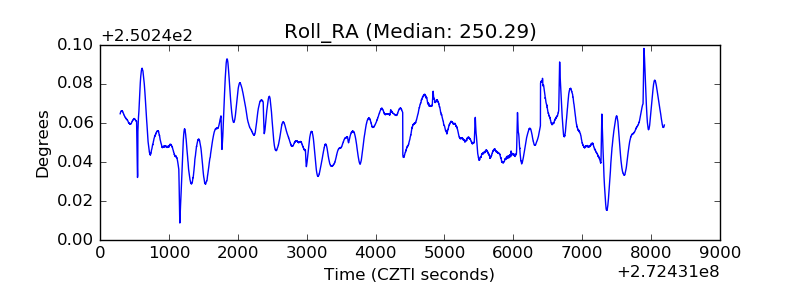 |
| Veto Counter | 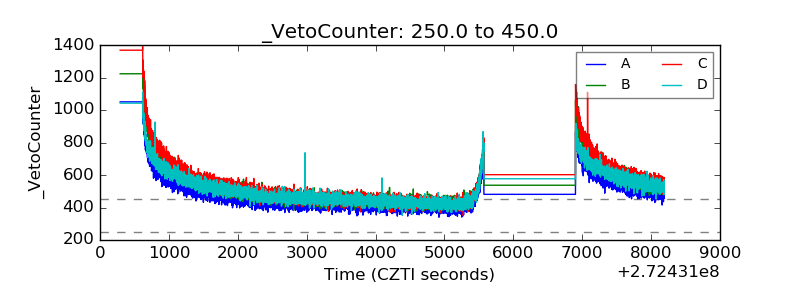 |