| Param | Original file | Final file |
|---|---|---|
| Filename | modeM0/AS1T02_086T01_9000002316_15647cztM0_level2.evt | modeM0/AS1T02_086T01_9000002316_15647cztM0_level2_quad_clean.evt |
| Size (bytes) | 456,511,680 | 74,583,360 |
| Size | 435.4 MB | 71.1 MB |
| Events in quadrant A | 3,295,299 | 455,179 |
| Events in quadrant B | 3,314,056 | 464,141 |
| Events in quadrant C | 3,345,502 | 459,116 |
| Events in quadrant D | 3,449,377 | 447,090 |
| Mode SS | |||
|---|---|---|---|
| Quadrant | BADHDUFLAG | Total packets | Discarded packets |
| A | 0 | 126 | 0 |
| B | 0 | 126 | 0 |
| C | 0 | 126 | 0 |
| D | 0 | 126 | 0 |
| Mode M9 | |||
|---|---|---|---|
| Quadrant | BADHDUFLAG | Total packets | Discarded packets |
| A | 0 | 22 | 0 |
| B | 0 | 22 | 0 |
| C | 0 | 22 | 0 |
| D | 0 | 23 | 0 |
| Mode M0 | |||
|---|---|---|---|
| Quadrant | BADHDUFLAG | Total packets | Discarded packets |
| A | 0 | 13445 | 3 |
| B | 0 | 13405 | 2 |
| C | 0 | 13702 | 2 |
| D | 0 | 13959 | 2 |
| Quadrant | Total seconds | Saturated seconds | Saturation percentage |
|---|---|---|---|
| A | 6201 | 69 | 1.112724% |
| B | 6201 | 100 | 1.612643% |
| C | 6201 | 133 | 2.144815% |
| D | 6201 | 122 | 1.967425% |
Noise dominated data is calculated using 1-second bins in cleaned event files. If a bin has >2000 counts, and if more than 50% of those come from <1% of pixels, then it is considered to be noise-dominated and hence unusable.
| Quadrant | # 1 sec bins | Bins with >0 counts | Bins with >2000 counts | High rate bins dominated by noise | Noise dominated (total time) | Noise dominated (detector-on time) | Marked lightcurve |
|---|---|---|---|---|---|---|---|
| A | 7547 | 6202 | 0 | 0 | 0.00% | 0.00% | 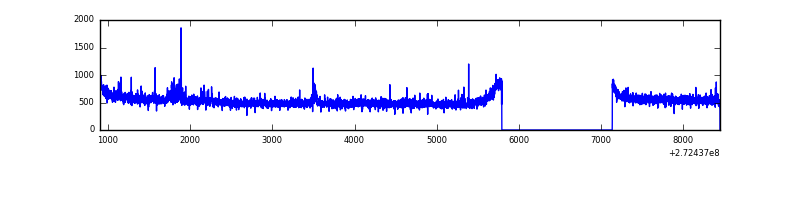 |
| B | 7547 | 6202 | 0 | 0 | 0.00% | 0.00% | 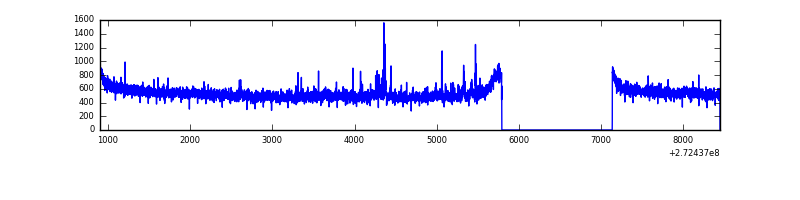 |
| C | 7547 | 6202 | 0 | 0 | 0.00% | 0.00% | 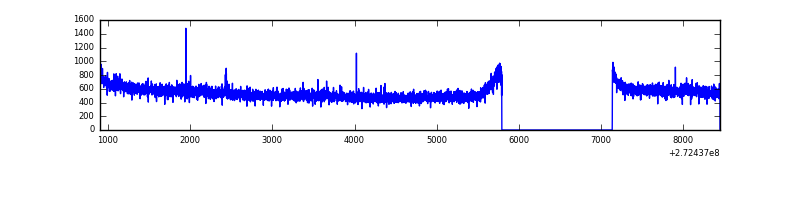 |
| D | 7547 | 6202 | 60 | 60 | 0.80% | 0.97% | 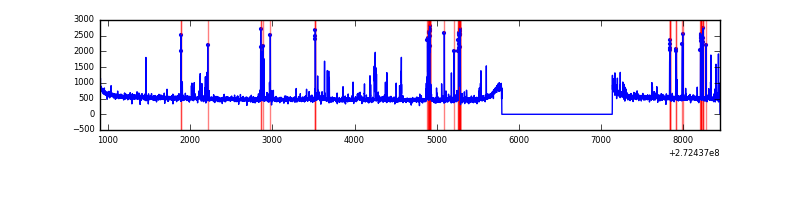 |
Top three noisy pixels from each quadrant. If the there are fewer than three noisy pixels in the level2.evt file, extra rows are filled as -1
| Pixel properties | Quadrant properties | ||||||
|---|---|---|---|---|---|---|---|
| Quadrant | DetID | PixID | Counts | Sigma | Mean | Median | Sigma |
| A | 15 | 157 | 68752 | 408.63 | 834 | 819 | 166.2 |
| A | 15 | 249 | 18633 | 107.16 | 834 | 819 | 166.2 |
| A | 0 | 226 | 7410 | 39.65 | 834 | 819 | 166.2 |
| B | 0 | 189 | 38552 | 247.13 | 832 | 814 | 152.7 |
| B | 12 | 111 | 17131 | 106.85 | 832 | 814 | 152.7 |
| B | 11 | 111 | 14604 | 90.3 | 832 | 814 | 152.7 |
| C | 14 | 238 | 128789 | 695.39 | 813 | 822 | 184.0 |
| C | 3 | 233 | 36893 | 196.01 | 813 | 822 | 184.0 |
| C | 10 | 187 | 6117 | 28.77 | 813 | 822 | 184.0 |
| D | 1 | 52 | 204009 | 1036.14 | 819 | 795 | 196.1 |
| D | 10 | 70 | 64595 | 325.3 | 819 | 795 | 196.1 |
| D | 4 | 95 | 60492 | 304.38 | 819 | 795 | 196.1 |
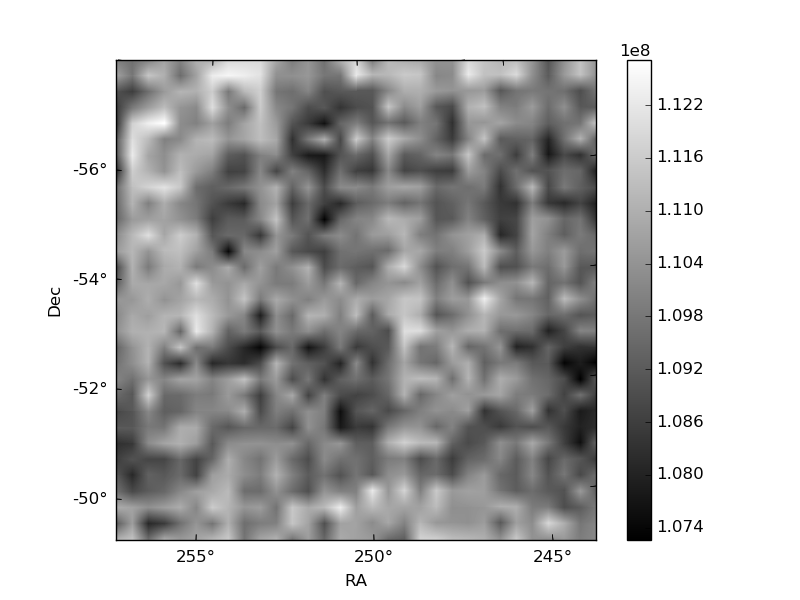
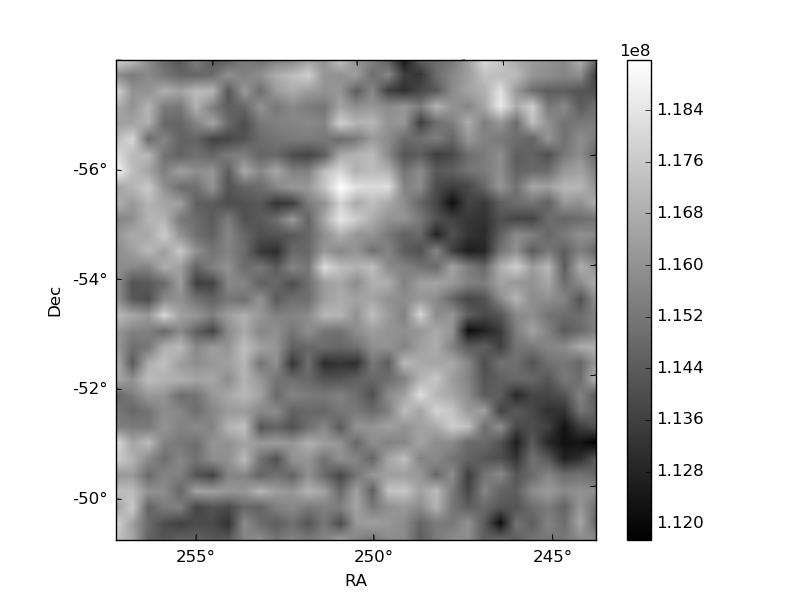
Histogram calculated using DETX and DETY for each event in the final _common_clean file
| Quadrant A | 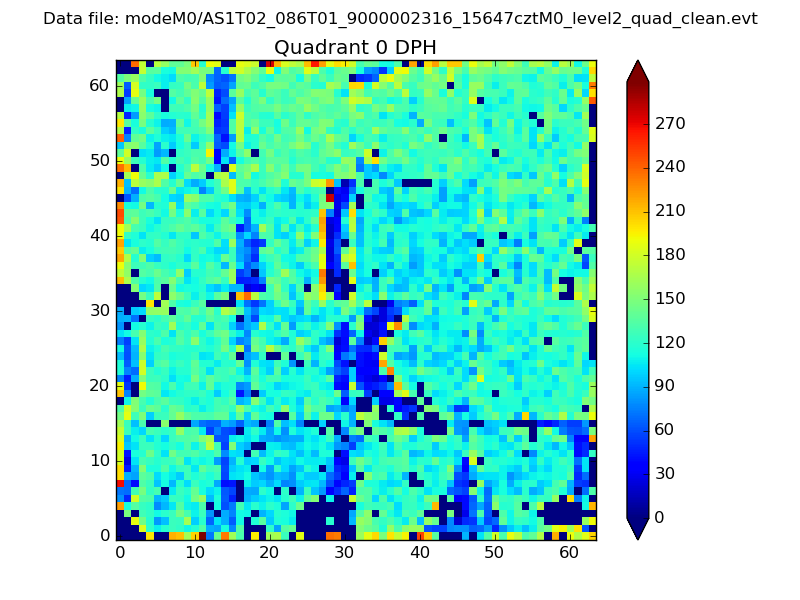 |
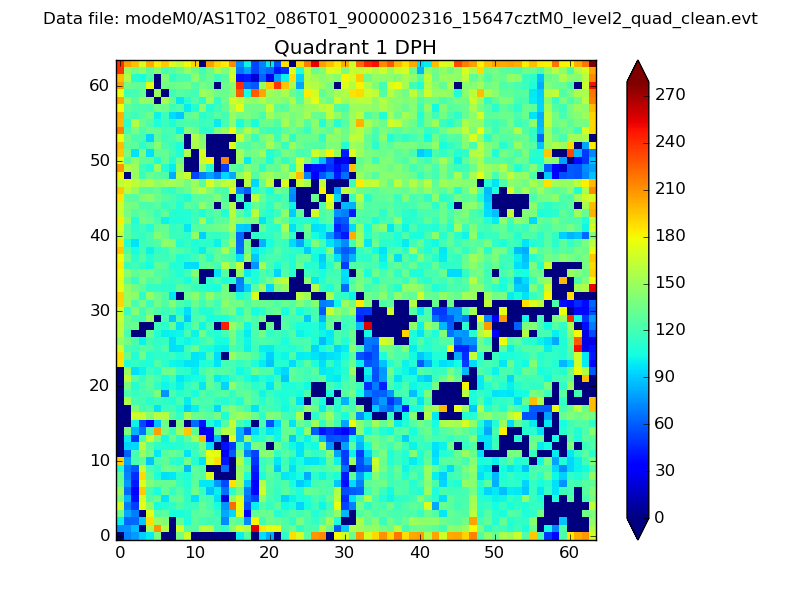 |
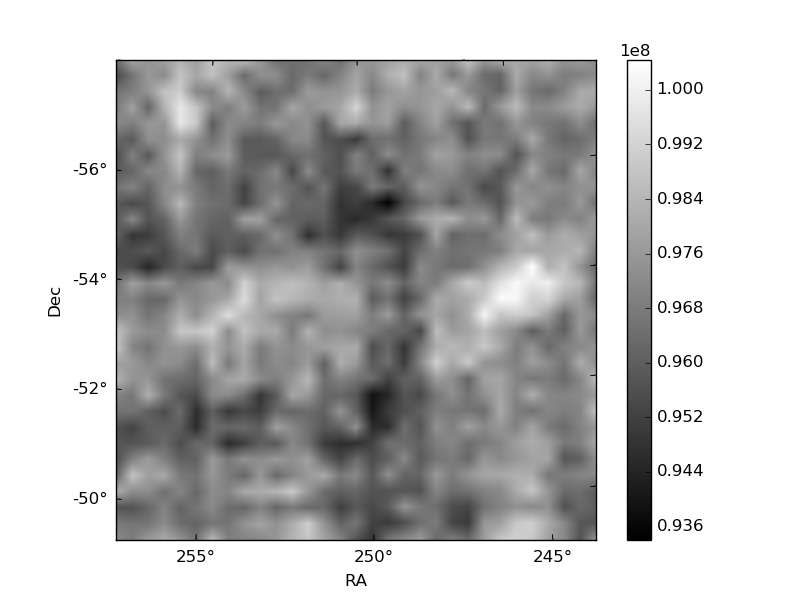
Quadrant B |
|---|---|---|---|
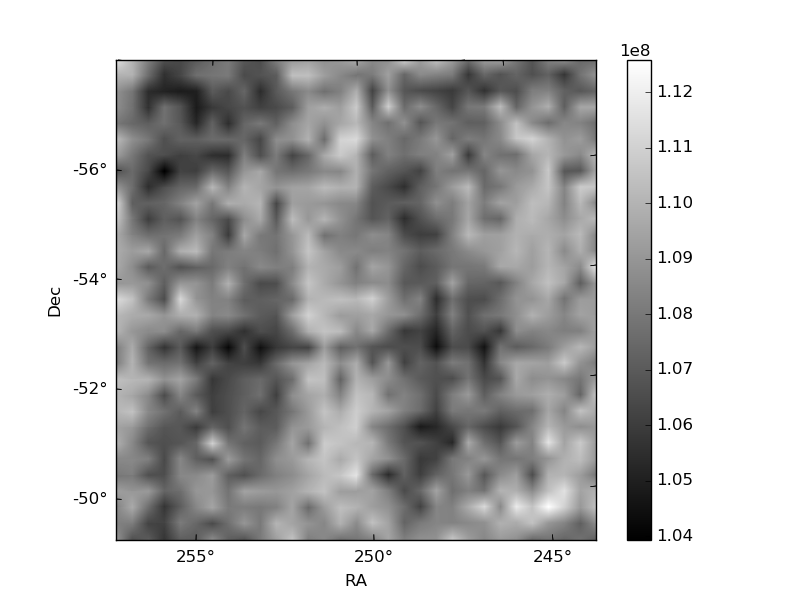
| Quadrant D | 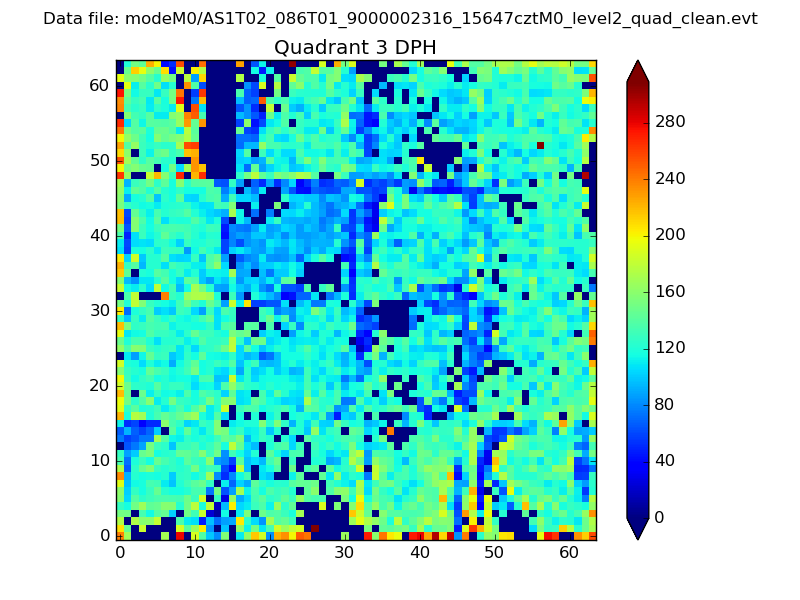 |
 |
Quadrant C |
| Plot type | Count rate plots | Images |
|---|---|---|
| Comparison with Poisson distribution Blue bars denote a histogram of data divided into 1 sec bins. Red curve is a Poisson curve with rate = median count rate of data. |
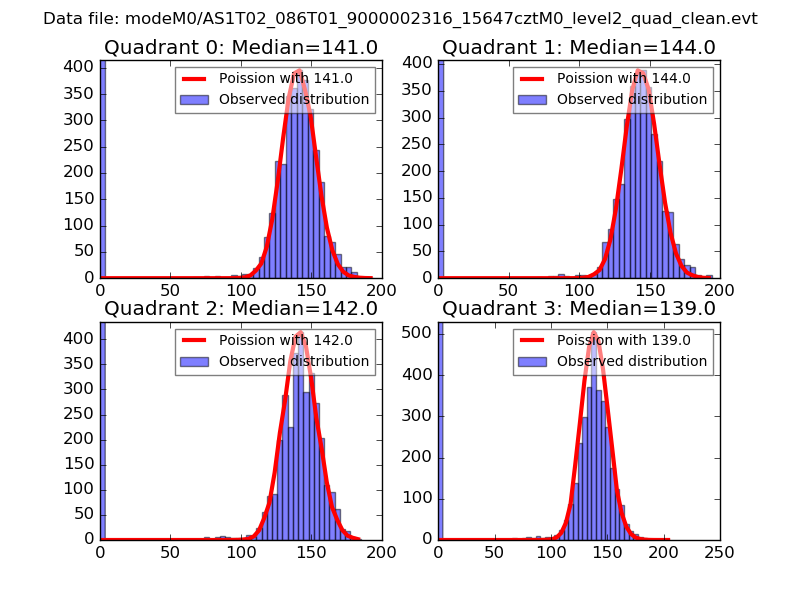 |
 |
| Quadrant-wise count rates Data is divided into 100 sec bins |
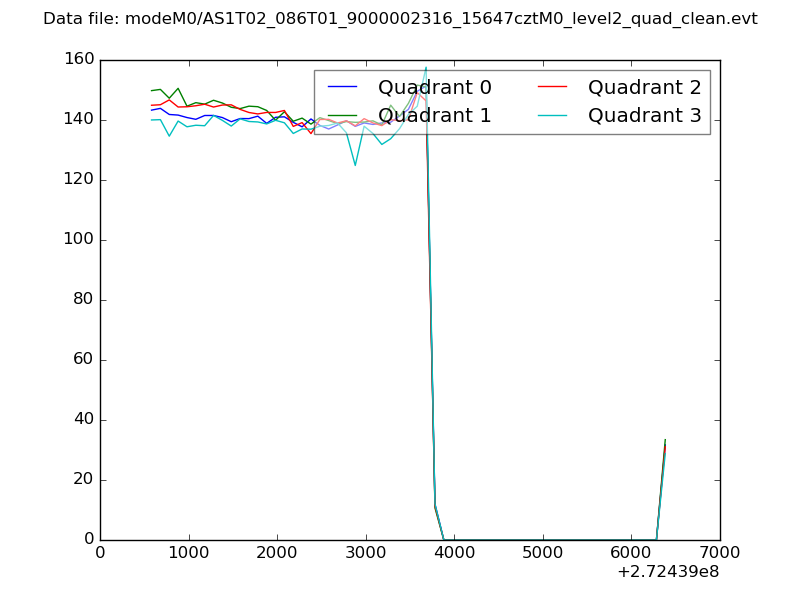 |
|
| Module-wise count rates for Quadrant A Data is divided into 100 sec bins |
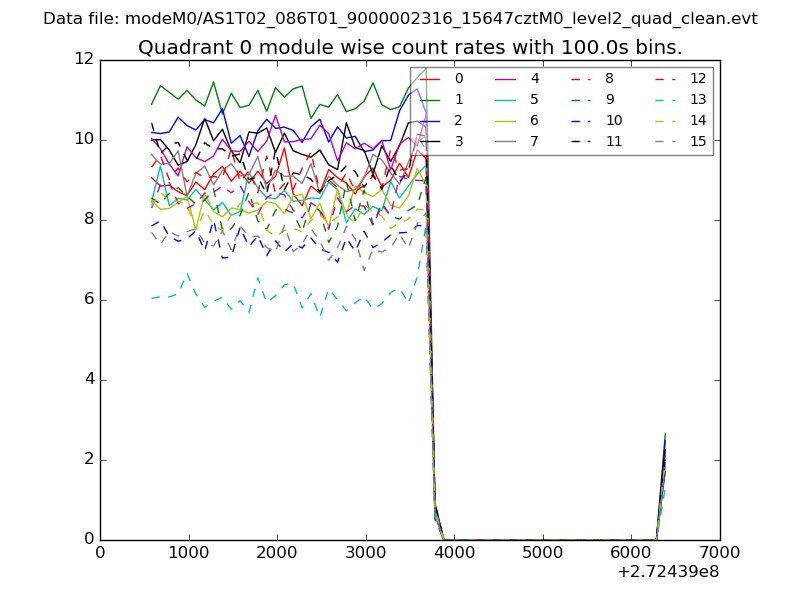 |
 |
| Module-wise count rates for Quadrant B Data is divided into 100 sec bins |
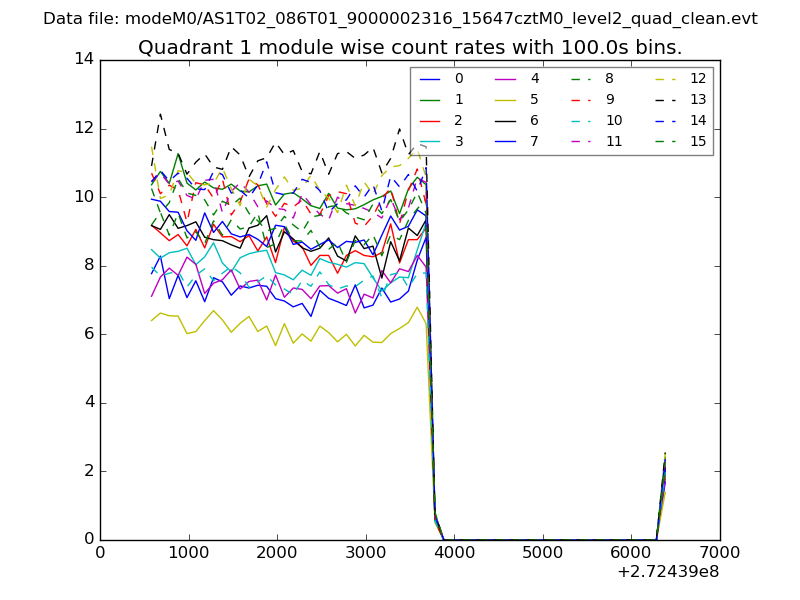 |
 |
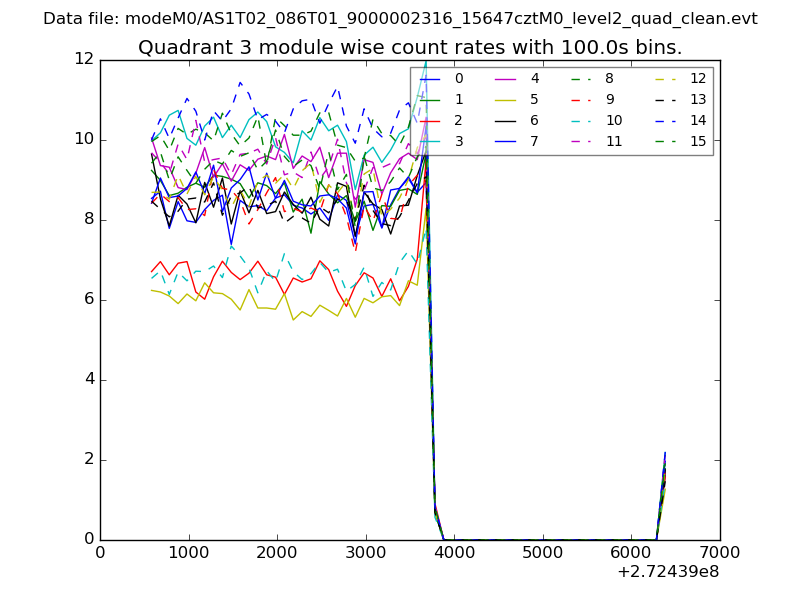
| Module-wise count rates for Quadrant C Data is divided into 100 sec bins |
 |
 |
| Module-wise count rates for Quadrant D Data is divided into 100 sec bins |
 |
 |
| Parameter | Plot |
|---|---|
| CZT HV Monitor | 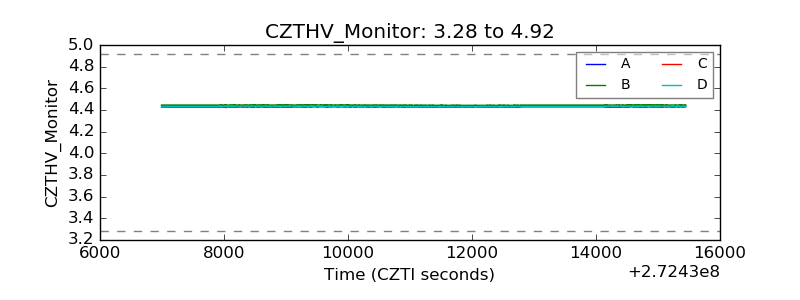 |
| D_VDD | 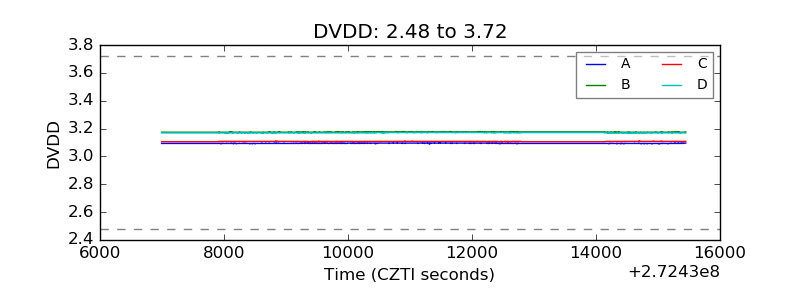 |
| Temperature 1 | 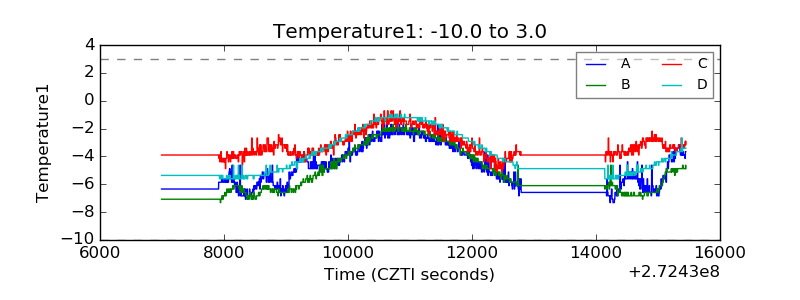 |
| Veto HV Monitor | 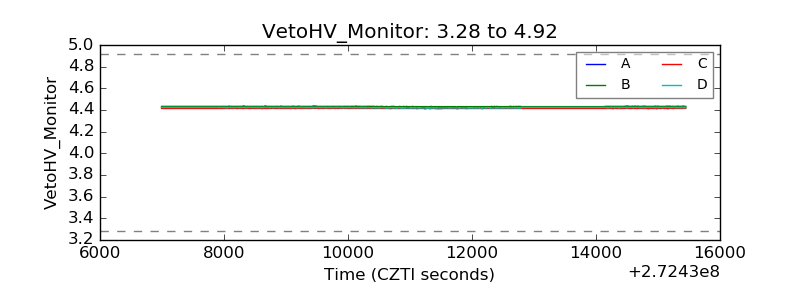 |
| Veto LLD | 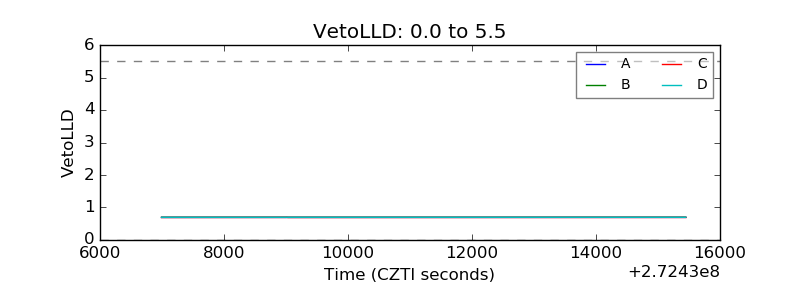 |
| Alpha Counter | 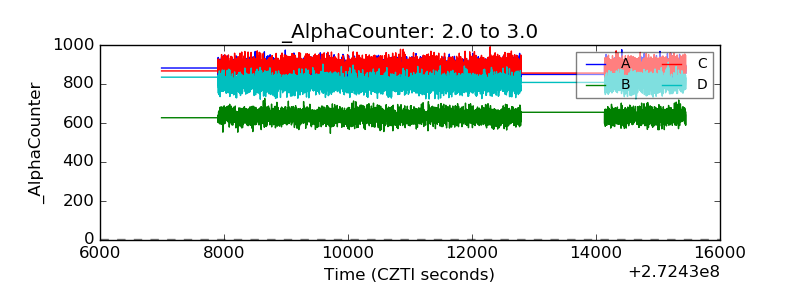 |
| _CPM_Rate | 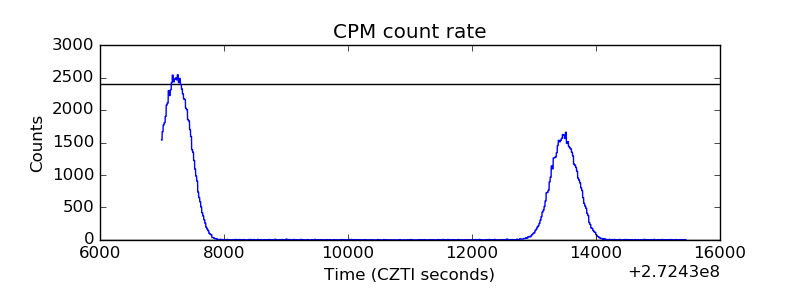 |
| CZT Counter | 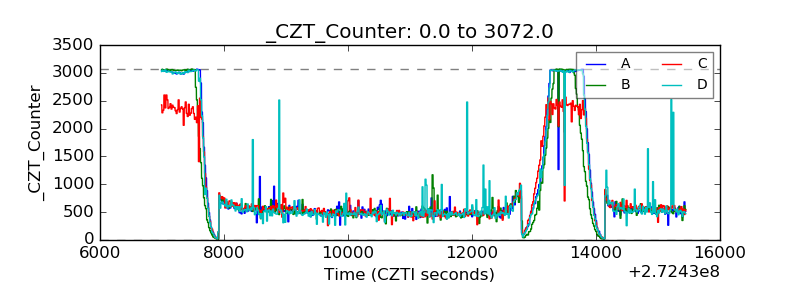 |
| +2.5 Volts monitor |  |
| +5 Volts monitor |  |
| _ROLL_ROT | 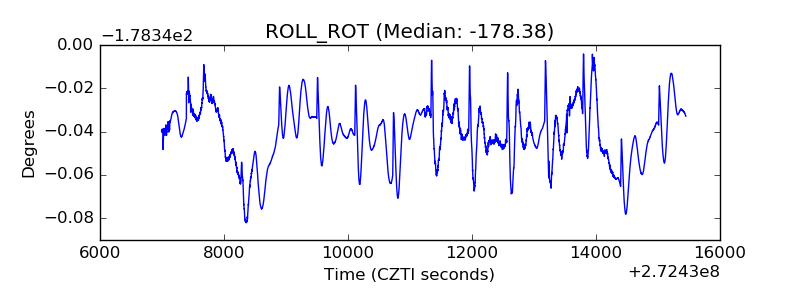 |
| _Roll_DEC | 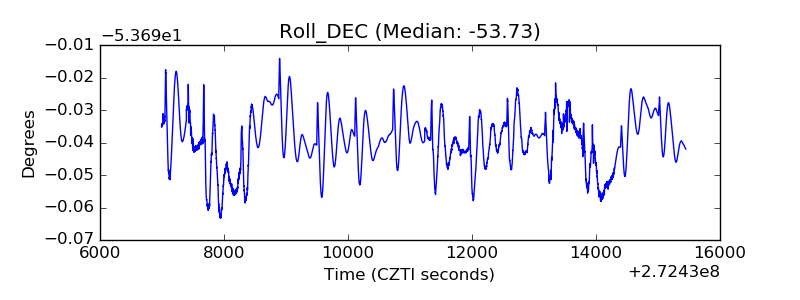 |
| _Roll_RA | 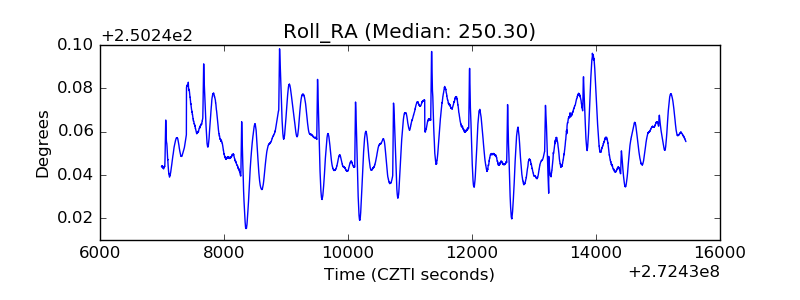 |
| Veto Counter | 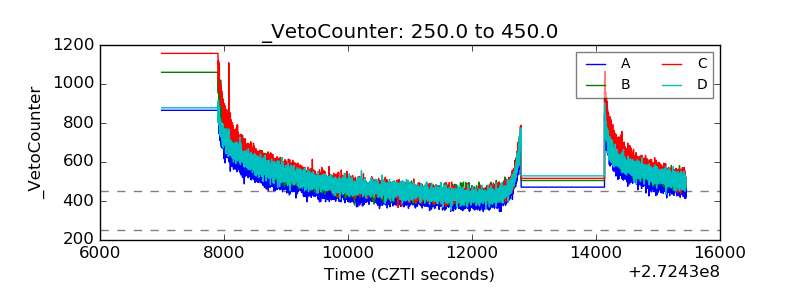 |