| Param | Original file | Final file |
|---|---|---|
| Filename | modeM0/AS1T02_086T01_9000002316_15648cztM0_level2.evt | modeM0/AS1T02_086T01_9000002316_15648cztM0_level2_quad_clean.evt |
| Size (bytes) | 471,744,000 | 91,157,760 |
| Size | 449.9 MB | 86.9 MB |
| Events in quadrant A | 3,278,825 | 584,136 |
| Events in quadrant B | 3,457,917 | 588,163 |
| Events in quadrant C | 3,301,540 | 580,300 |
| Events in quadrant D | 3,815,848 | 563,511 |
| Mode SS | |||
|---|---|---|---|
| Quadrant | BADHDUFLAG | Total packets | Discarded packets |
| A | 0 | 130 | 0 |
| B | 0 | 130 | 0 |
| C | 0 | 130 | 0 |
| D | 0 | 130 | 0 |
| Mode M9 | |||
|---|---|---|---|
| Quadrant | BADHDUFLAG | Total packets | Discarded packets |
| A | 0 | 14 | 0 |
| B | 0 | 14 | 0 |
| C | 0 | 14 | 0 |
| D | 0 | 15 | 0 |
| Mode M0 | |||
|---|---|---|---|
| Quadrant | BADHDUFLAG | Total packets | Discarded packets |
| A | 0 | 13503 | 3 |
| B | 0 | 13988 | 2 |
| C | 0 | 13619 | 2 |
| D | 0 | 15196 | 2 |
| Quadrant | Total seconds | Saturated seconds | Saturation percentage |
|---|---|---|---|
| A | 6367 | 103 | 1.617716% |
| B | 6367 | 171 | 2.685723% |
| C | 6367 | 166 | 2.607193% |
| D | 6367 | 299 | 4.696089% |
Noise dominated data is calculated using 1-second bins in cleaned event files. If a bin has >2000 counts, and if more than 50% of those come from <1% of pixels, then it is considered to be noise-dominated and hence unusable.
| Quadrant | # 1 sec bins | Bins with >0 counts | Bins with >2000 counts | High rate bins dominated by noise | Noise dominated (total time) | Noise dominated (detector-on time) | Marked lightcurve |
|---|---|---|---|---|---|---|---|
| A | 7593 | 6368 | 1 | 1 | 0.01% | 0.02% | 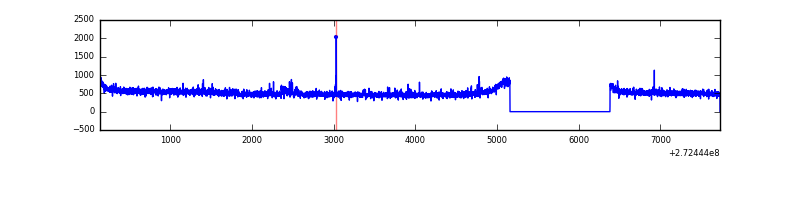 |
| B | 7593 | 6368 | 34 | 34 | 0.45% | 0.53% | 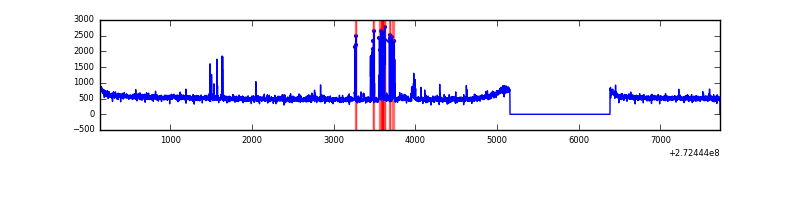 |
| C | 7593 | 6368 | 0 | 0 | 0.00% | 0.00% | 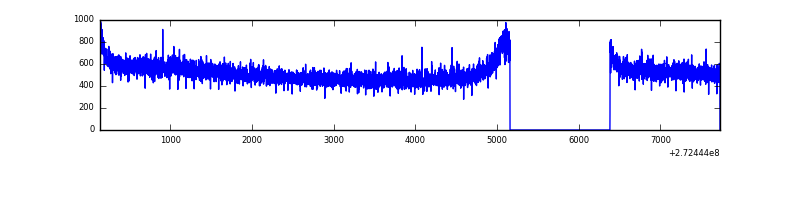 |
| D | 7593 | 6368 | 206 | 206 | 2.71% | 3.23% | 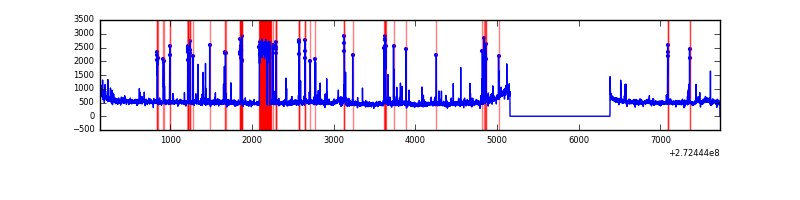 |
Top three noisy pixels from each quadrant. If the there are fewer than three noisy pixels in the level2.evt file, extra rows are filled as -1
| Pixel properties | Quadrant properties | ||||||
|---|---|---|---|---|---|---|---|
| Quadrant | DetID | PixID | Counts | Sigma | Mean | Median | Sigma |
| A | 15 | 157 | 56823 | 338.39 | 833 | 819 | 165.5 |
| A | 13 | 248 | 7924 | 42.93 | 833 | 819 | 165.5 |
| A | 0 | 226 | 7420 | 39.89 | 833 | 819 | 165.5 |
| B | 0 | 189 | 140316 | 903.96 | 827 | 808 | 154.3 |
| B | 3 | 209 | 34548 | 218.62 | 827 | 808 | 154.3 |
| B | 4 | 216 | 22740 | 142.11 | 827 | 808 | 154.3 |
| C | 14 | 238 | 126198 | 678.16 | 806 | 812 | 184.9 |
| C | 3 | 233 | 27239 | 142.93 | 806 | 812 | 184.9 |
| C | 13 | 61 | 5671 | 26.28 | 806 | 812 | 184.9 |
| D | 1 | 52 | 663544 | 3398.83 | 810 | 786 | 195.0 |
| D | 4 | 95 | 35748 | 179.3 | 810 | 786 | 195.0 |
| D | 2 | 234 | 21732 | 107.42 | 810 | 786 | 195.0 |
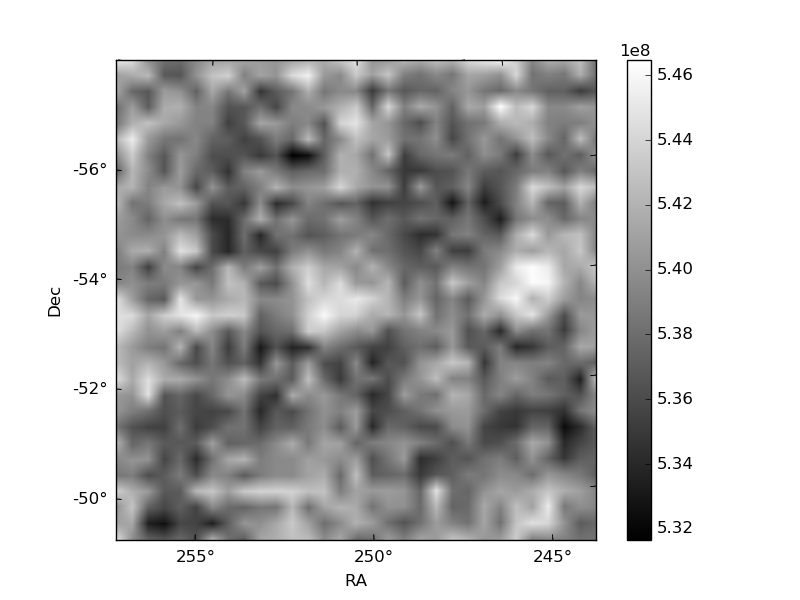
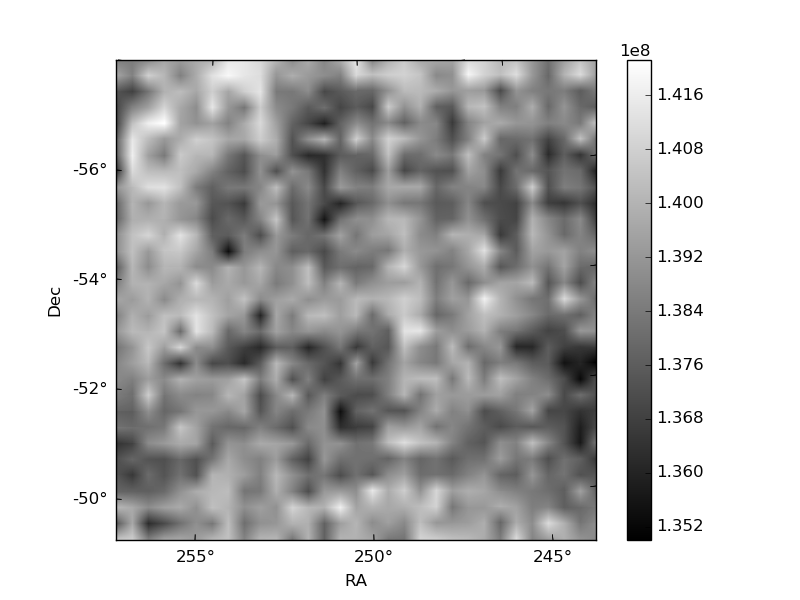
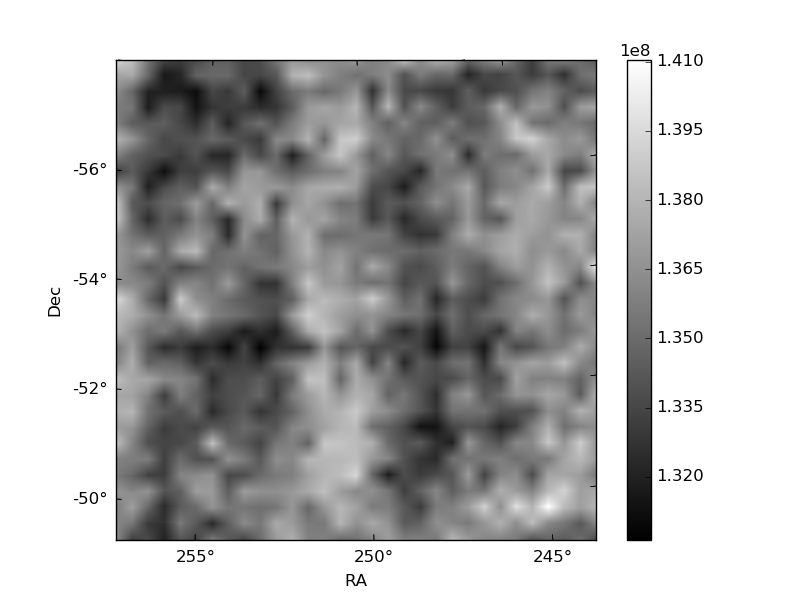
Histogram calculated using DETX and DETY for each event in the final _common_clean file
| Quadrant A | 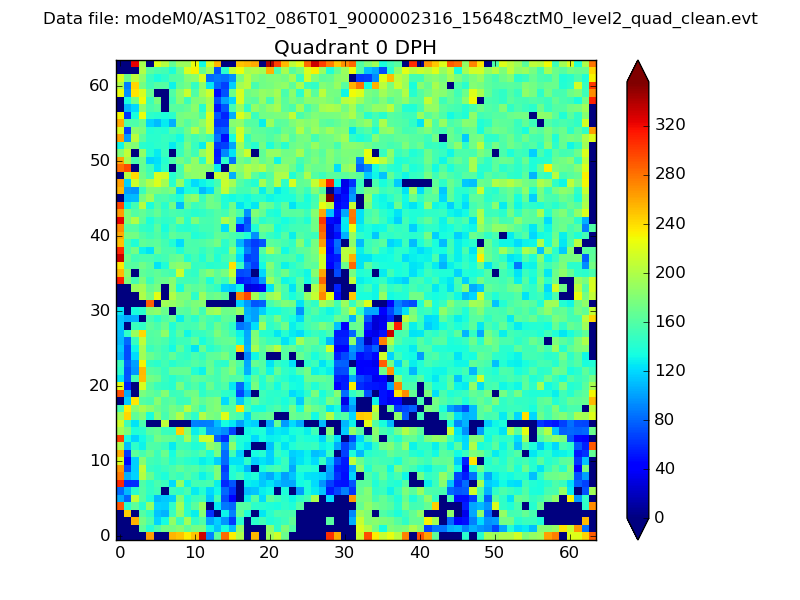 |
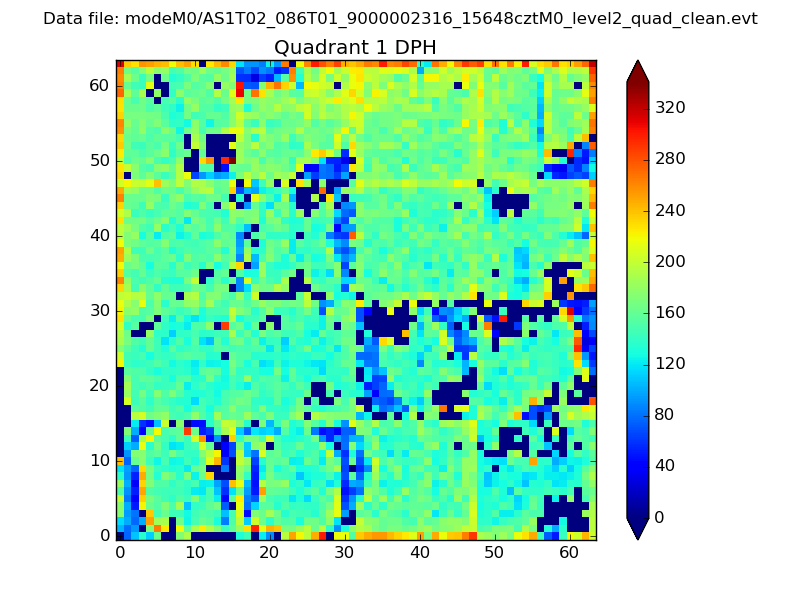 |
Quadrant B |
|---|---|---|---|
| Quadrant D | 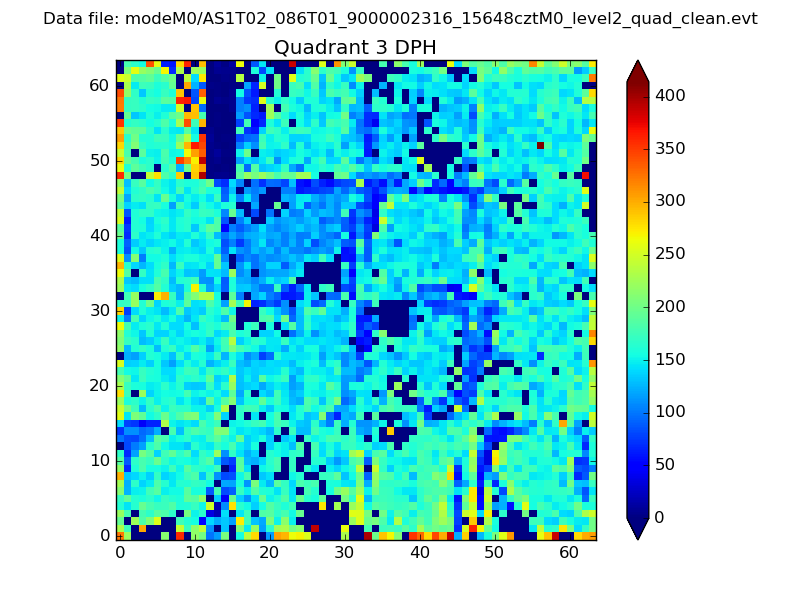 |
 |
Quadrant C |
| Plot type | Count rate plots | Images |
|---|---|---|
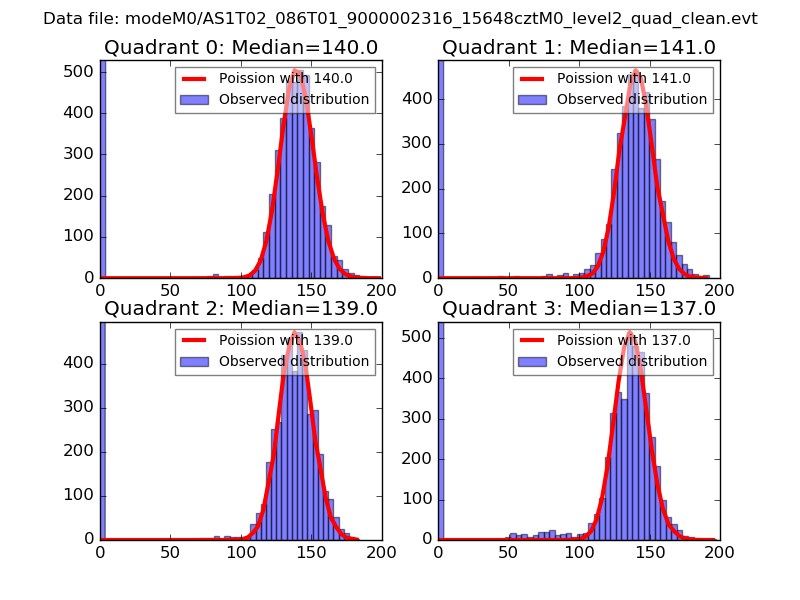
| Comparison with Poisson distribution Blue bars denote a histogram of data divided into 1 sec bins. Red curve is a Poisson curve with rate = median count rate of data. |
 |
 |
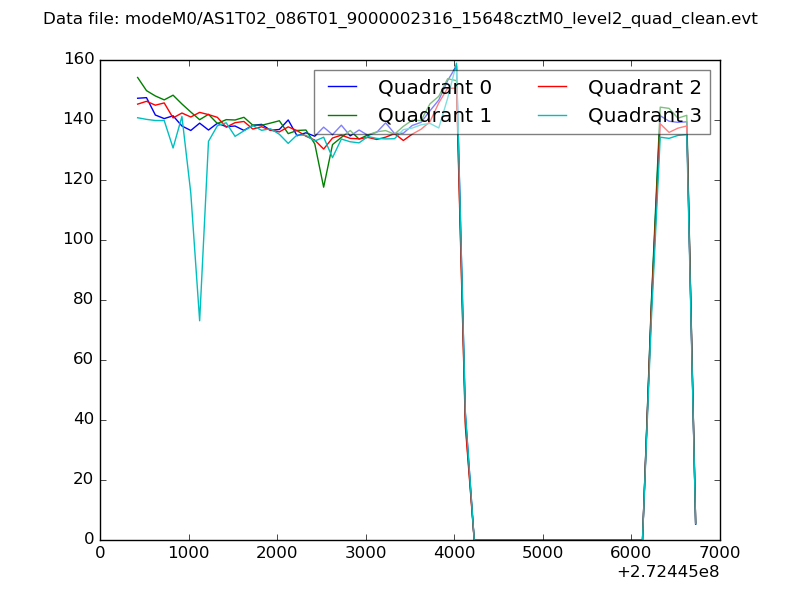
| Quadrant-wise count rates Data is divided into 100 sec bins |
 |
|
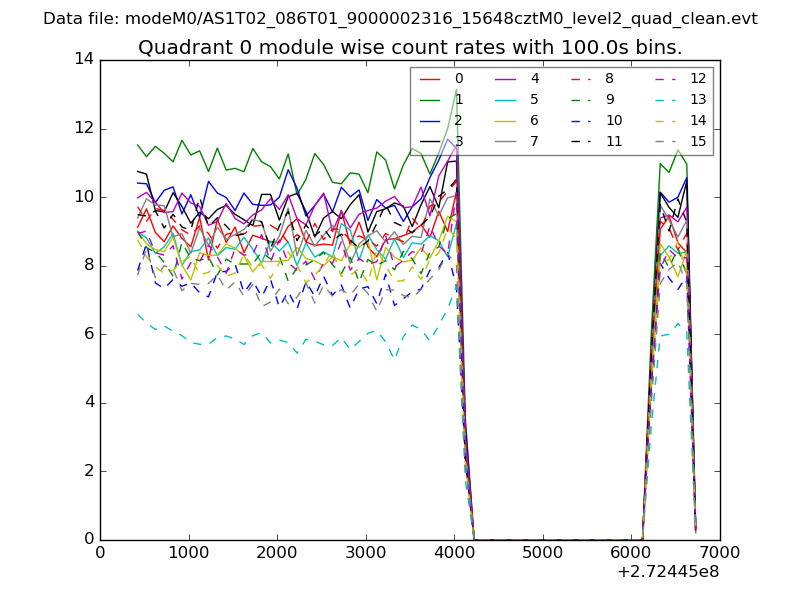
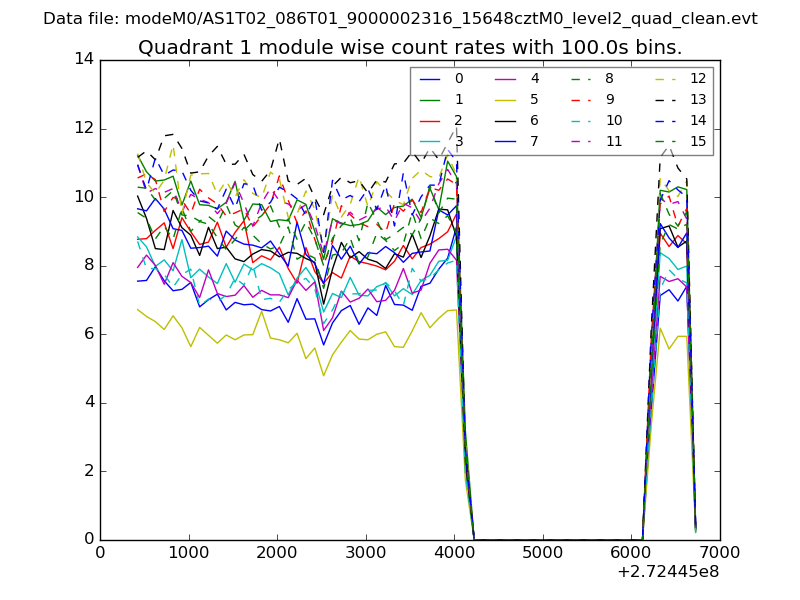
| Module-wise count rates for Quadrant A Data is divided into 100 sec bins |
 |
 |
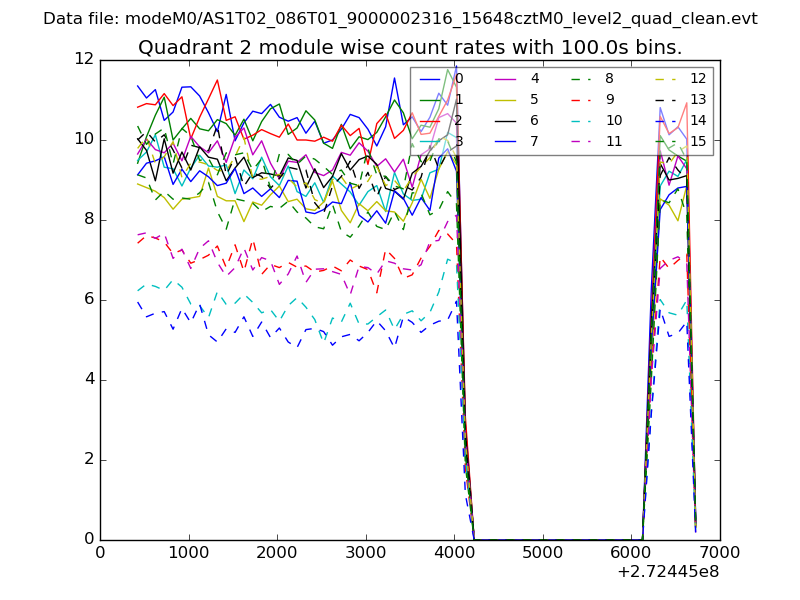
| Module-wise count rates for Quadrant B Data is divided into 100 sec bins |
 |
 |
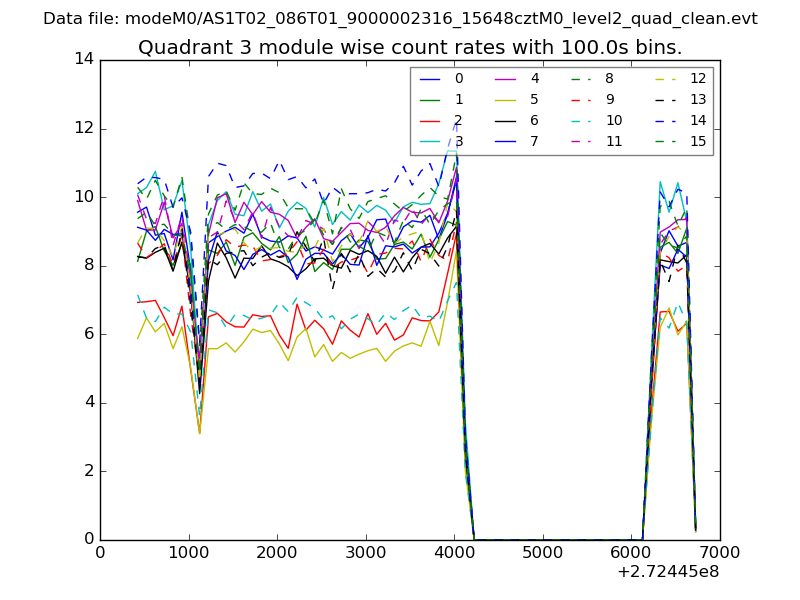
| Module-wise count rates for Quadrant C Data is divided into 100 sec bins |
 |
 |
| Module-wise count rates for Quadrant D Data is divided into 100 sec bins |
 |
 |
| Parameter | Plot |
|---|---|
| CZT HV Monitor | 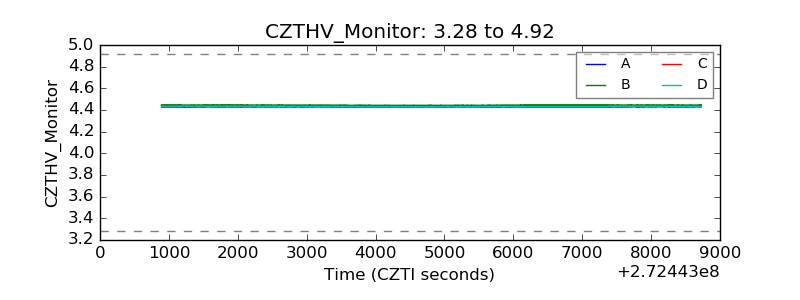 |
| D_VDD | 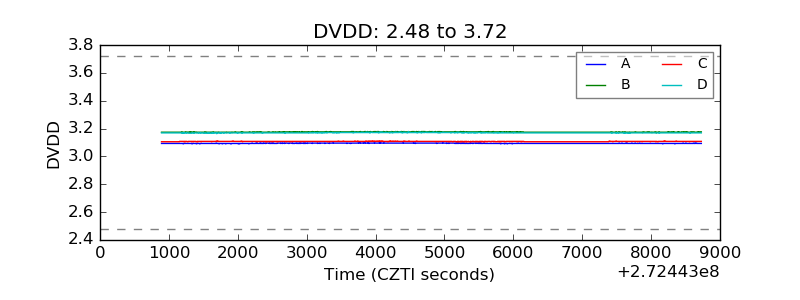 |
| Temperature 1 | 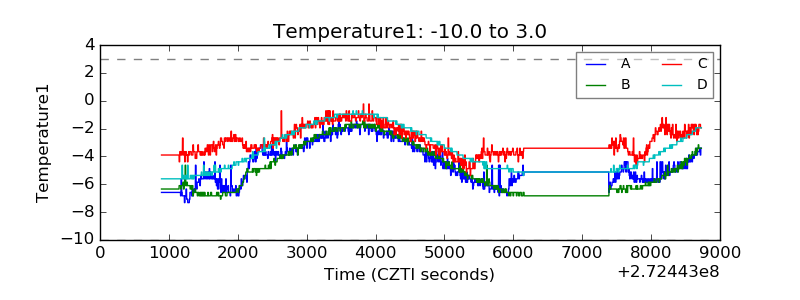 |
| Veto HV Monitor | 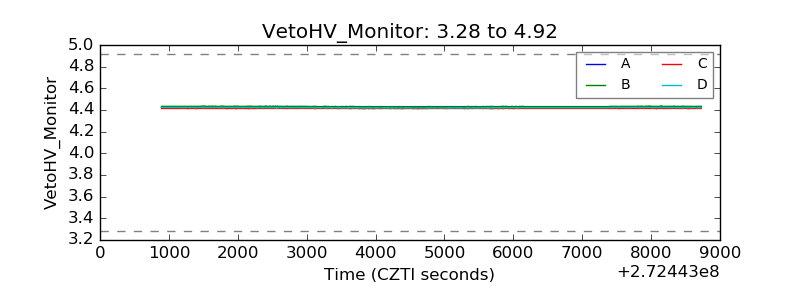 |
| Veto LLD | 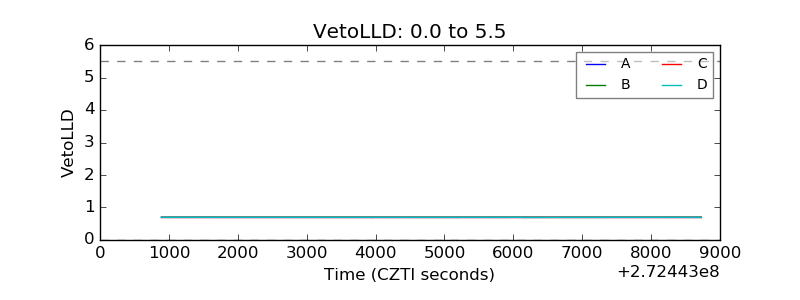 |
| Alpha Counter | 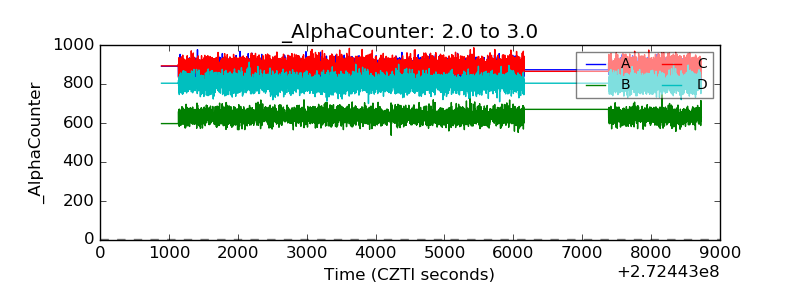 |
| _CPM_Rate | 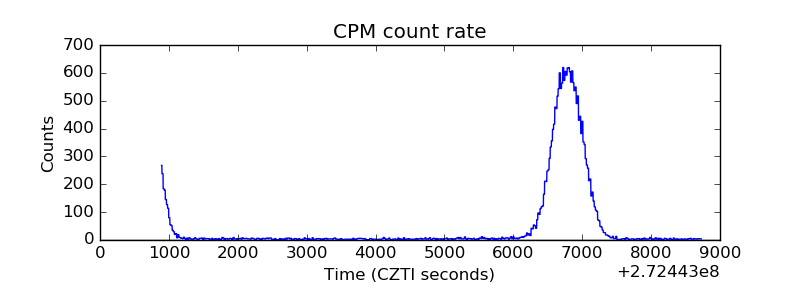 |
| CZT Counter | 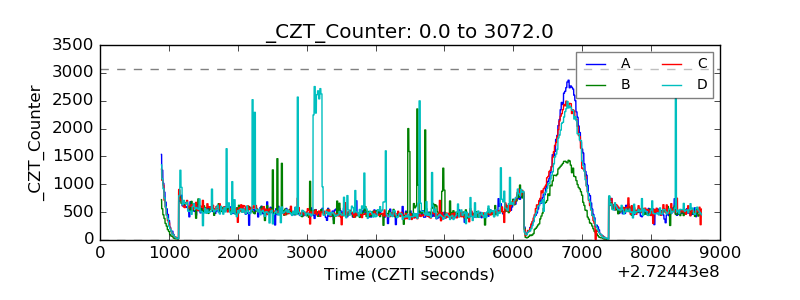 |
| +2.5 Volts monitor | 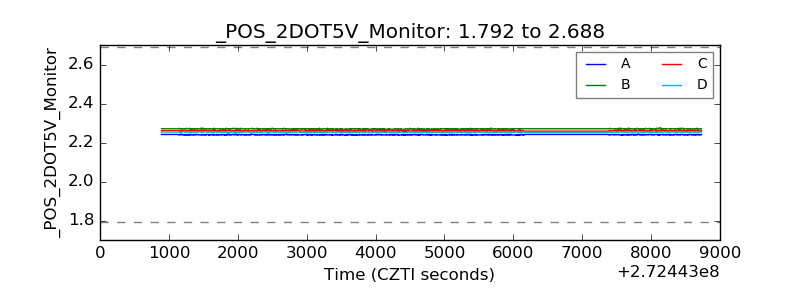 |
| +5 Volts monitor |  |
| _ROLL_ROT | 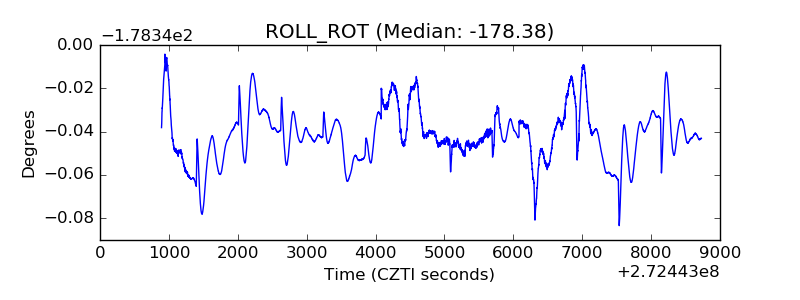 |
| _Roll_DEC |  |
| _Roll_RA | 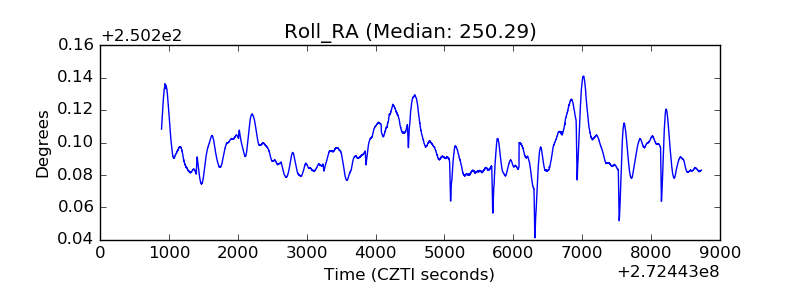 |
| Veto Counter | 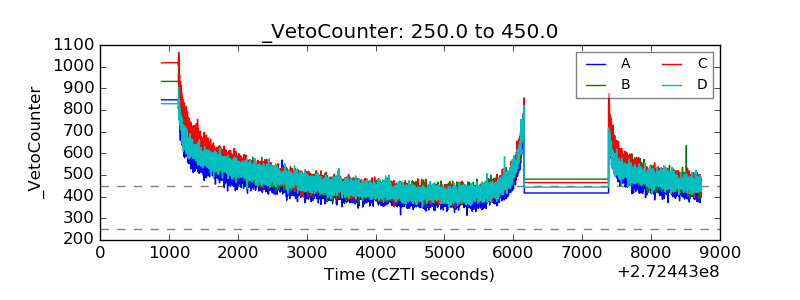 |