| Param | Original file | Final file |
|---|---|---|
| Filename | modeM0/AS1T02_086T01_9000002316_15650cztM0_level2.evt | modeM0/AS1T02_086T01_9000002316_15650cztM0_level2_quad_clean.evt |
| Size (bytes) | 550,860,480 | 104,515,200 |
| Size | 525.3 MB | 99.7 MB |
| Events in quadrant A | 3,481,100 | 672,585 |
| Events in quadrant B | 3,539,821 | 681,738 |
| Events in quadrant C | 3,559,308 | 669,049 |
| Events in quadrant D | 5,611,758 | 638,179 |
| Mode SS | |||
|---|---|---|---|
| Quadrant | BADHDUFLAG | Total packets | Discarded packets |
| A | 0 | 146 | 0 |
| B | 0 | 146 | 0 |
| C | 0 | 146 | 0 |
| D | 0 | 146 | 0 |
| Mode M9 | |||
|---|---|---|---|
| Quadrant | BADHDUFLAG | Total packets | Discarded packets |
| A | 0 | 12 | 0 |
| B | 0 | 12 | 0 |
| C | 0 | 12 | 0 |
| D | 0 | 13 | 0 |
| Mode M0 | |||
|---|---|---|---|
| Quadrant | BADHDUFLAG | Total packets | Discarded packets |
| A | 0 | 15120 | 3 |
| B | 0 | 15059 | 2 |
| C | 0 | 15056 | 2 |
| D | 0 | 21370 | 2 |
| Quadrant | Total seconds | Saturated seconds | Saturation percentage |
|---|---|---|---|
| A | 7236 | 168 | 2.321725% |
| B | 7236 | 174 | 2.404643% |
| C | 7236 | 222 | 3.067993% |
| D | 7236 | 447 | 6.177446% |
Noise dominated data is calculated using 1-second bins in cleaned event files. If a bin has >2000 counts, and if more than 50% of those come from <1% of pixels, then it is considered to be noise-dominated and hence unusable.
| Quadrant | # 1 sec bins | Bins with >0 counts | Bins with >2000 counts | High rate bins dominated by noise | Noise dominated (total time) | Noise dominated (detector-on time) | Marked lightcurve |
|---|---|---|---|---|---|---|---|
| A | 7697 | 7237 | 3 | 3 | 0.04% | 0.04% | 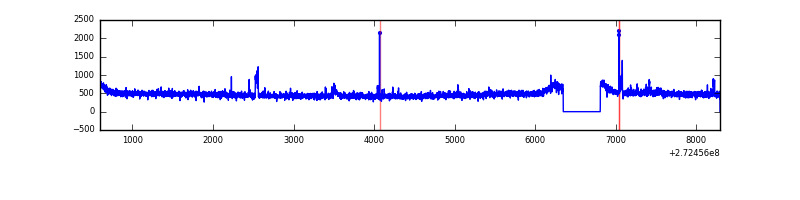 |
| B | 7697 | 7237 | 2 | 2 | 0.03% | 0.03% | 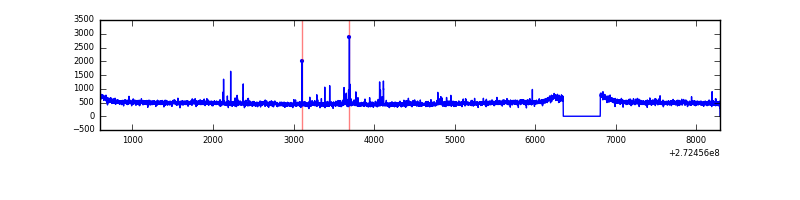 |
| C | 7697 | 7237 | 0 | 0 | 0.00% | 0.00% | 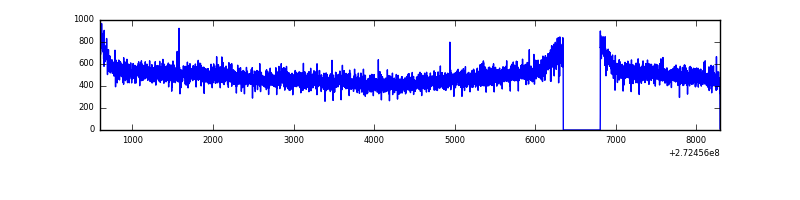 |
| D | 7697 | 7237 | 418 | 418 | 5.43% | 5.78% | 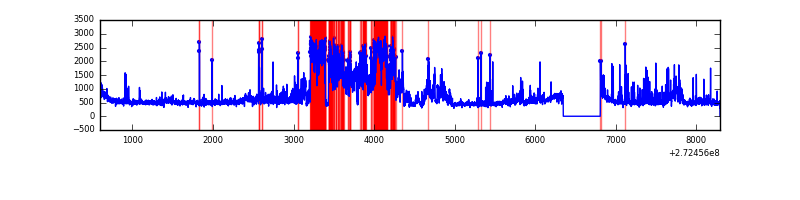 |
Top three noisy pixels from each quadrant. If the there are fewer than three noisy pixels in the level2.evt file, extra rows are filled as -1
| Pixel properties | Quadrant properties | ||||||
|---|---|---|---|---|---|---|---|
| Quadrant | DetID | PixID | Counts | Sigma | Mean | Median | Sigma |
| A | 15 | 157 | 46980 | 257.12 | 882 | 862 | 179.4 |
| A | 13 | 248 | 18287 | 97.15 | 882 | 862 | 179.4 |
| A | 4 | 2 | 14130 | 73.97 | 882 | 862 | 179.4 |
| B | 0 | 219 | 19901 | 114.22 | 879 | 855 | 166.8 |
| B | 12 | 111 | 19517 | 111.91 | 879 | 855 | 166.8 |
| B | 0 | 189 | 18289 | 104.55 | 879 | 855 | 166.8 |
| C | 14 | 238 | 132558 | 672.47 | 849 | 854 | 195.8 |
| C | 3 | 233 | 111674 | 565.84 | 849 | 854 | 195.8 |
| C | 13 | 61 | 6081 | 26.69 | 849 | 854 | 195.8 |
| D | 1 | 52 | 2236303 | 10792.56 | 856 | 832 | 207.1 |
| D | 12 | 110 | 42641 | 201.85 | 856 | 832 | 207.1 |
| D | 2 | 234 | 29667 | 139.21 | 856 | 832 | 207.1 |
Histogram calculated using DETX and DETY for each event in the final _common_clean file
| Quadrant A |  |
 |
Quadrant B |
|---|---|---|---|
| Quadrant D |  |
 |
Quadrant C |
| Plot type | Count rate plots | Images |
|---|---|---|
| Comparison with Poisson distribution Blue bars denote a histogram of data divided into 1 sec bins. Red curve is a Poisson curve with rate = median count rate of data. |
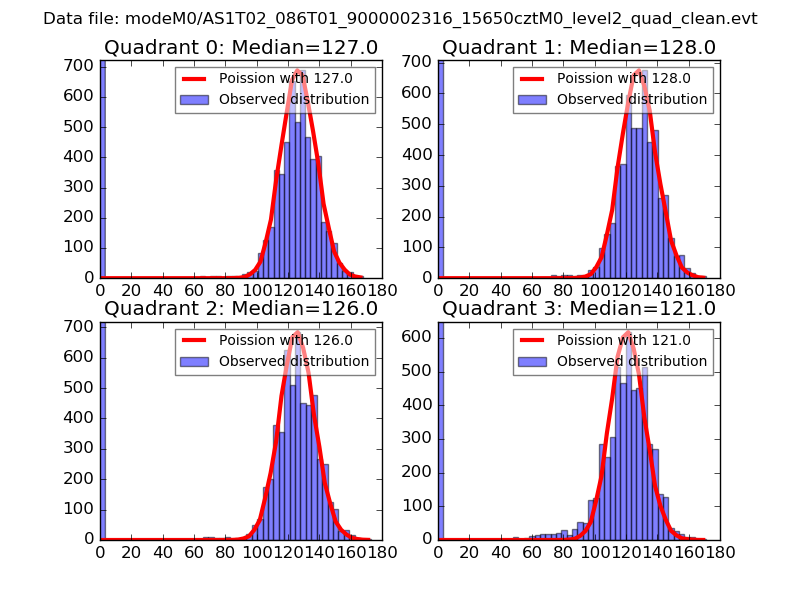 |
 |
| Quadrant-wise count rates Data is divided into 100 sec bins |
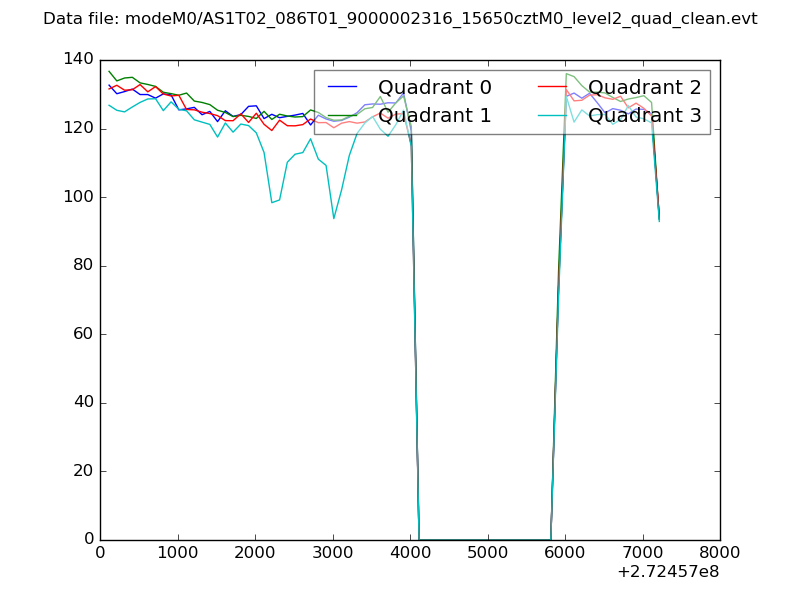 |
|
| Module-wise count rates for Quadrant A Data is divided into 100 sec bins |
 |
 |
| Module-wise count rates for Quadrant B Data is divided into 100 sec bins |
 |
 |
| Module-wise count rates for Quadrant C Data is divided into 100 sec bins |
 |
 |
| Module-wise count rates for Quadrant D Data is divided into 100 sec bins |
 |
 |
| Parameter | Plot |
|---|---|
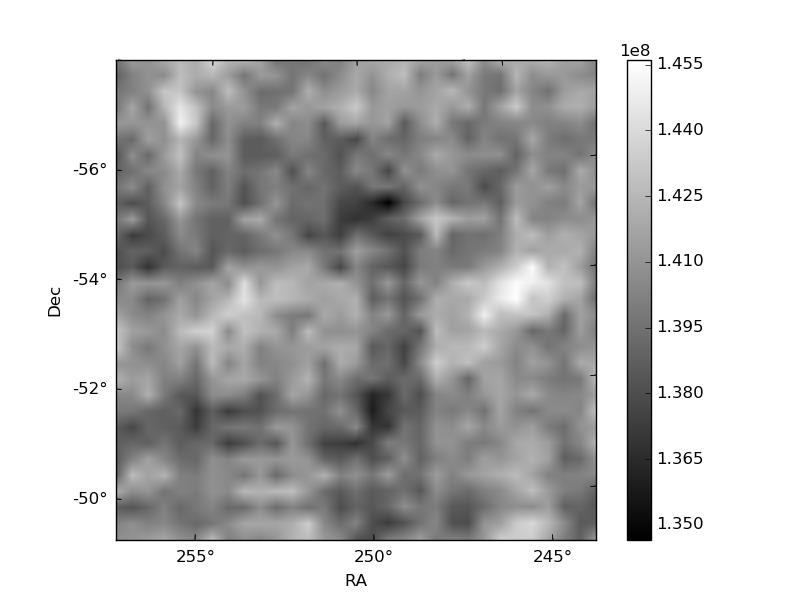
| CZT HV Monitor |  |
| D_VDD | 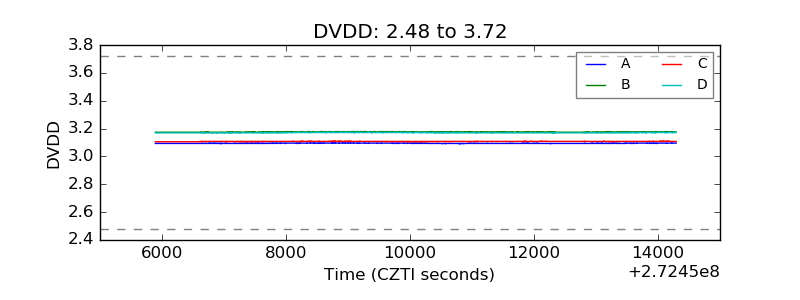 |
| Temperature 1 | 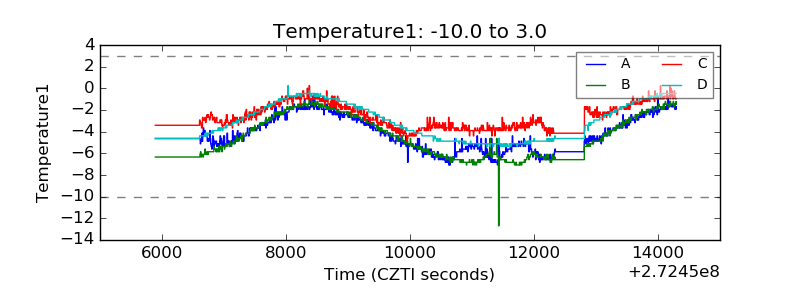 |
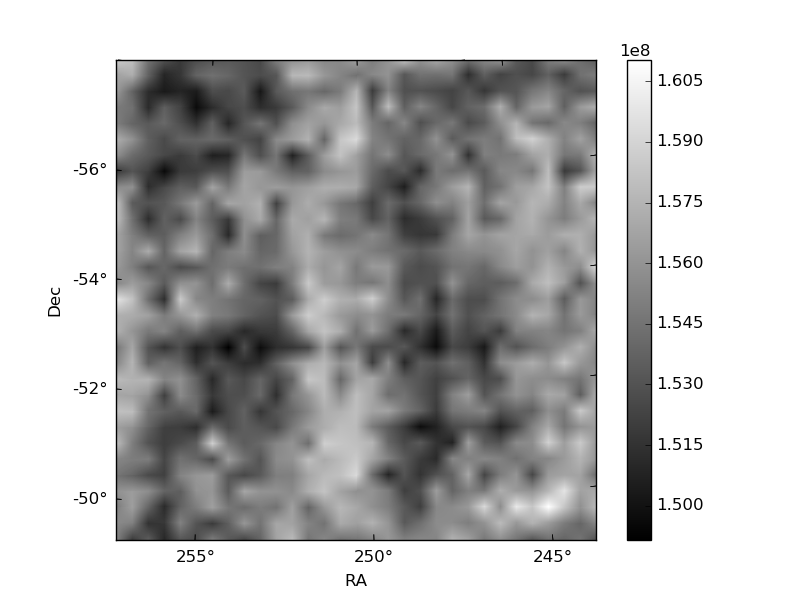
| Veto HV Monitor |  |
| Veto LLD |  |
| Alpha Counter |  |
| _CPM_Rate |  |
| CZT Counter |  |
| +2.5 Volts monitor |  |
| +5 Volts monitor |  |
| _ROLL_ROT |  |
| _Roll_DEC |  |
| _Roll_RA |  |
| Veto Counter |  |