| Param | Original file | Final file |
|---|---|---|
| Filename | modeM0/AS1T02_086T01_9000002316_15651cztM0_level2.evt | modeM0/AS1T02_086T01_9000002316_15651cztM0_level2_quad_clean.evt |
| Size (bytes) | 533,643,840 | 103,236,480 |
| Size | 508.9 MB | 98.5 MB |
| Events in quadrant A | 3,430,532 | 666,207 |
| Events in quadrant B | 3,578,743 | 672,309 |
| Events in quadrant C | 3,439,978 | 661,043 |
| Events in quadrant D | 5,224,228 | 626,606 |
| Mode SS | |||
|---|---|---|---|
| Quadrant | BADHDUFLAG | Total packets | Discarded packets |
| A | 0 | 144 | 0 |
| B | 0 | 144 | 0 |
| C | 0 | 144 | 0 |
| D | 0 | 144 | 0 |
| Mode M9 | |||
|---|---|---|---|
| Quadrant | BADHDUFLAG | Total packets | Discarded packets |
| A | 0 | 2 | 0 |
| B | 0 | 2 | 0 |
| C | 0 | 2 | 0 |
| D | 0 | 2 | 0 |
| Mode M0 | |||
|---|---|---|---|
| Quadrant | BADHDUFLAG | Total packets | Discarded packets |
| A | 0 | 15028 | 2 |
| B | 0 | 15199 | 1 |
| C | 0 | 14863 | 1 |
| D | 0 | 20380 | 1 |
| Quadrant | Total seconds | Saturated seconds | Saturation percentage |
|---|---|---|---|
| A | 7191 | 163 | 2.266722% |
| B | 7191 | 156 | 2.169378% |
| C | 7191 | 146 | 2.030316% |
| D | 7191 | 484 | 6.730636% |
Noise dominated data is calculated using 1-second bins in cleaned event files. If a bin has >2000 counts, and if more than 50% of those come from <1% of pixels, then it is considered to be noise-dominated and hence unusable.
| Quadrant | # 1 sec bins | Bins with >0 counts | Bins with >2000 counts | High rate bins dominated by noise | Noise dominated (total time) | Noise dominated (detector-on time) | Marked lightcurve |
|---|---|---|---|---|---|---|---|
| A | 7337 | 7192 | 17 | 17 | 0.23% | 0.24% | 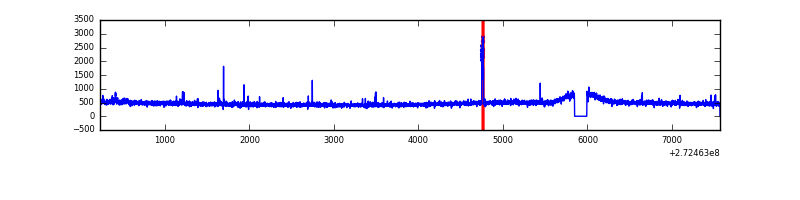 |
| B | 7337 | 7192 | 0 | 0 | 0.00% | 0.00% | 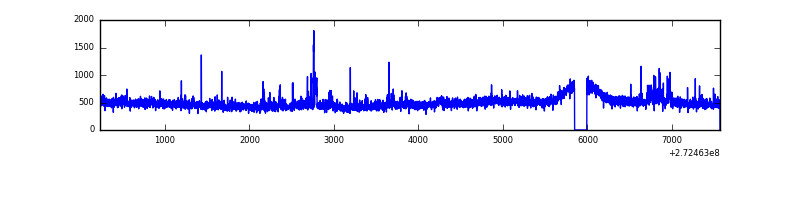 |
| C | 7337 | 7193 | 0 | 0 | 0.00% | 0.00% | 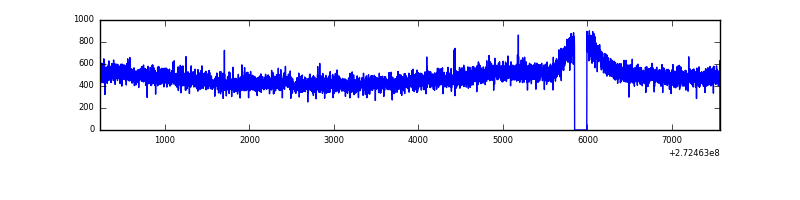 |
| D | 7337 | 7192 | 382 | 382 | 5.21% | 5.31% | 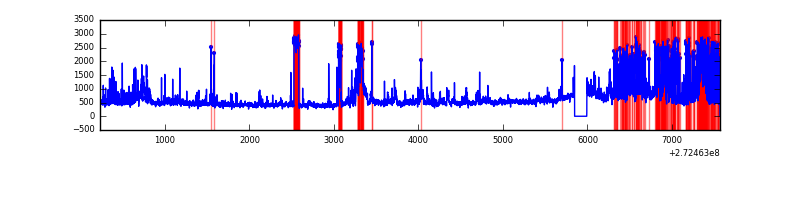 |
Top three noisy pixels from each quadrant. If the there are fewer than three noisy pixels in the level2.evt file, extra rows are filled as -1
| Pixel properties | Quadrant properties | ||||||
|---|---|---|---|---|---|---|---|
| Quadrant | DetID | PixID | Counts | Sigma | Mean | Median | Sigma |
| A | 15 | 69 | 48467 | 270.43 | 868 | 848 | 176.1 |
| A | 15 | 157 | 31228 | 172.53 | 868 | 848 | 176.1 |
| A | 0 | 226 | 7962 | 40.4 | 868 | 848 | 176.1 |
| B | 3 | 64 | 64643 | 384.07 | 865 | 845 | 166.1 |
| B | 3 | 209 | 44209 | 261.06 | 865 | 845 | 166.1 |
| B | 0 | 214 | 25416 | 147.92 | 865 | 845 | 166.1 |
| C | 14 | 238 | 127899 | 652.83 | 833 | 836 | 194.6 |
| C | 3 | 233 | 50956 | 257.51 | 833 | 836 | 194.6 |
| C | 7 | 247 | 6820 | 30.74 | 833 | 836 | 194.6 |
| D | 1 | 52 | 1970373 | 9722.95 | 834 | 807 | 202.6 |
| D | 2 | 234 | 30729 | 147.71 | 834 | 807 | 202.6 |
| D | 12 | 110 | 28210 | 135.28 | 834 | 807 | 202.6 |
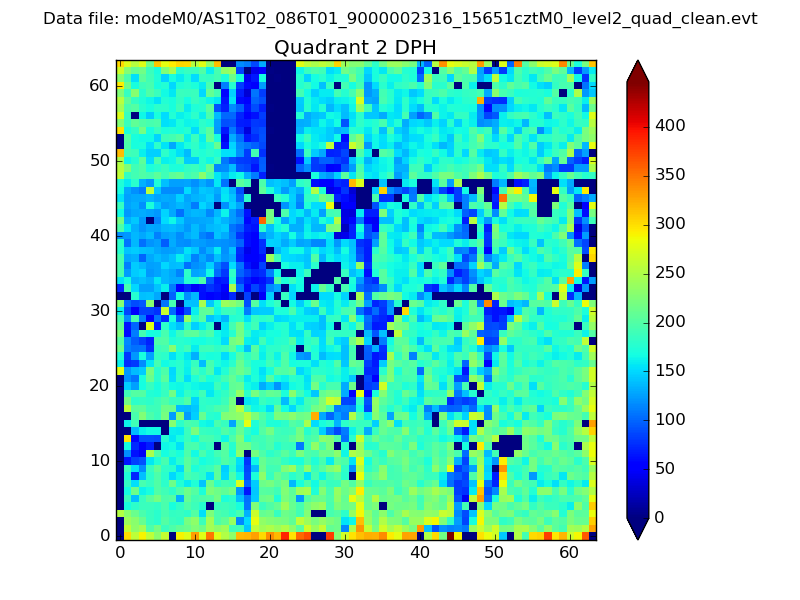
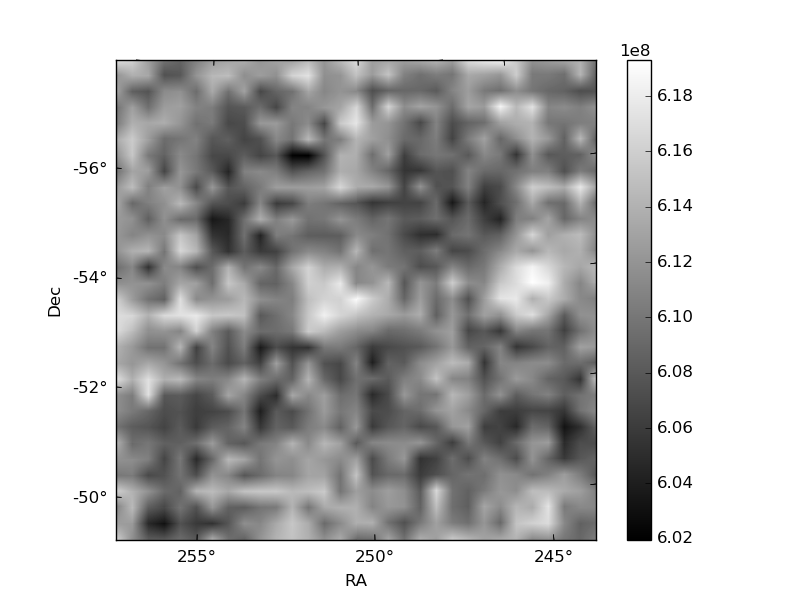
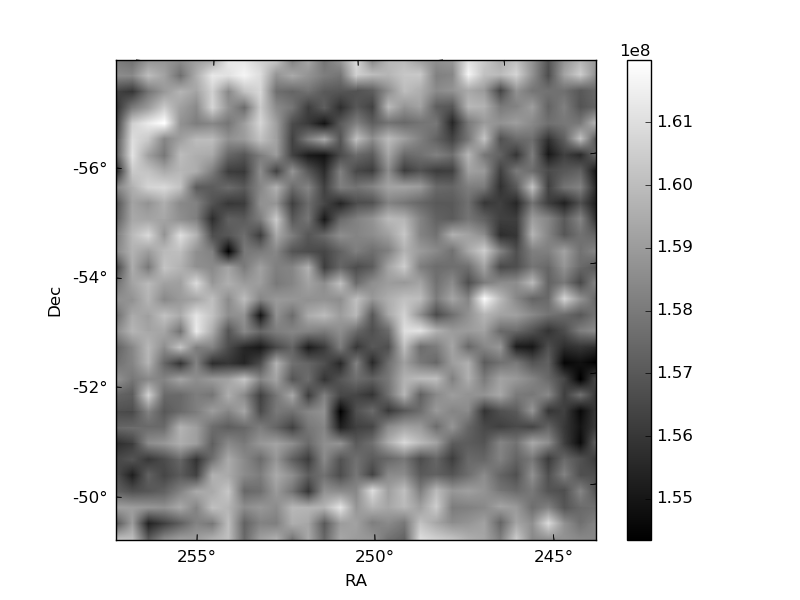
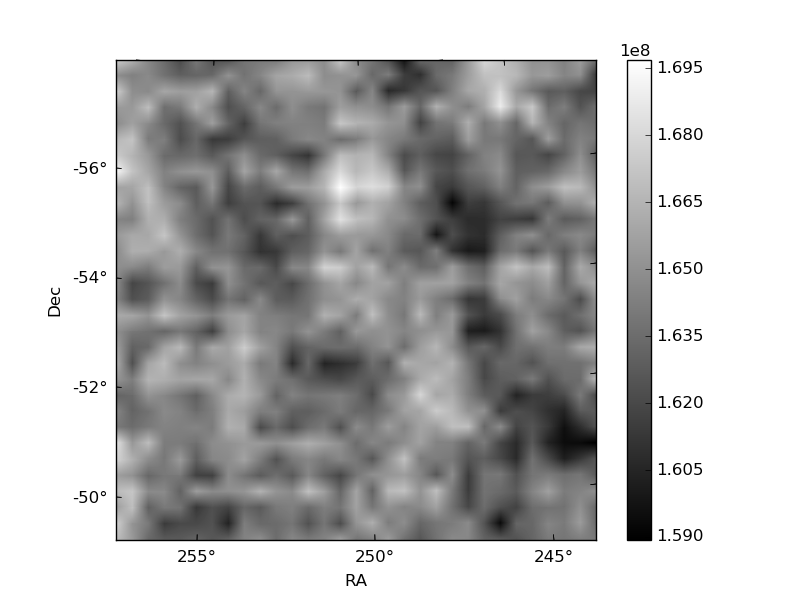
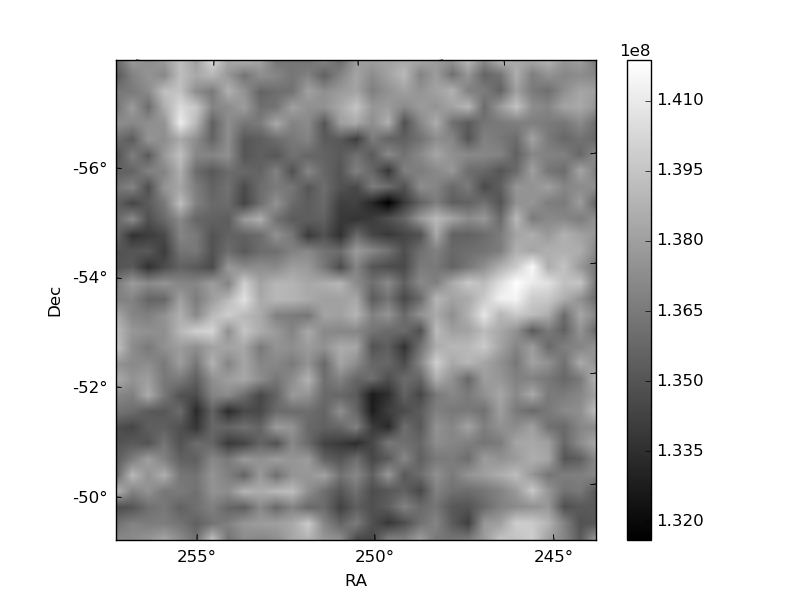
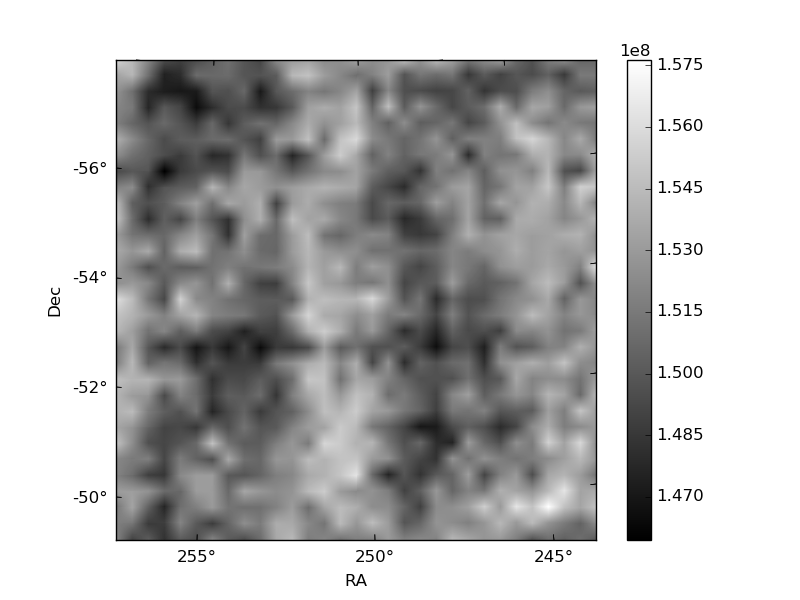
Histogram calculated using DETX and DETY for each event in the final _common_clean file
| Quadrant A | 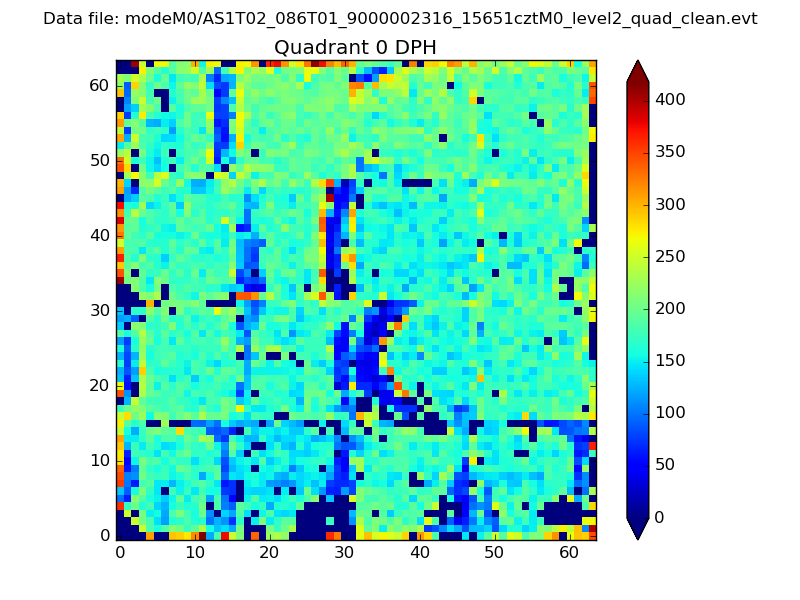 |
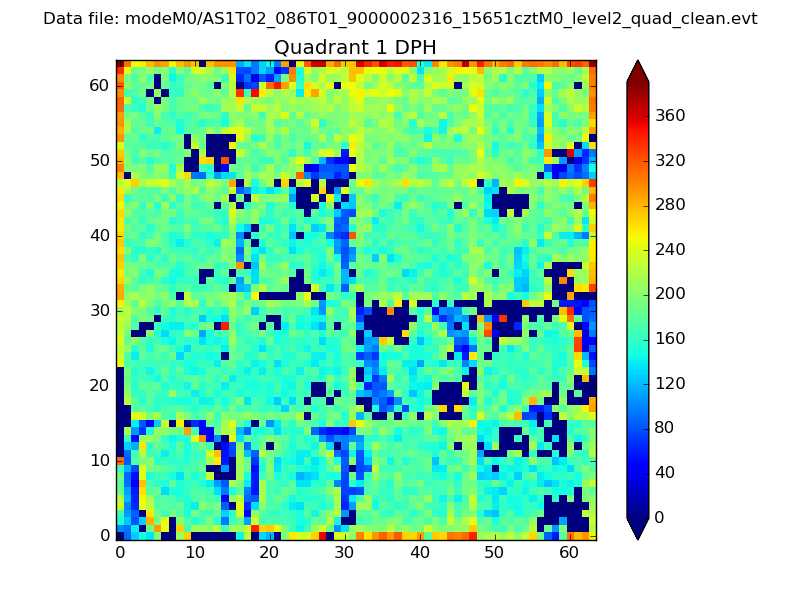 |
Quadrant B |
|---|---|---|---|
| Quadrant D | 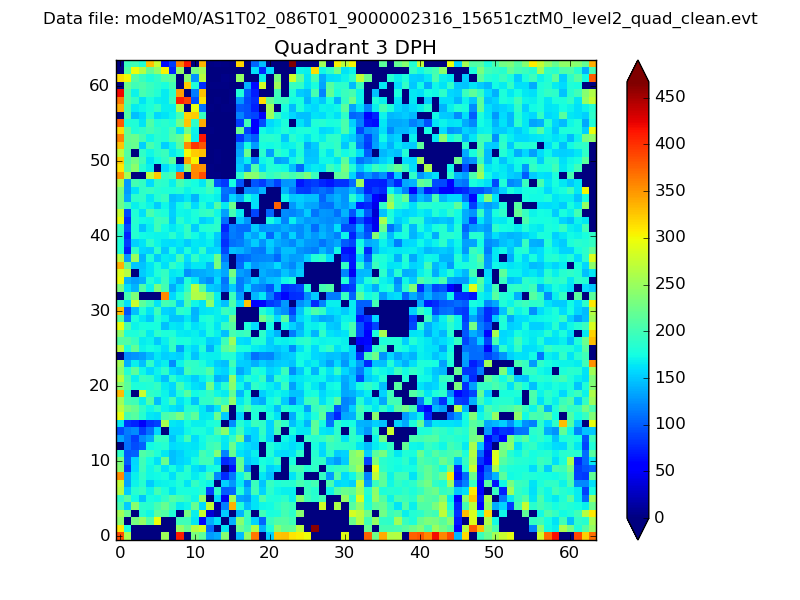 |
 |
Quadrant C |
| Plot type | Count rate plots | Images |
|---|---|---|
| Comparison with Poisson distribution Blue bars denote a histogram of data divided into 1 sec bins. Red curve is a Poisson curve with rate = median count rate of data. |
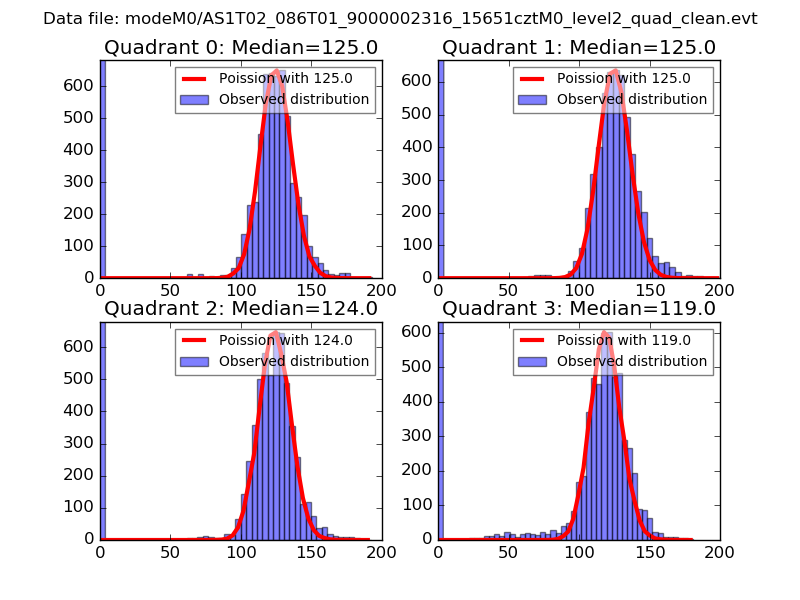 |
 |
| Quadrant-wise count rates Data is divided into 100 sec bins |
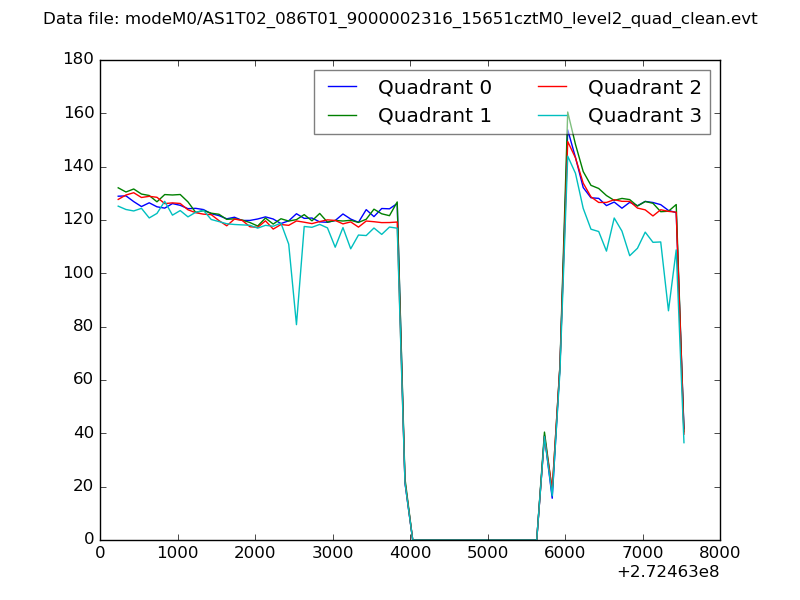 |
|
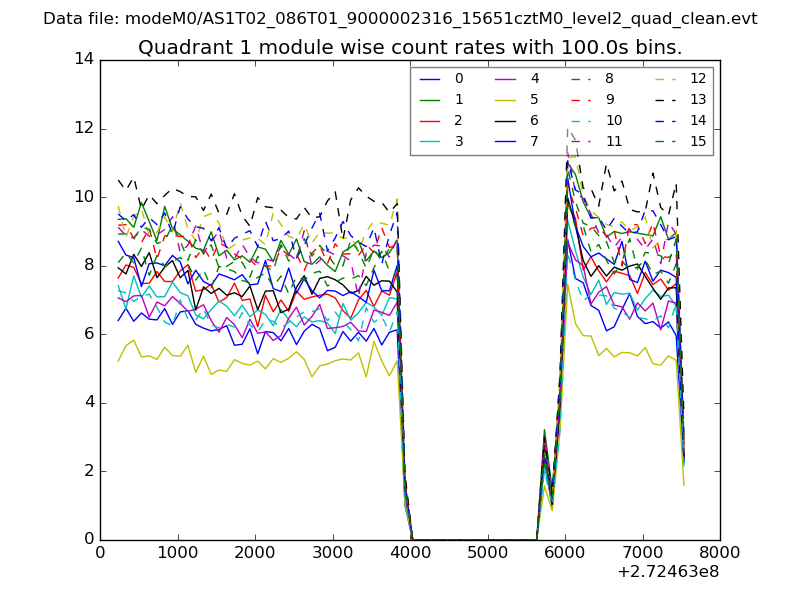
| Module-wise count rates for Quadrant A Data is divided into 100 sec bins |
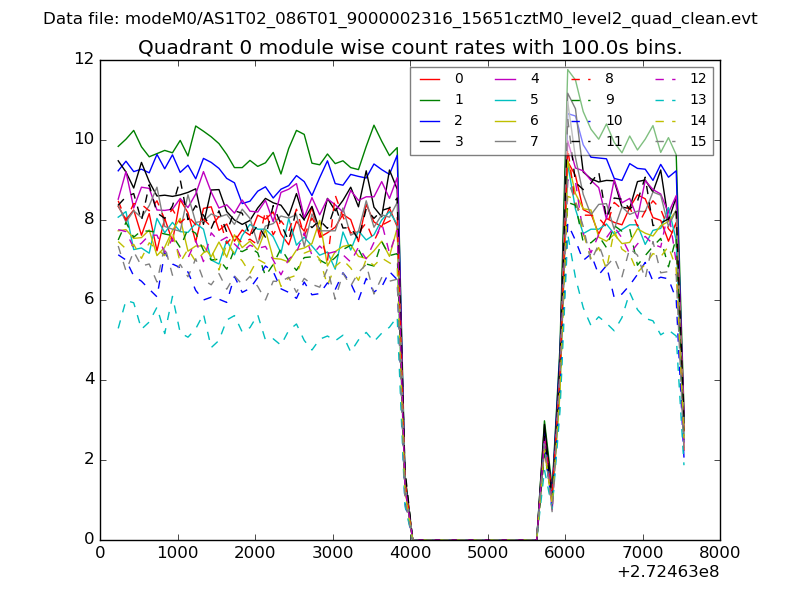 |
 |
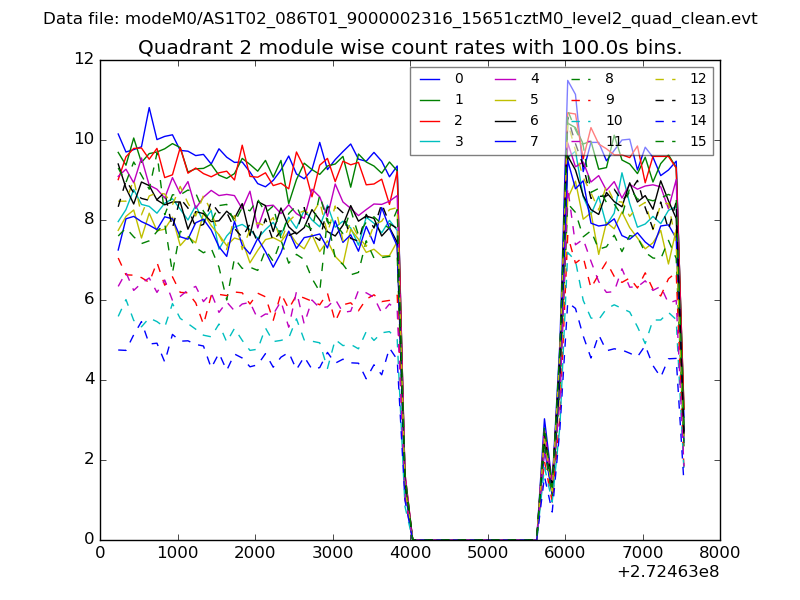
| Module-wise count rates for Quadrant B Data is divided into 100 sec bins |
 |
 |
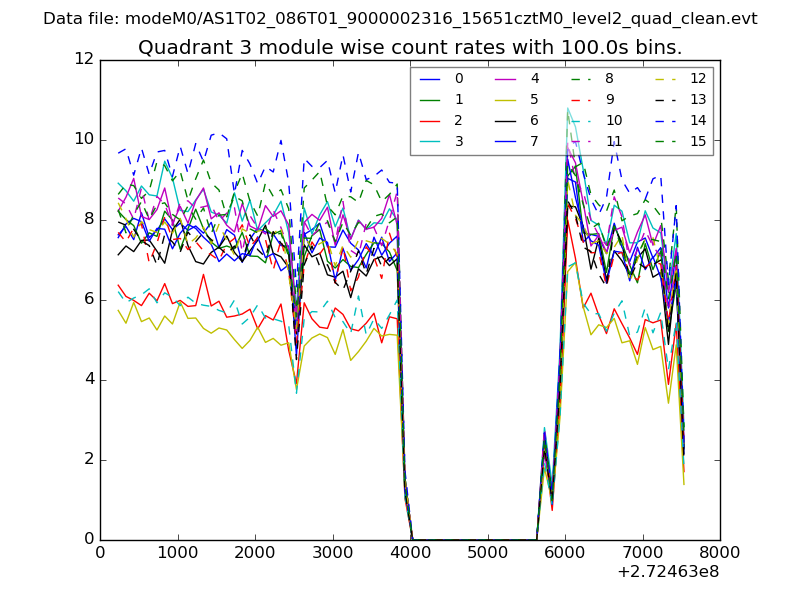
| Module-wise count rates for Quadrant C Data is divided into 100 sec bins |
 |
 |
| Module-wise count rates for Quadrant D Data is divided into 100 sec bins |
 |
 |
| Parameter | Plot |
|---|---|
| CZT HV Monitor | 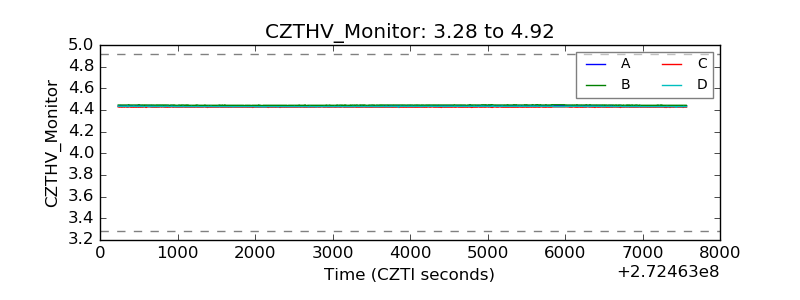 |
| D_VDD | 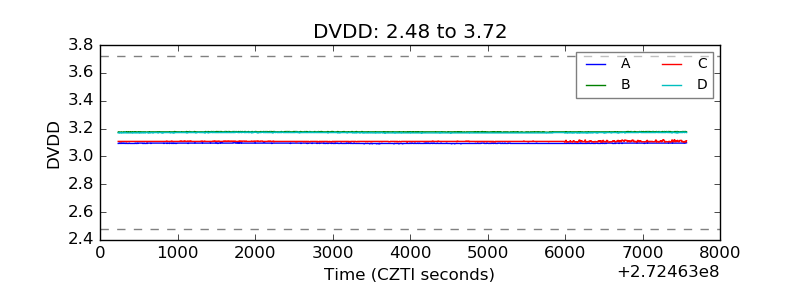 |
| Temperature 1 | 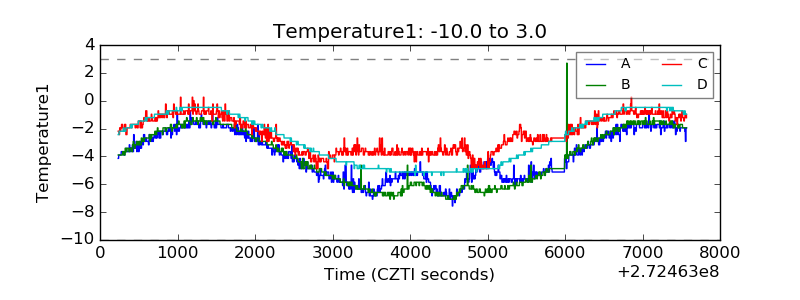 |
| Veto HV Monitor | 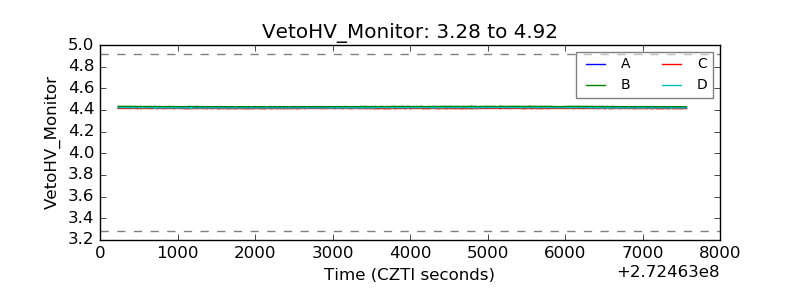 |
| Veto LLD | 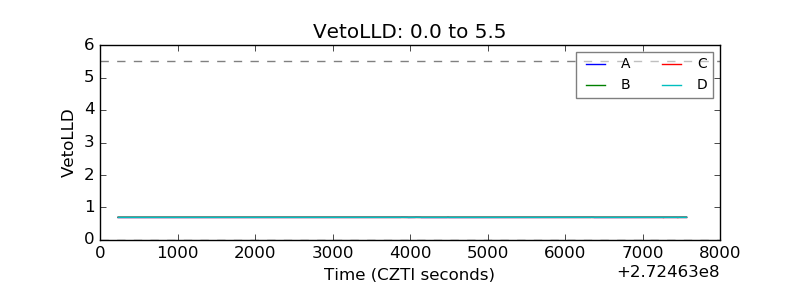 |
| Alpha Counter | 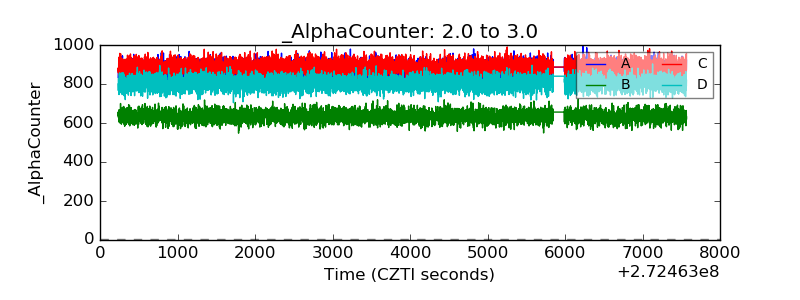 |
| _CPM_Rate | 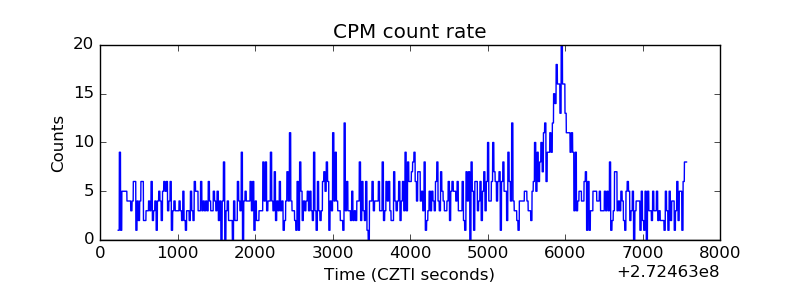 |
| CZT Counter | 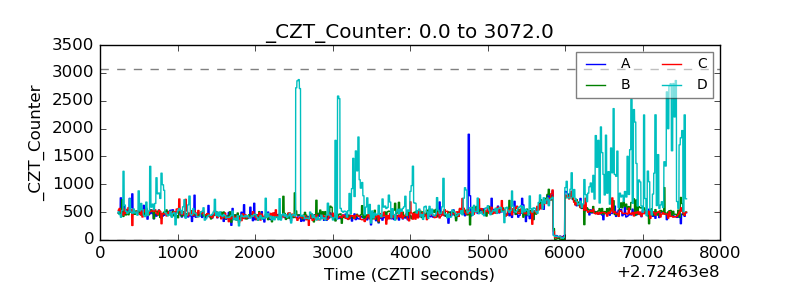 |
| +2.5 Volts monitor |  |
| +5 Volts monitor | 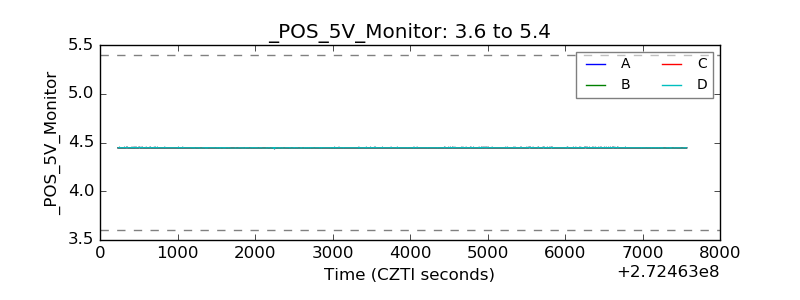 |
| _ROLL_ROT | 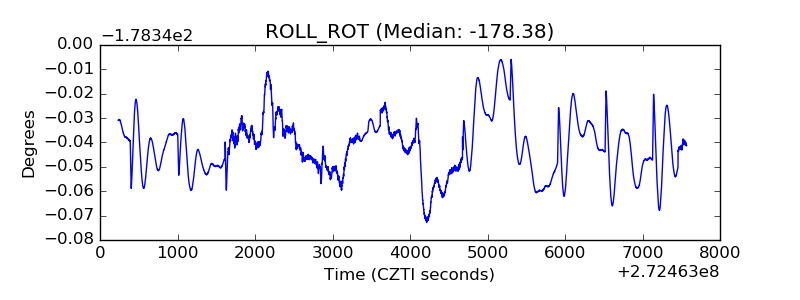 |
| _Roll_DEC | 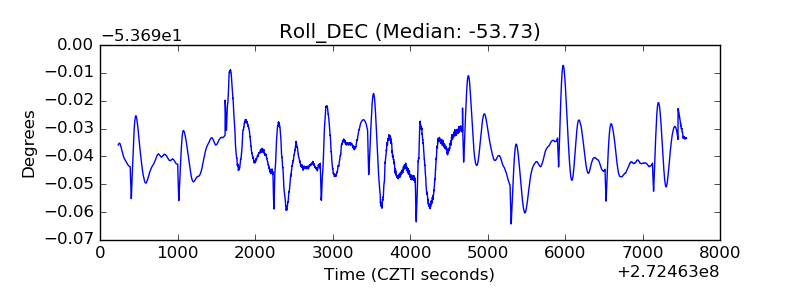 |
| _Roll_RA | 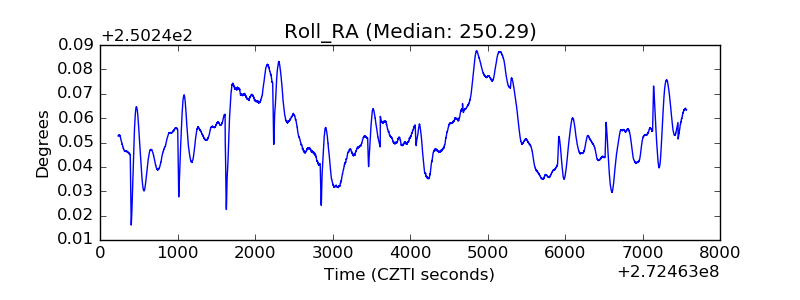 |
| Veto Counter |  |