| Param | Original file | Final file |
|---|---|---|
| Filename | modeM0/AS1T02_086T01_9000002316_15652cztM0_level2.evt | modeM0/AS1T02_086T01_9000002316_15652cztM0_level2_quad_clean.evt |
| Size (bytes) | 549,973,440 | 93,104,640 |
| Size | 524.5 MB | 88.8 MB |
| Events in quadrant A | 3,088,597 | 606,083 |
| Events in quadrant B | 3,250,996 | 608,616 |
| Events in quadrant C | 3,212,722 | 596,872 |
| Events in quadrant D | 6,644,048 | 535,405 |
| Mode SS | |||
|---|---|---|---|
| Quadrant | BADHDUFLAG | Total packets | Discarded packets |
| A | 0 | 138 | 0 |
| B | 0 | 138 | 0 |
| C | 0 | 138 | 0 |
| D | 0 | 138 | 0 |
| Mode M9 | |||
|---|---|---|---|
| Quadrant | BADHDUFLAG | Total packets | Discarded packets |
| A | 0 | 3 | 0 |
| B | 0 | 3 | 0 |
| C | 0 | 3 | 0 |
| D | 0 | 3 | 0 |
| Mode M0 | |||
|---|---|---|---|
| Quadrant | BADHDUFLAG | Total packets | Discarded packets |
| A | 0 | 13831 | 2 |
| B | 0 | 14028 | 1 |
| C | 0 | 13947 | 1 |
| D | 0 | 24265 | 1 |
| Quadrant | Total seconds | Saturated seconds | Saturation percentage |
|---|---|---|---|
| A | 6774 | 39 | 0.575731% |
| B | 6774 | 40 | 0.590493% |
| C | 6774 | 63 | 0.930027% |
| D | 6774 | 909 | 13.418955% |
Noise dominated data is calculated using 1-second bins in cleaned event files. If a bin has >2000 counts, and if more than 50% of those come from <1% of pixels, then it is considered to be noise-dominated and hence unusable.
| Quadrant | # 1 sec bins | Bins with >0 counts | Bins with >2000 counts | High rate bins dominated by noise | Noise dominated (total time) | Noise dominated (detector-on time) | Marked lightcurve |
|---|---|---|---|---|---|---|---|
| A | 7110 | 6775 | 1 | 1 | 0.01% | 0.01% | 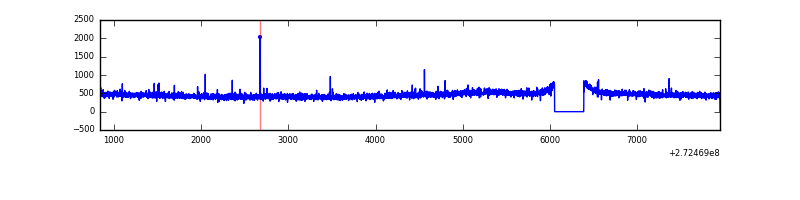 |
| B | 7110 | 6776 | 0 | 0 | 0.00% | 0.00% | 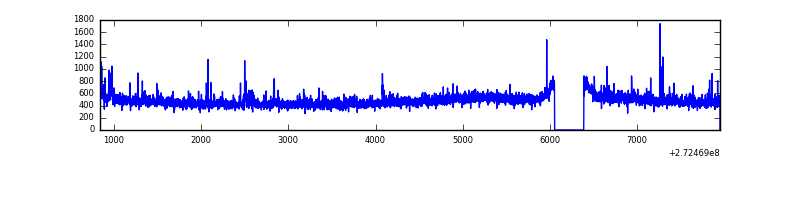 |
| C | 7110 | 6776 | 0 | 0 | 0.00% | 0.00% | 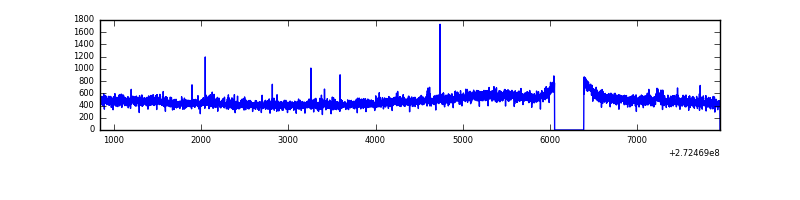 |
| D | 7109 | 6775 | 961 | 961 | 13.52% | 14.18% | 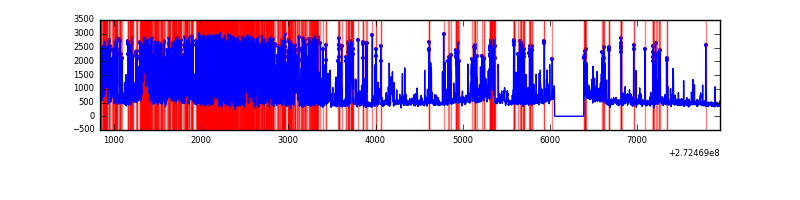 |
Top three noisy pixels from each quadrant. If the there are fewer than three noisy pixels in the level2.evt file, extra rows are filled as -1
| Pixel properties | Quadrant properties | ||||||
|---|---|---|---|---|---|---|---|
| Quadrant | DetID | PixID | Counts | Sigma | Mean | Median | Sigma |
| A | 0 | 226 | 7014 | 38.4 | 800 | 783 | 162.2 |
| A | 12 | 194 | 6017 | 32.26 | 800 | 783 | 162.2 |
| A | 3 | 137 | 5365 | 28.24 | 800 | 783 | 162.2 |
| B | 3 | 64 | 38382 | 245.94 | 797 | 777 | 152.9 |
| B | 4 | 173 | 30564 | 194.81 | 797 | 777 | 152.9 |
| B | 0 | 189 | 20267 | 127.47 | 797 | 777 | 152.9 |
| C | 14 | 238 | 116928 | 652.03 | 763 | 768 | 178.2 |
| C | 3 | 233 | 60700 | 336.41 | 763 | 768 | 178.2 |
| C | 7 | 247 | 35465 | 194.76 | 763 | 768 | 178.2 |
| D | 1 | 52 | 3721802 | 20792.14 | 735 | 714 | 179.0 |
| D | 2 | 234 | 28179 | 153.46 | 735 | 714 | 179.0 |
| D | 10 | 70 | 23747 | 128.7 | 735 | 714 | 179.0 |
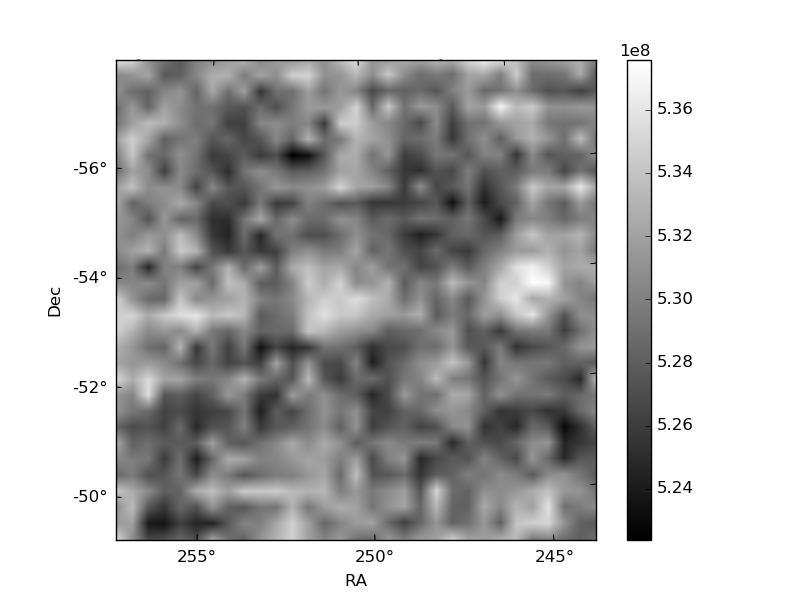
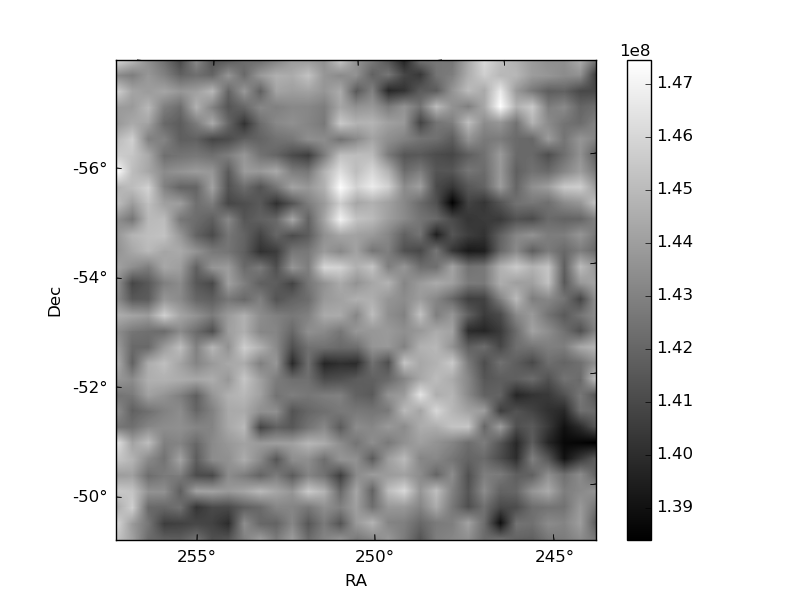
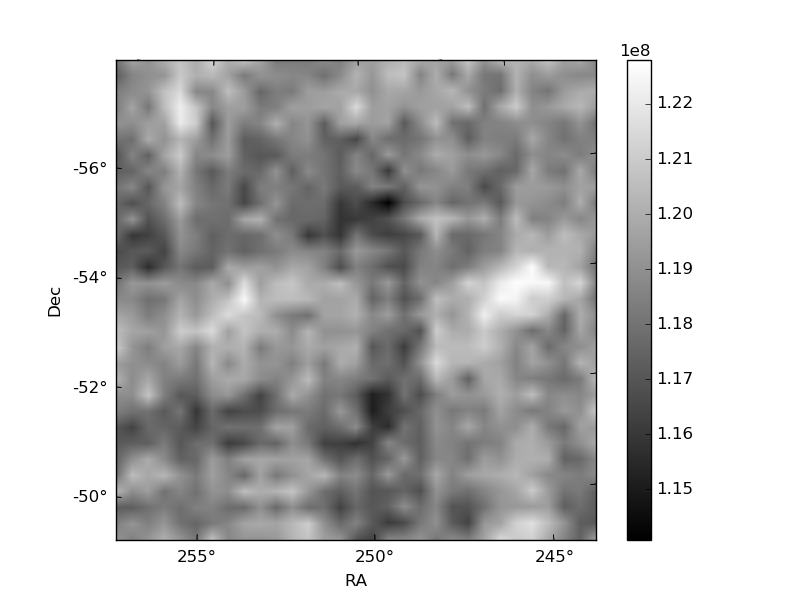
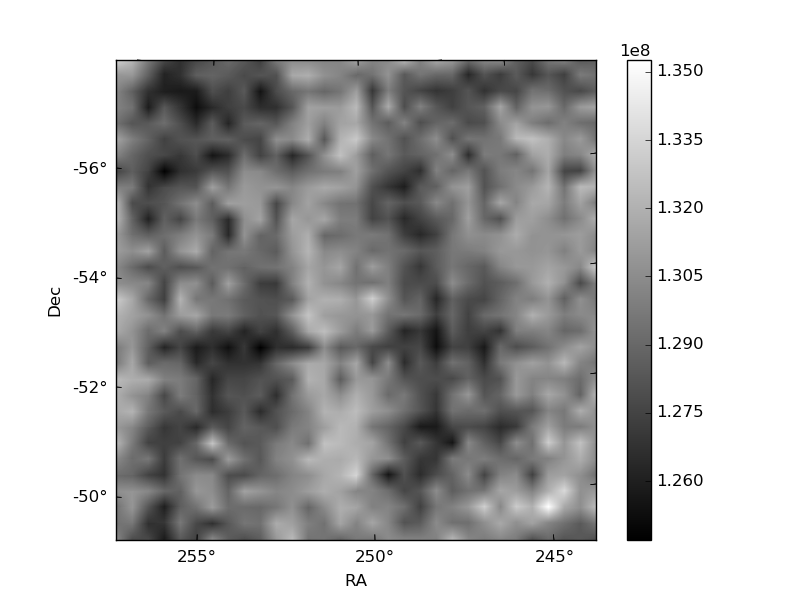
Histogram calculated using DETX and DETY for each event in the final _common_clean file
| Quadrant A | 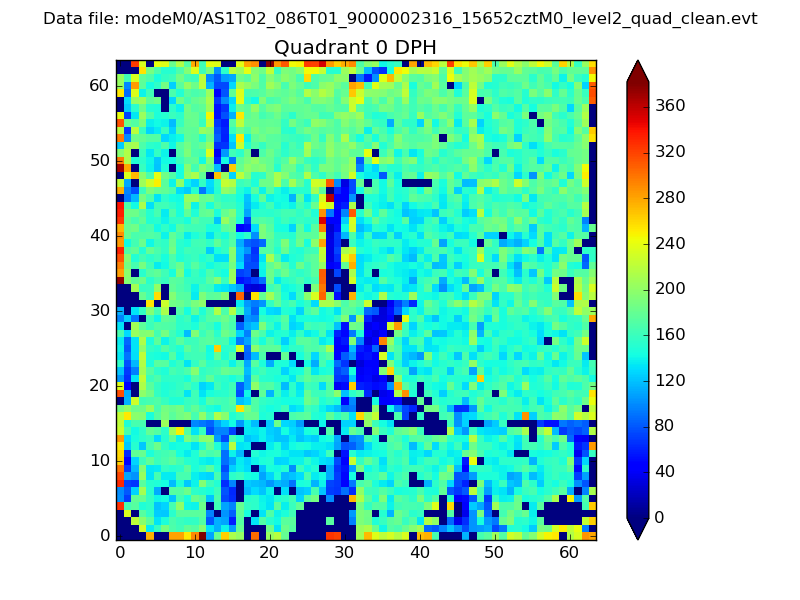 |
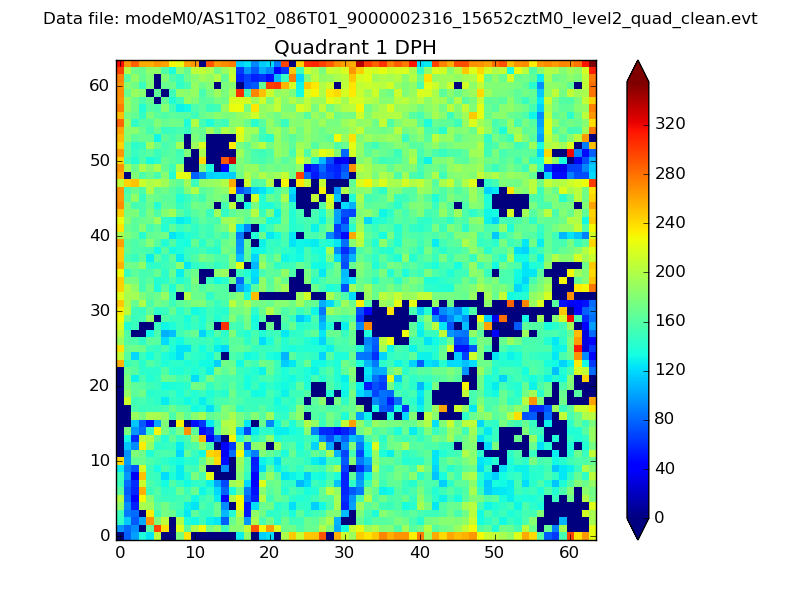 |
Quadrant B |
|---|---|---|---|
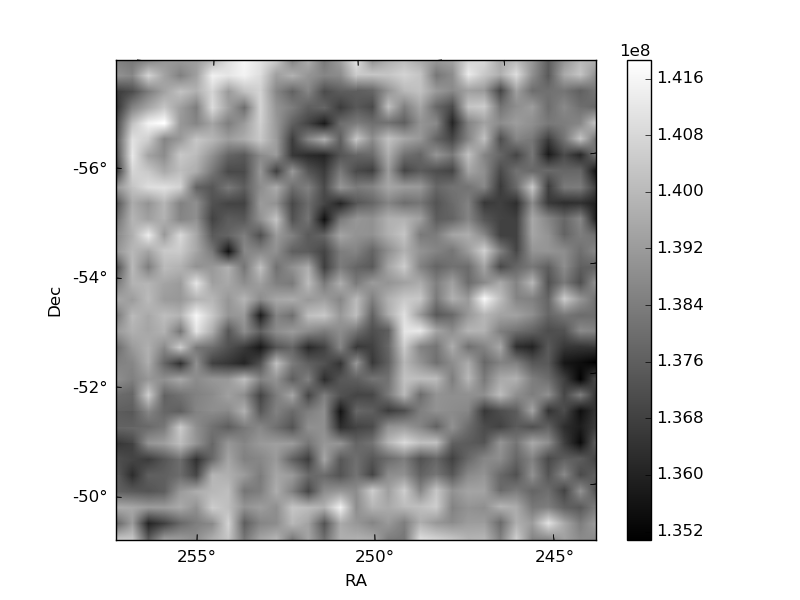
| Quadrant D |  |
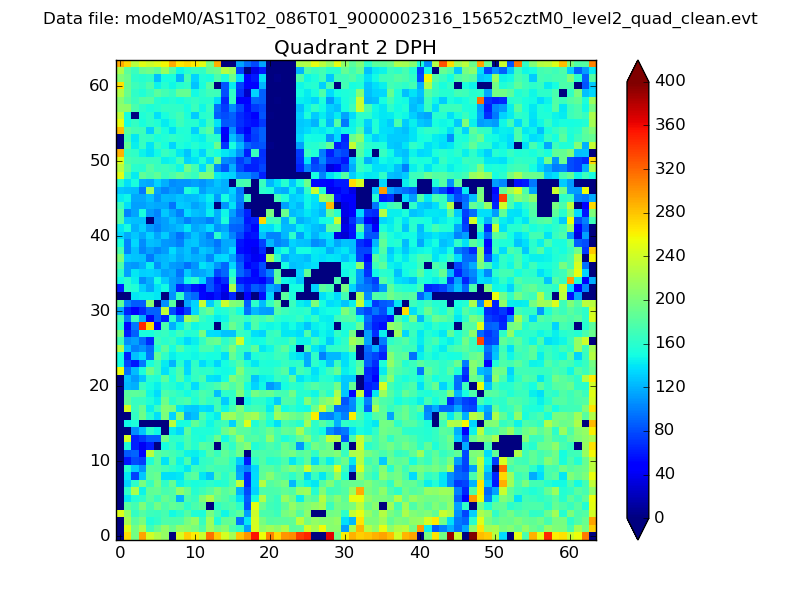 |
Quadrant C |
| Plot type | Count rate plots | Images |
|---|---|---|
| Comparison with Poisson distribution Blue bars denote a histogram of data divided into 1 sec bins. Red curve is a Poisson curve with rate = median count rate of data. |
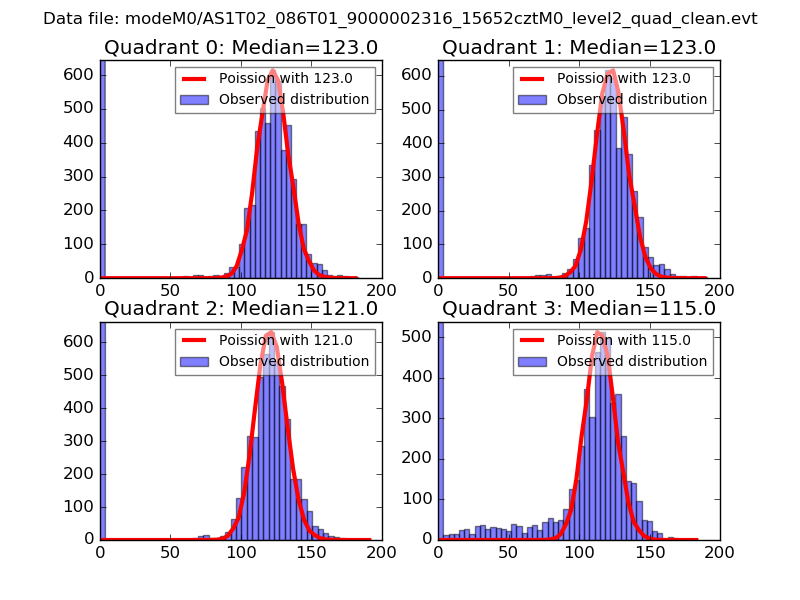 |
 |
| Quadrant-wise count rates Data is divided into 100 sec bins |
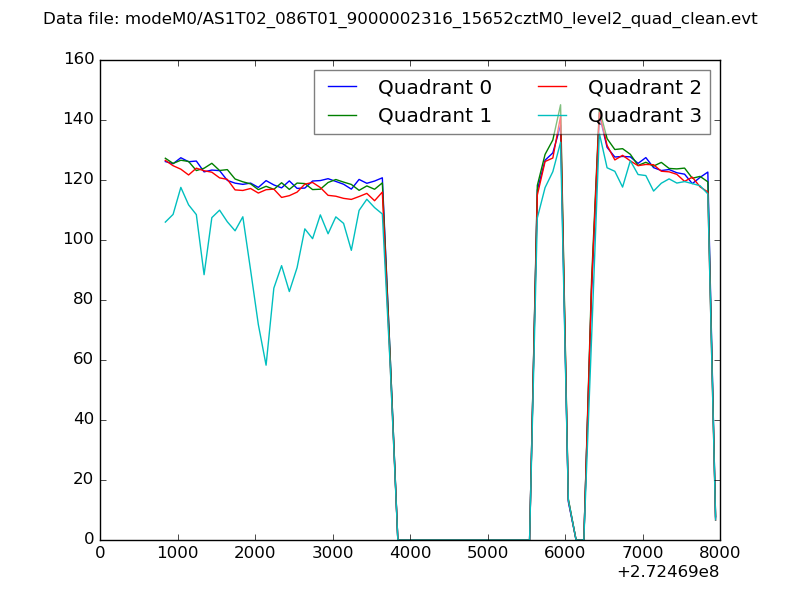 |
|
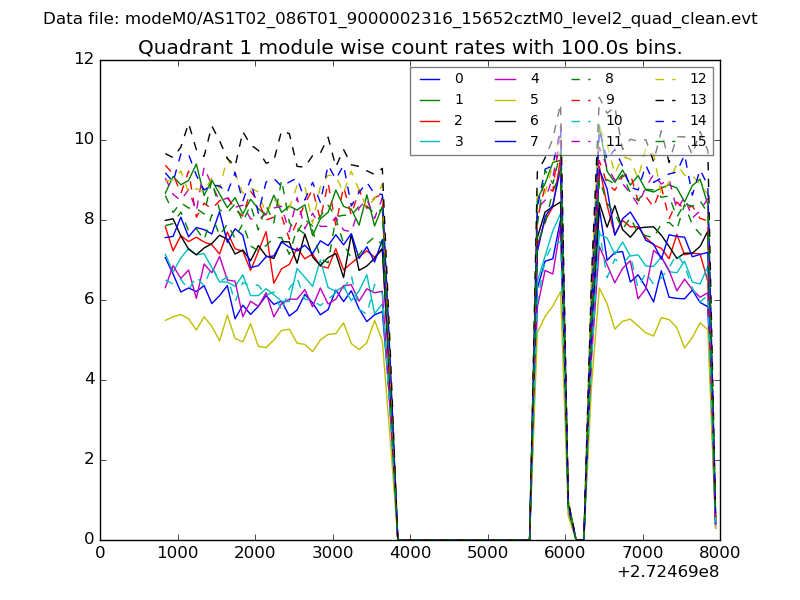
| Module-wise count rates for Quadrant A Data is divided into 100 sec bins |
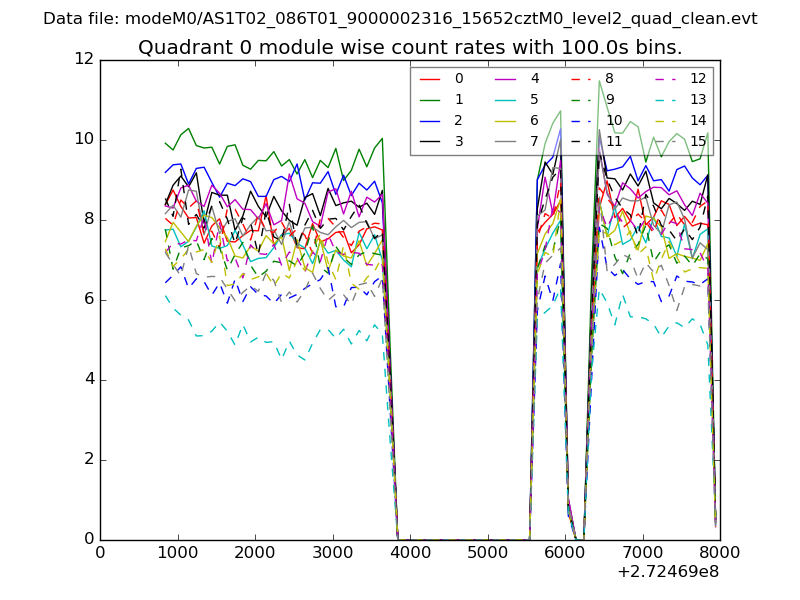 |
 |
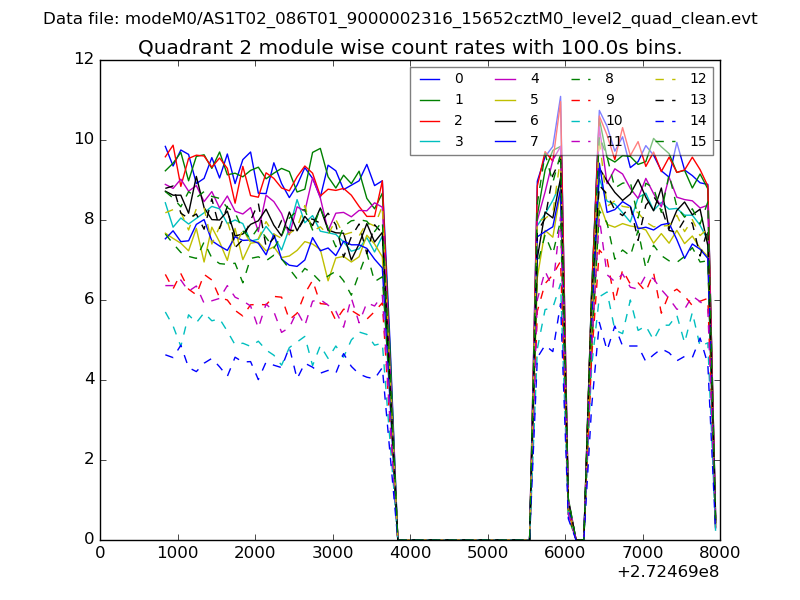
| Module-wise count rates for Quadrant B Data is divided into 100 sec bins |
 |
 |
| Module-wise count rates for Quadrant C Data is divided into 100 sec bins |
 |
 |
| Module-wise count rates for Quadrant D Data is divided into 100 sec bins |
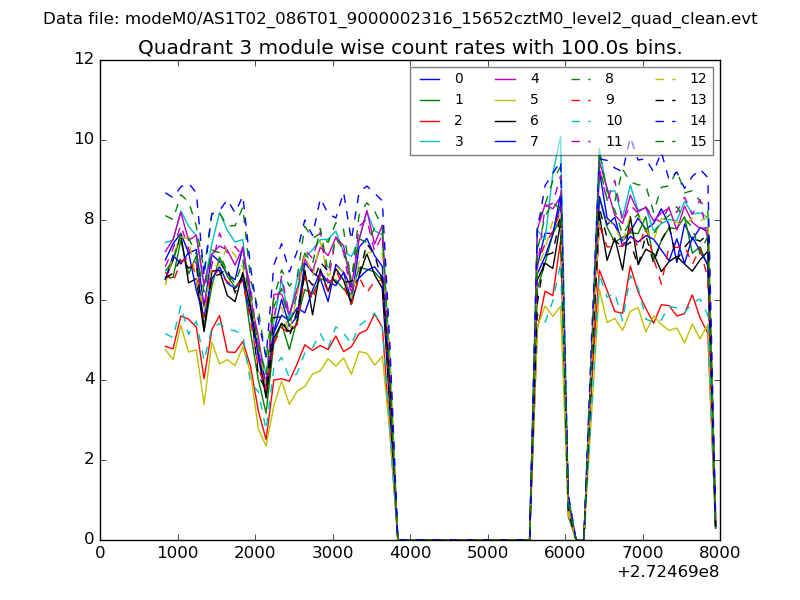 |
 |
| Parameter | Plot |
|---|---|
| CZT HV Monitor | 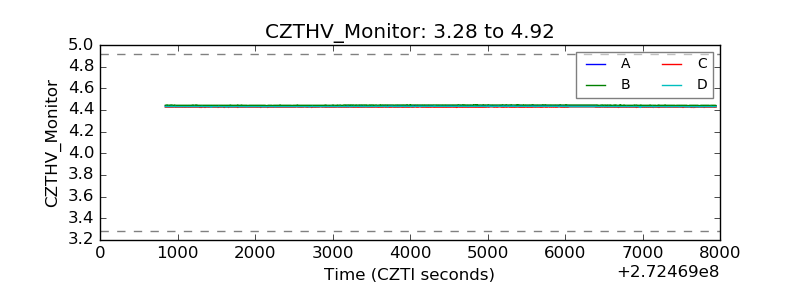 |
| D_VDD | 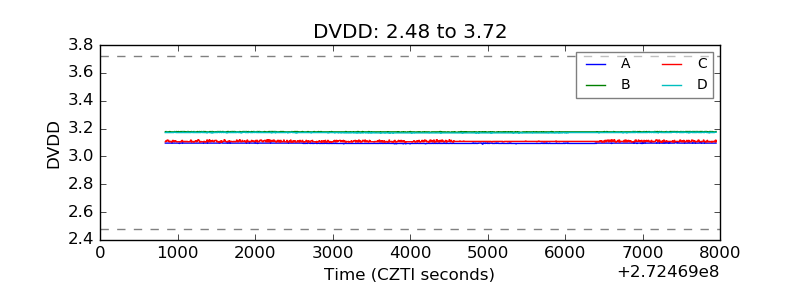 |
| Temperature 1 | 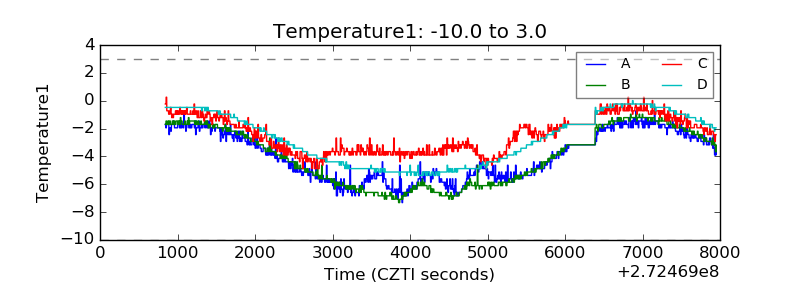 |
| Veto HV Monitor | 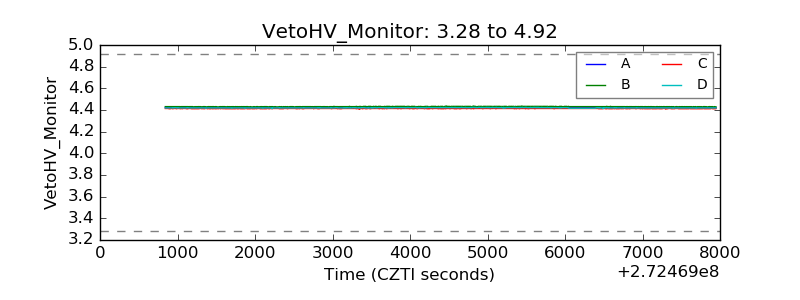 |
| Veto LLD | 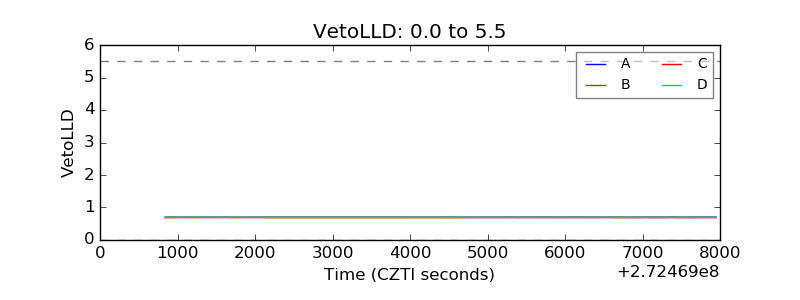 |
| Alpha Counter | 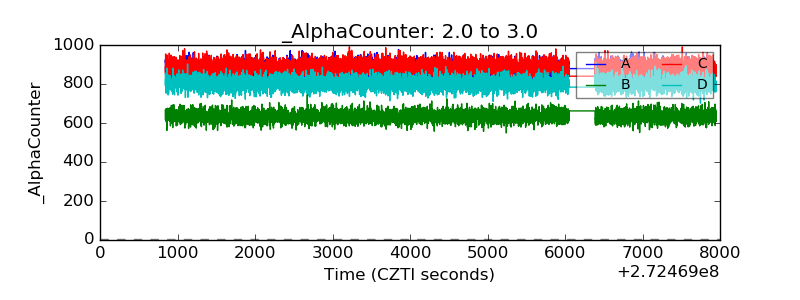 |
| _CPM_Rate | 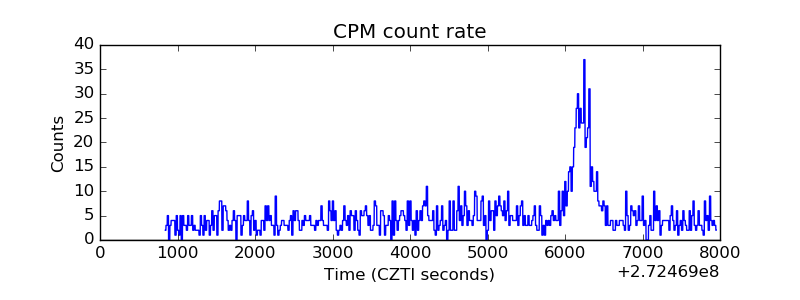 |
| CZT Counter | 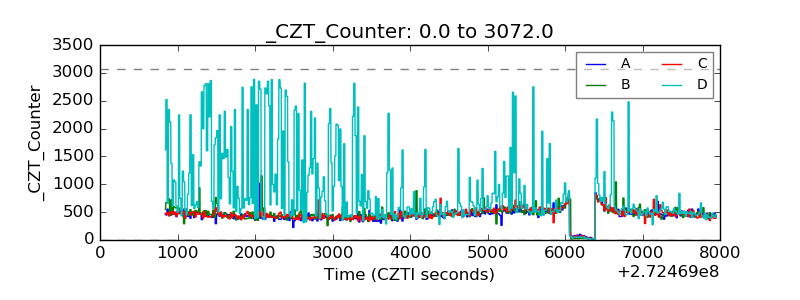 |
| +2.5 Volts monitor | 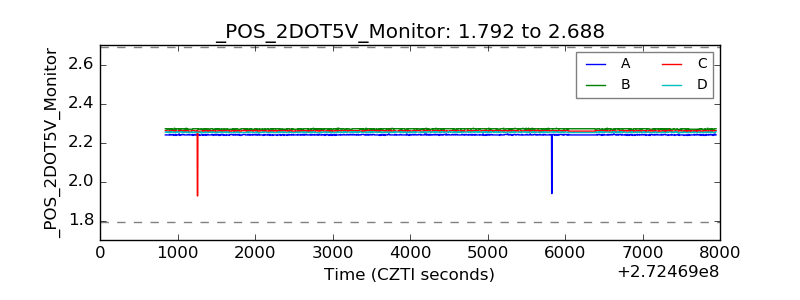 |
| +5 Volts monitor |  |
| _ROLL_ROT | 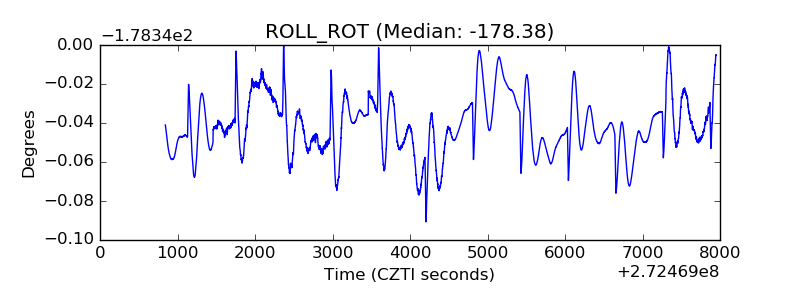 |
| _Roll_DEC | 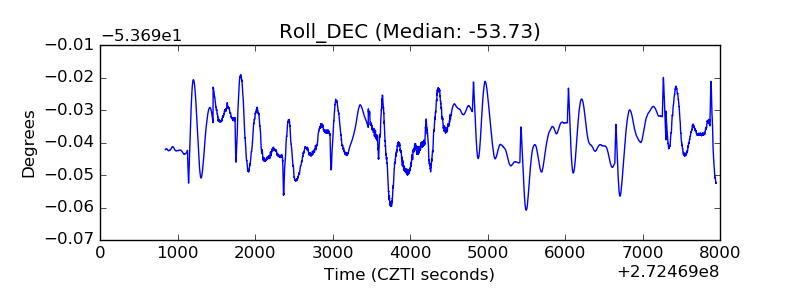 |
| _Roll_RA | 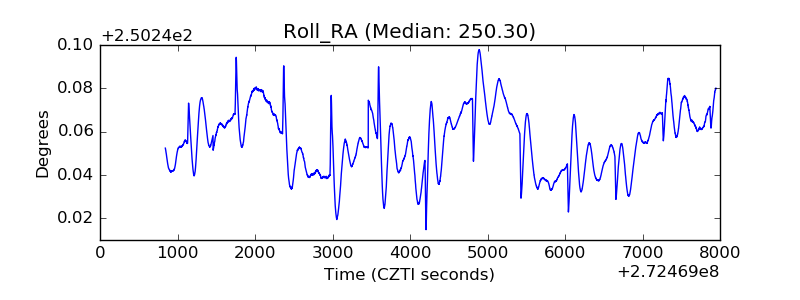 |
| Veto Counter | 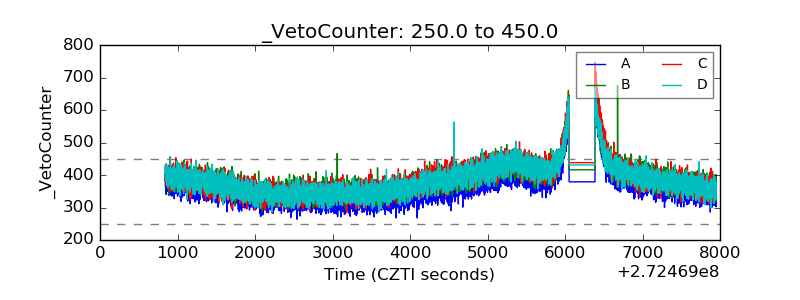 |