| Param | Original file | Final file |
|---|---|---|
| Filename | modeM0/AS1T02_084T01_9000002318_15655cztM0_level2.evt | modeM0/AS1T02_084T01_9000002318_15655cztM0_level2_quad_clean.evt |
| Size (bytes) | 118,514,880 | 32,048,640 |
| Size | 113.0 MB | 30.6 MB |
| Events in quadrant A | 791,843 | 215,904 |
| Events in quadrant B | 898,194 | 217,112 |
| Events in quadrant C | 821,490 | 210,549 |
| Events in quadrant D | 960,889 | 203,337 |
| Mode M0 | |||
|---|---|---|---|
| Quadrant | BADHDUFLAG | Total packets | Discarded packets |
| A | 0 | 3470 | 2 |
| B | 0 | 3784 | 1 |
| C | 0 | 3511 | 1 |
| D | 0 | 4033 | 1 |
| Mode M9 | |||
|---|---|---|---|
| Quadrant | BADHDUFLAG | Total packets | Discarded packets |
| A | 0 | 8 | 0 |
| B | 0 | 8 | 0 |
| C | 0 | 8 | 0 |
| D | 0 | 8 | 0 |
| Mode SS | |||
|---|---|---|---|
| Quadrant | BADHDUFLAG | Total packets | Discarded packets |
| A | 0 | 34 | 0 |
| B | 0 | 34 | 0 |
| C | 0 | 34 | 0 |
| D | 0 | 34 | 0 |
| Quadrant | Total seconds | Saturated seconds | Saturation percentage |
|---|---|---|---|
| A | 1683 | 9 | 0.534759% |
| B | 1683 | 16 | 0.950683% |
| C | 1683 | 15 | 0.891266% |
| D | 1683 | 20 | 1.188354% |
Noise dominated data is calculated using 1-second bins in cleaned event files. If a bin has >2000 counts, and if more than 50% of those come from <1% of pixels, then it is considered to be noise-dominated and hence unusable.
| Quadrant | # 1 sec bins | Bins with >0 counts | Bins with >2000 counts | High rate bins dominated by noise | Noise dominated (total time) | Noise dominated (detector-on time) | Marked lightcurve |
|---|---|---|---|---|---|---|---|
| A | 2484 | 1684 | 0 | 0 | 0.00% | 0.00% | 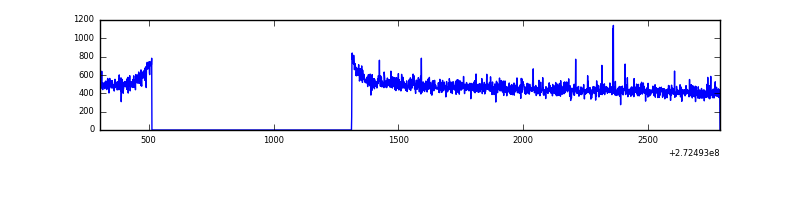 |
| B | 2484 | 1684 | 0 | 0 | 0.00% | 0.00% | 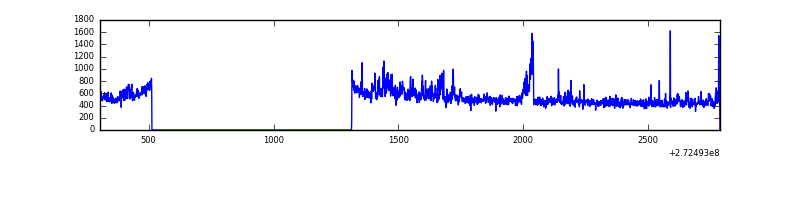 |
| C | 2483 | 1684 | 0 | 0 | 0.00% | 0.00% | 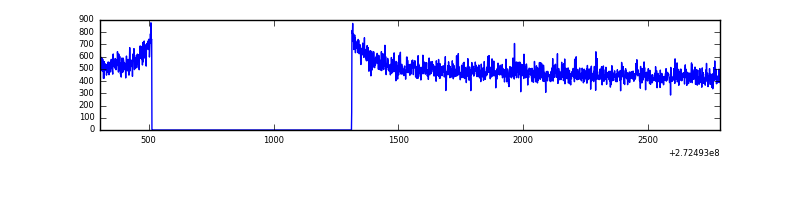 |
| D | 2484 | 1685 | 19 | 19 | 0.76% | 1.13% | 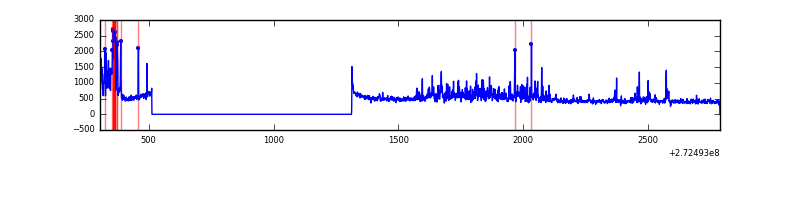 |
Top three noisy pixels from each quadrant. If the there are fewer than three noisy pixels in the level2.evt file, extra rows are filled as -1
| Pixel properties | Quadrant properties | ||||||
|---|---|---|---|---|---|---|---|
| Quadrant | DetID | PixID | Counts | Sigma | Mean | Median | Sigma |
| A | 15 | 69 | 2177 | 45.46 | 204 | 200 | 43.5 |
| A | 0 | 226 | 1872 | 38.44 | 204 | 200 | 43.5 |
| A | 13 | 248 | 1623 | 32.72 | 204 | 200 | 43.5 |
| B | 4 | 216 | 39311 | 943.01 | 205 | 200 | 41.5 |
| B | 0 | 189 | 29333 | 702.43 | 205 | 200 | 41.5 |
| B | 0 | 229 | 7496 | 175.92 | 205 | 200 | 41.5 |
| C | 3 | 233 | 39506 | 830.29 | 192 | 193 | 47.3 |
| C | 14 | 238 | 28915 | 606.61 | 192 | 193 | 47.3 |
| C | 13 | 61 | 1382 | 25.11 | 192 | 193 | 47.3 |
| D | 1 | 52 | 96591 | 1943.88 | 193 | 187 | 49.6 |
| D | 2 | 16 | 94461 | 1900.93 | 193 | 187 | 49.6 |
| D | 10 | 70 | 12117 | 240.56 | 193 | 187 | 49.6 |
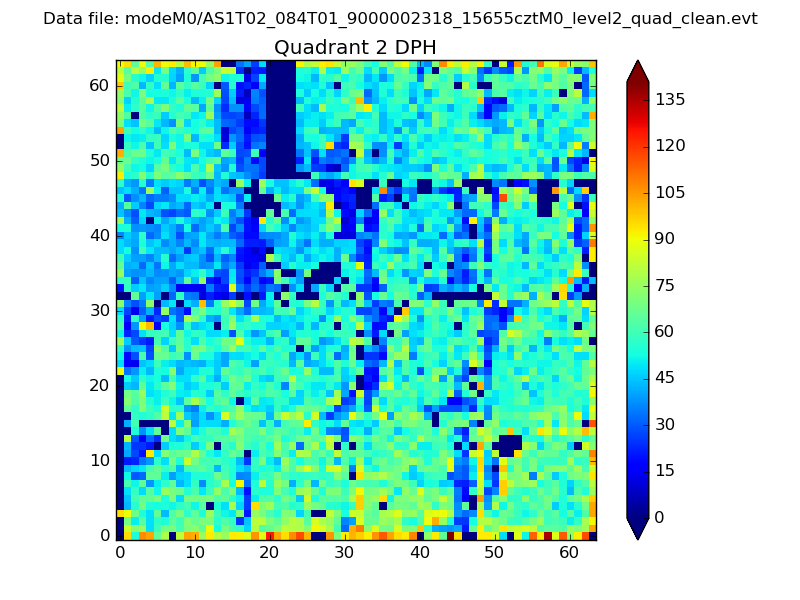
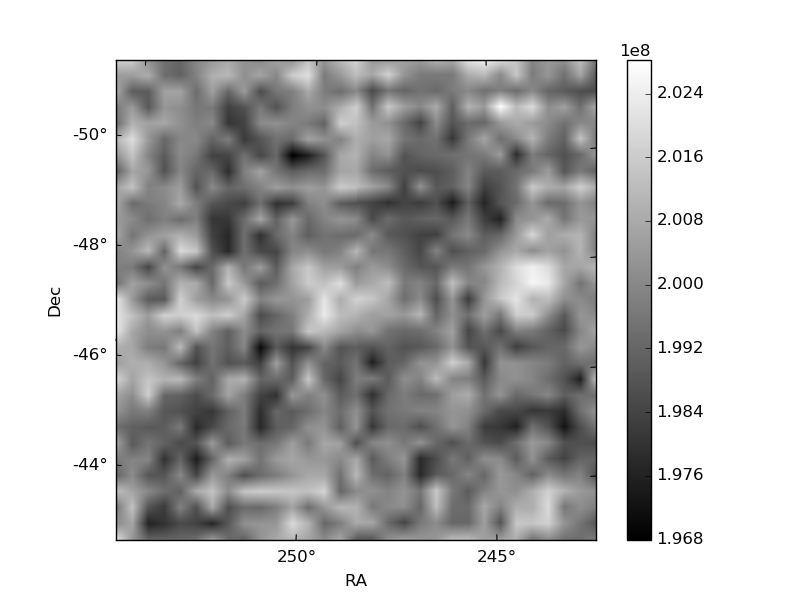
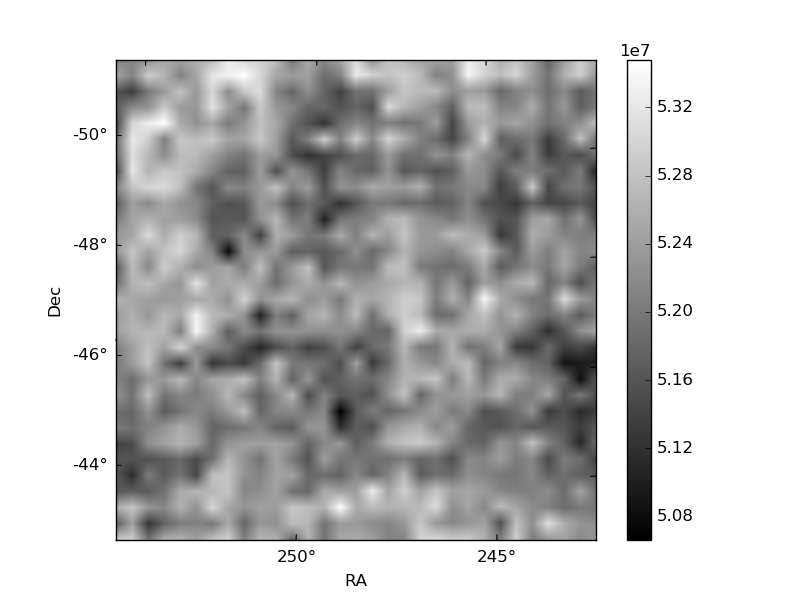
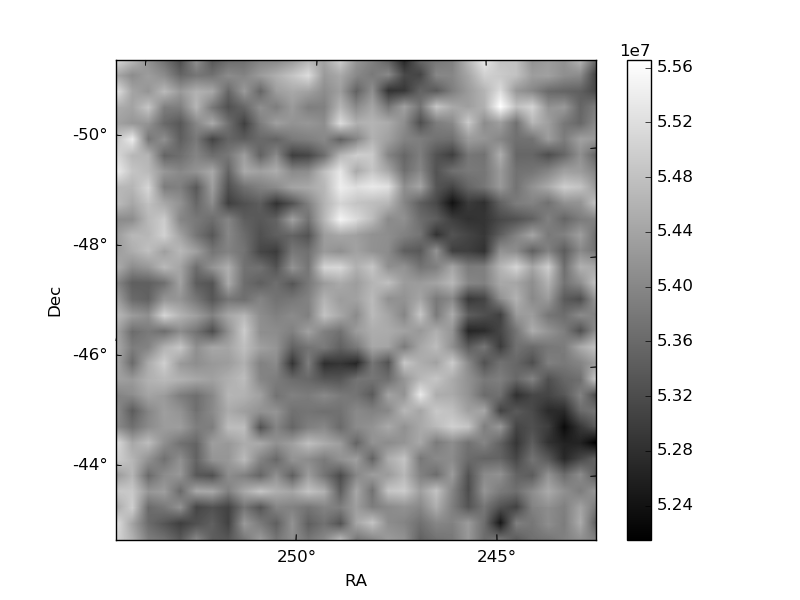
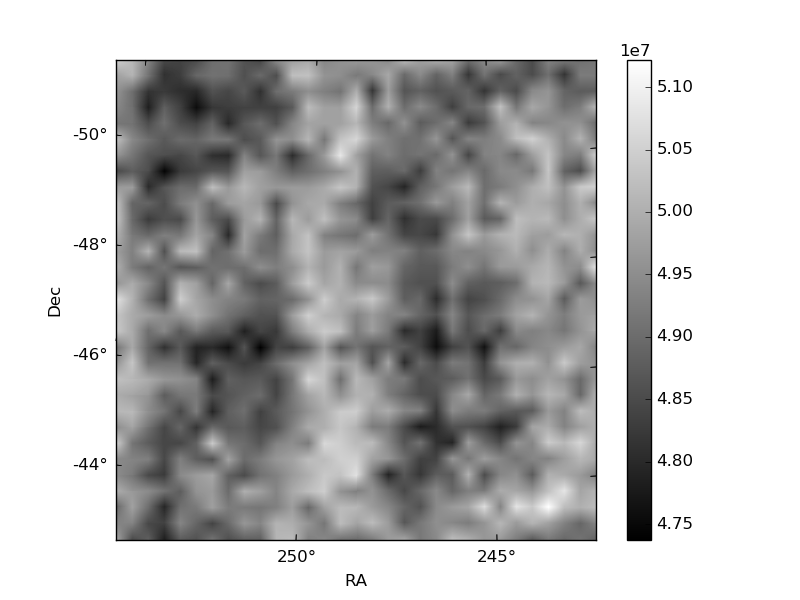
Histogram calculated using DETX and DETY for each event in the final _common_clean file
| Quadrant A | 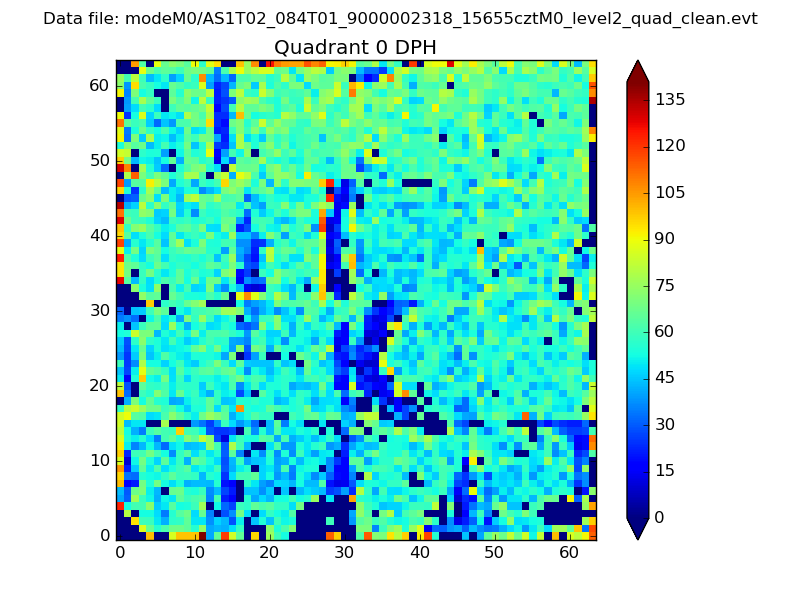 |
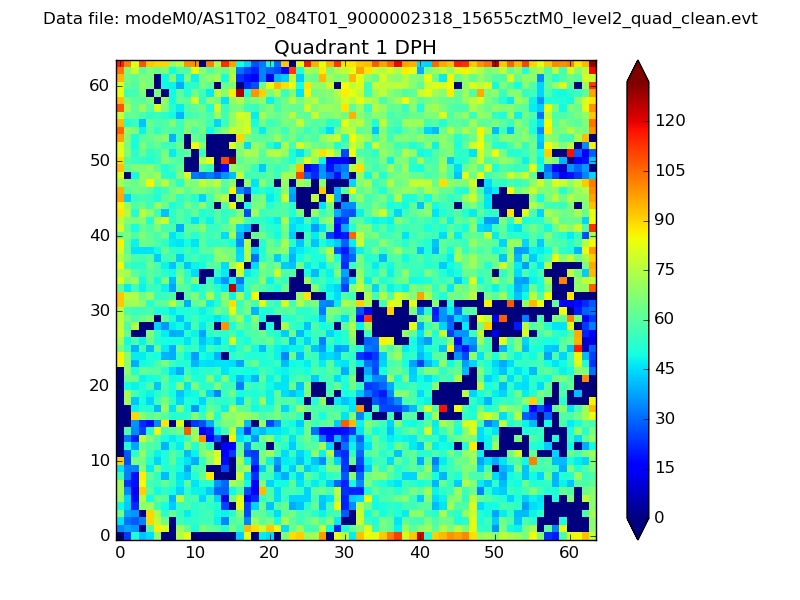 |
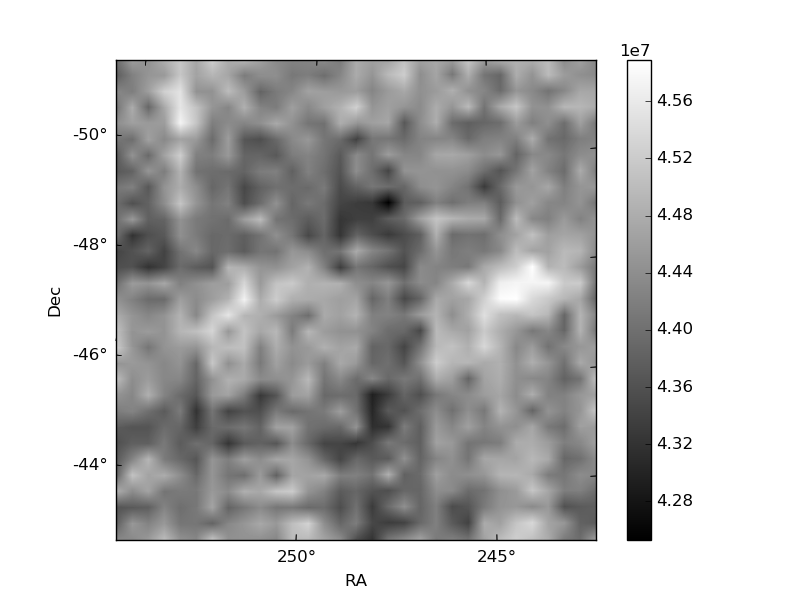
Quadrant B |
|---|---|---|---|
| Quadrant D | 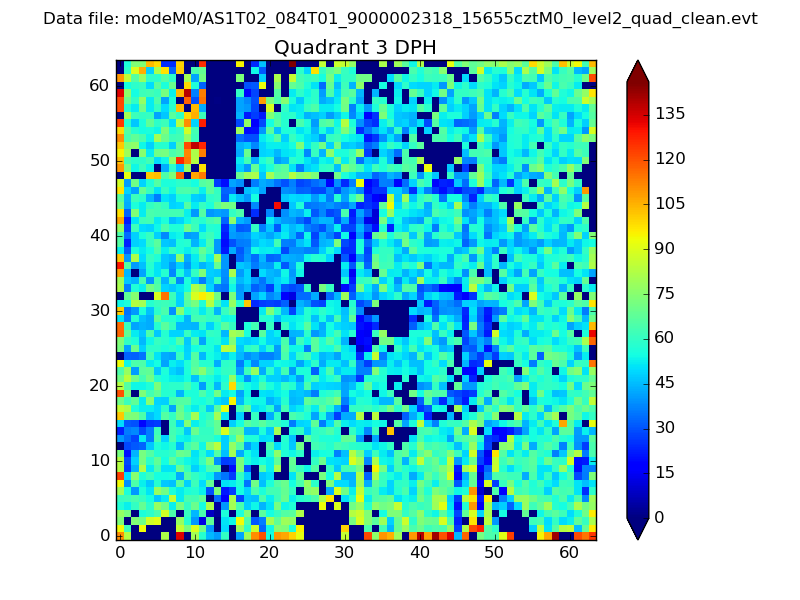 |
 |
Quadrant C |
| Plot type | Count rate plots | Images |
|---|---|---|
| Comparison with Poisson distribution Blue bars denote a histogram of data divided into 1 sec bins. Red curve is a Poisson curve with rate = median count rate of data. |
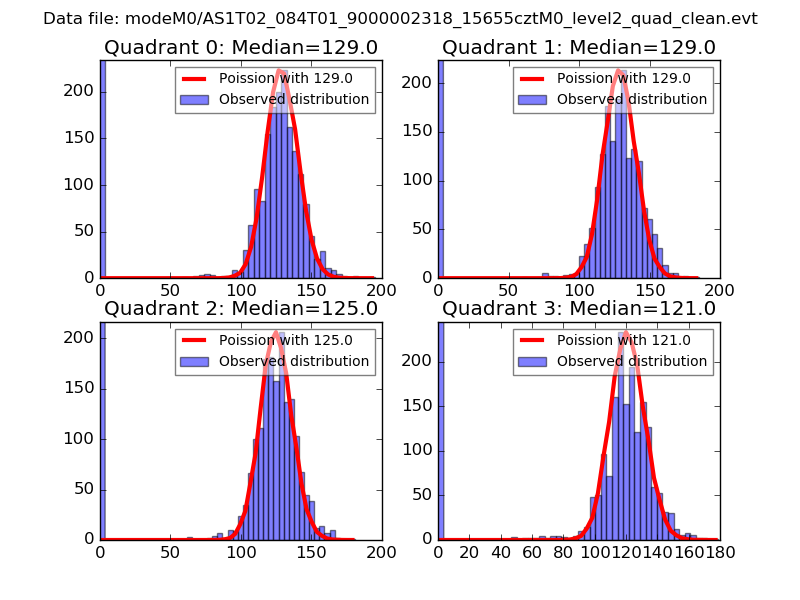 |
 |
| Quadrant-wise count rates Data is divided into 100 sec bins |
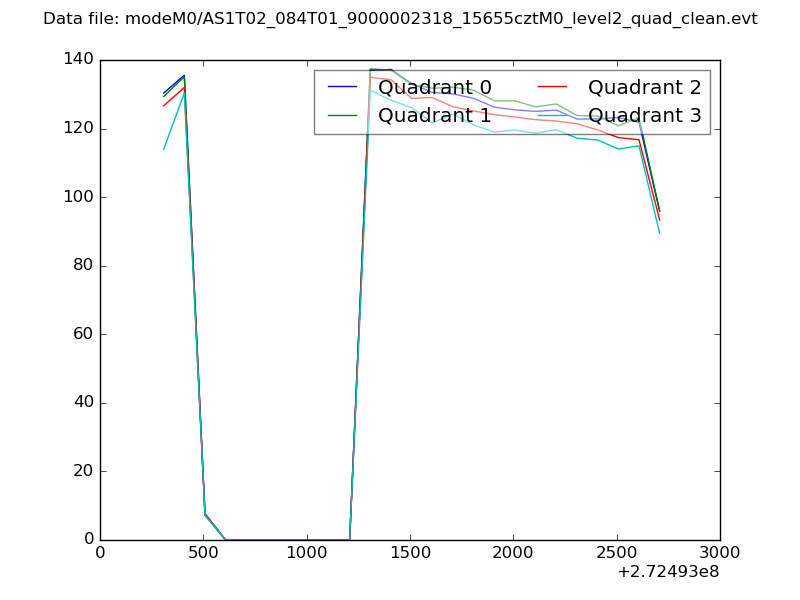 |
|
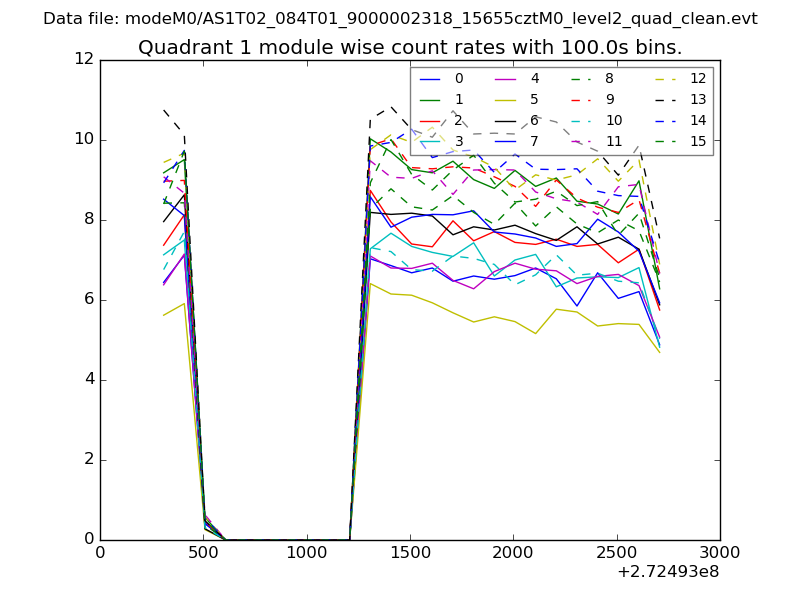
| Module-wise count rates for Quadrant A Data is divided into 100 sec bins |
 |
 |
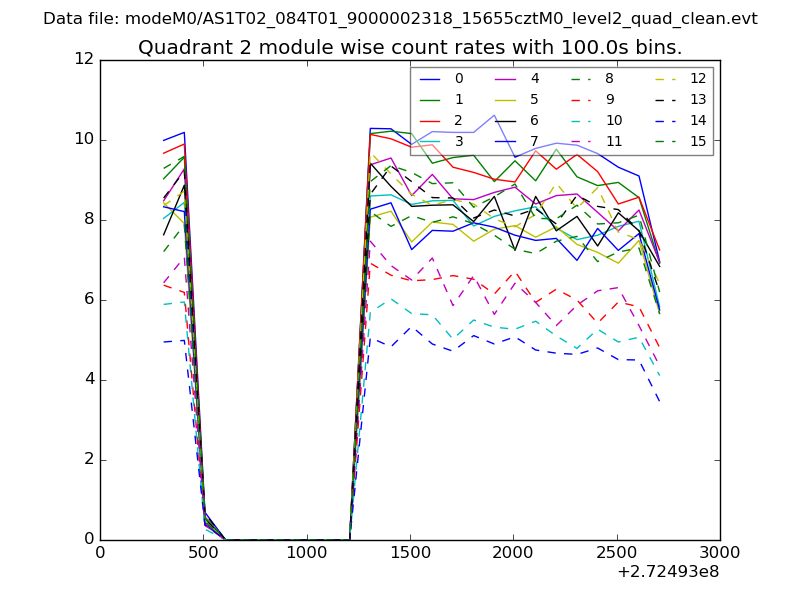
| Module-wise count rates for Quadrant B Data is divided into 100 sec bins |
 |
 |
| Module-wise count rates for Quadrant C Data is divided into 100 sec bins |
 |
 |
| Module-wise count rates for Quadrant D Data is divided into 100 sec bins |
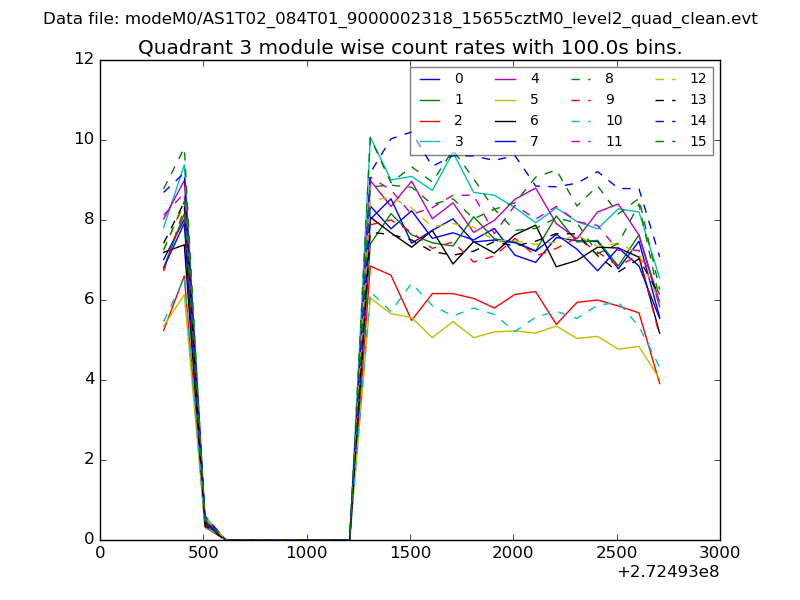 |
 |
| Parameter | Plot |
|---|---|
| CZT HV Monitor | 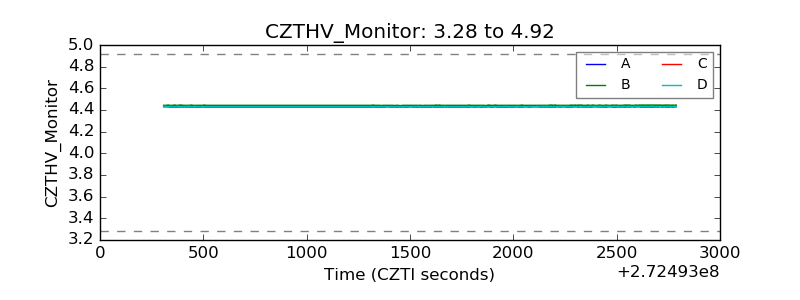 |
| D_VDD | 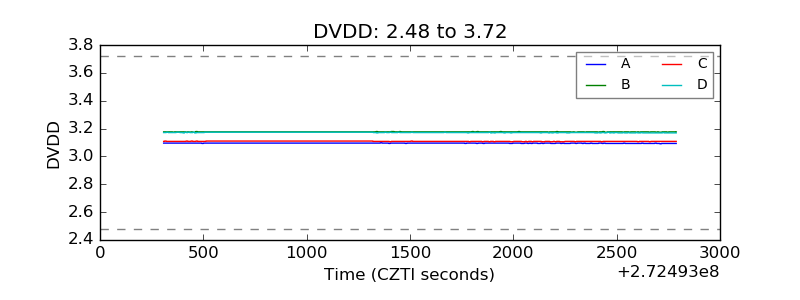 |
| Temperature 1 | 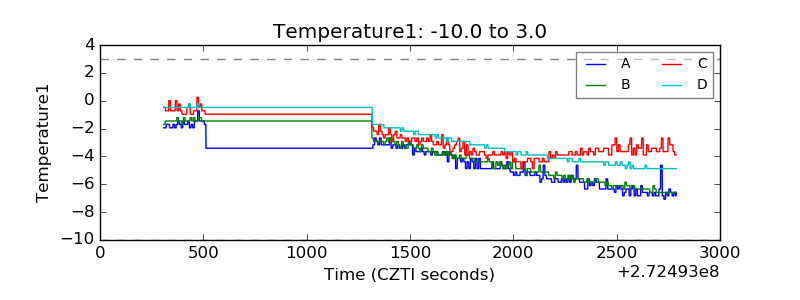 |
| Veto HV Monitor | 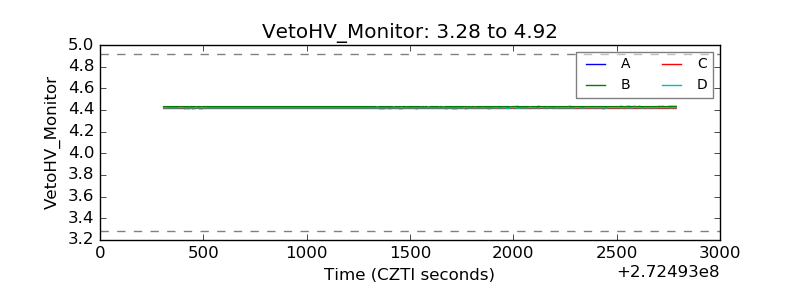 |
| Veto LLD | 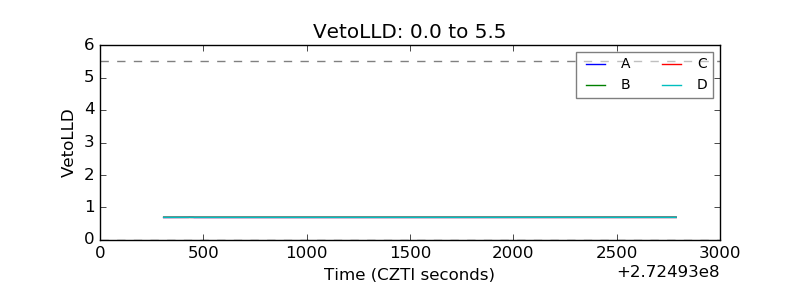 |
| Alpha Counter | 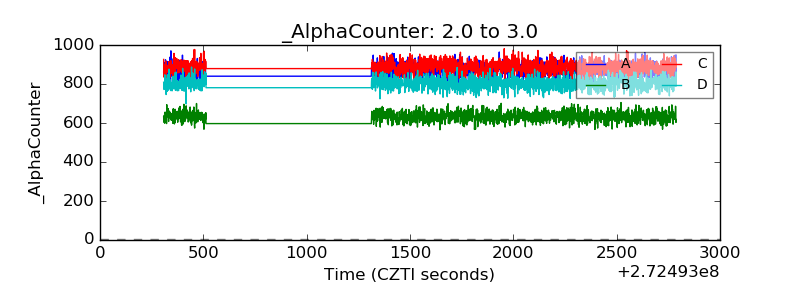 |
| _CPM_Rate | 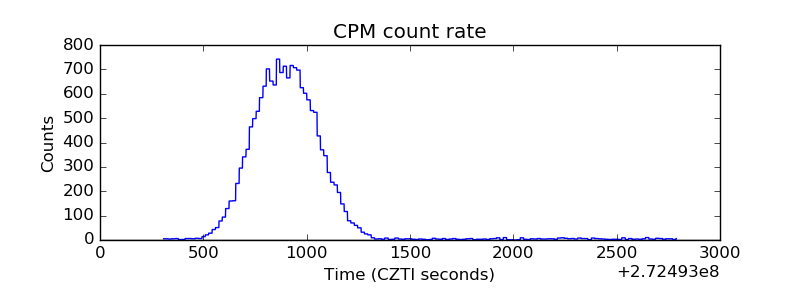 |
| CZT Counter | 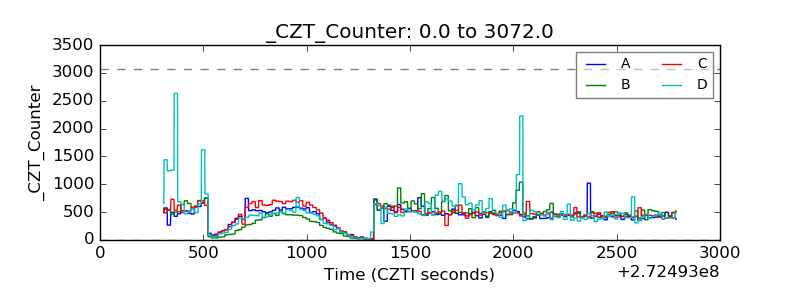 |
| +2.5 Volts monitor |  |
| +5 Volts monitor | 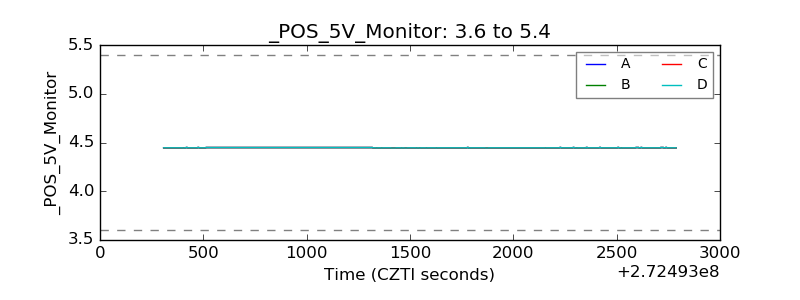 |
| _ROLL_ROT | 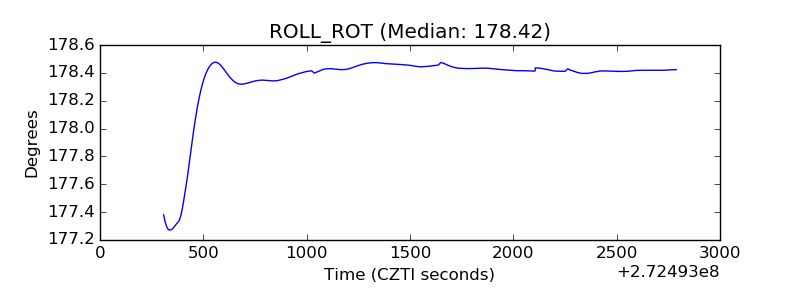 |
| _Roll_DEC | 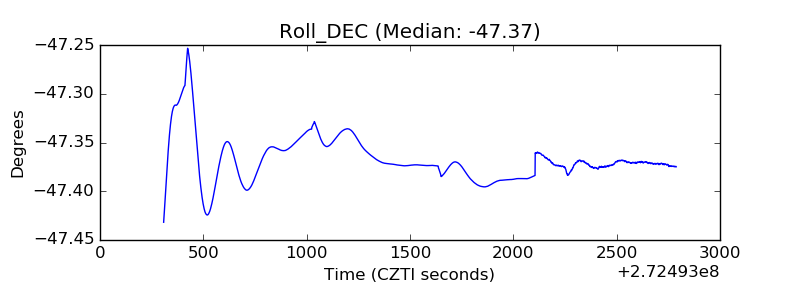 |
| _Roll_RA | 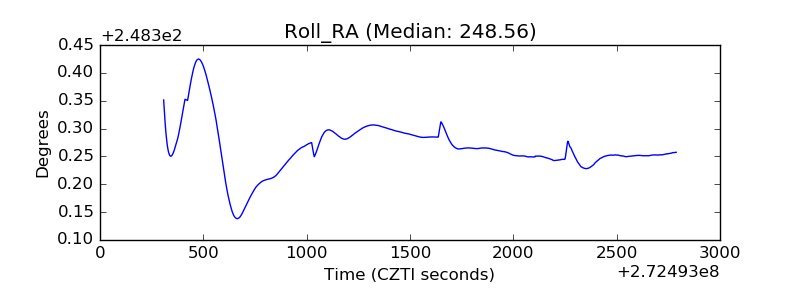 |
| Veto Counter | 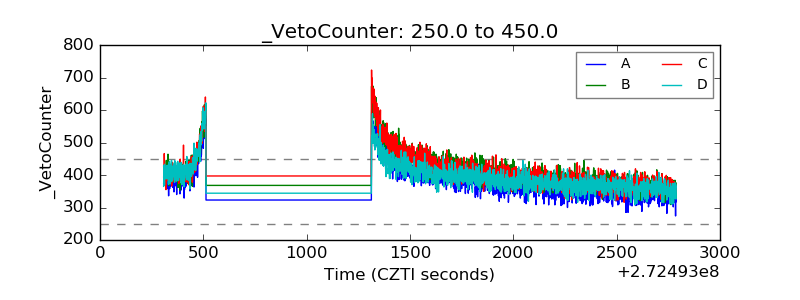 |