| Param | Original file | Final file |
|---|---|---|
| Filename | modeM0/AS1T02_084T01_9000002318_15656cztM0_level2.evt | modeM0/AS1T02_084T01_9000002318_15656cztM0_level2_quad_clean.evt |
| Size (bytes) | 463,227,840 | 92,828,160 |
| Size | 441.8 MB | 88.5 MB |
| Events in quadrant A | 3,138,258 | 600,725 |
| Events in quadrant B | 3,274,241 | 605,258 |
| Events in quadrant C | 3,148,726 | 589,081 |
| Events in quadrant D | 4,017,997 | 554,769 |
| Mode M0 | |||
|---|---|---|---|
| Quadrant | BADHDUFLAG | Total packets | Discarded packets |
| A | 0 | 13755 | 3 |
| B | 0 | 14058 | 2 |
| C | 0 | 13498 | 2 |
| D | 0 | 16667 | 2 |
| Mode M9 | |||
|---|---|---|---|
| Quadrant | BADHDUFLAG | Total packets | Discarded packets |
| A | 0 | 15 | 0 |
| B | 0 | 15 | 0 |
| C | 0 | 15 | 0 |
| D | 0 | 16 | 0 |
| Mode SS | |||
|---|---|---|---|
| Quadrant | BADHDUFLAG | Total packets | Discarded packets |
| A | 0 | 134 | 0 |
| B | 0 | 134 | 0 |
| C | 0 | 134 | 0 |
| D | 0 | 134 | 0 |
| Quadrant | Total seconds | Saturated seconds | Saturation percentage |
|---|---|---|---|
| A | 6615 | 42 | 0.634921% |
| B | 6615 | 22 | 0.332577% |
| C | 6615 | 28 | 0.423280% |
| D | 6615 | 356 | 5.381708% |
Noise dominated data is calculated using 1-second bins in cleaned event files. If a bin has >2000 counts, and if more than 50% of those come from <1% of pixels, then it is considered to be noise-dominated and hence unusable.
| Quadrant | # 1 sec bins | Bins with >0 counts | Bins with >2000 counts | High rate bins dominated by noise | Noise dominated (total time) | Noise dominated (detector-on time) | Marked lightcurve |
|---|---|---|---|---|---|---|---|
| A | 7591 | 6616 | 19 | 19 | 0.25% | 0.29% | 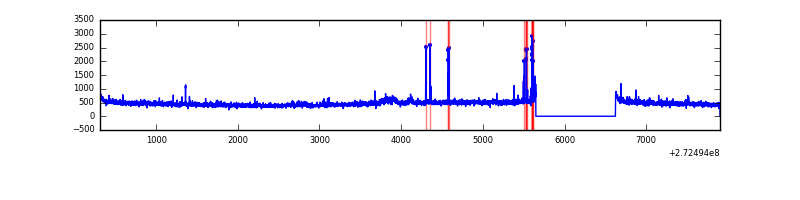 |
| B | 7591 | 6616 | 0 | 0 | 0.00% | 0.00% | 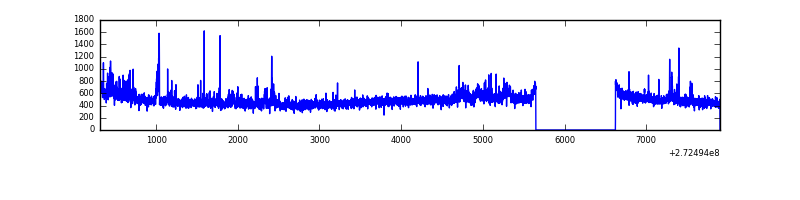 |
| C | 7590 | 6615 | 0 | 0 | 0.00% | 0.00% | 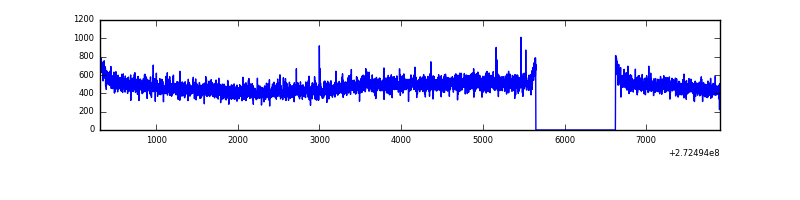 |
| D | 7591 | 6616 | 342 | 342 | 4.51% | 5.17% | 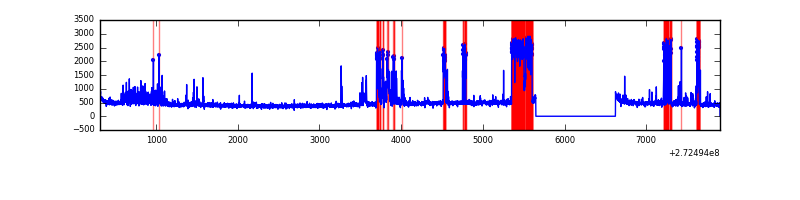 |
Top three noisy pixels from each quadrant. If the there are fewer than three noisy pixels in the level2.evt file, extra rows are filled as -1
| Pixel properties | Quadrant properties | ||||||
|---|---|---|---|---|---|---|---|
| Quadrant | DetID | PixID | Counts | Sigma | Mean | Median | Sigma |
| A | 4 | 2 | 85628 | 537.83 | 778 | 763 | 157.8 |
| A | 15 | 157 | 50473 | 315.04 | 778 | 763 | 157.8 |
| A | 0 | 226 | 6869 | 38.7 | 778 | 763 | 157.8 |
| B | 4 | 216 | 40543 | 265.49 | 784 | 763 | 149.8 |
| B | 3 | 64 | 40056 | 262.24 | 784 | 763 | 149.8 |
| B | 0 | 189 | 38844 | 254.15 | 784 | 763 | 149.8 |
| C | 14 | 238 | 112832 | 638.99 | 747 | 753 | 175.4 |
| C | 3 | 233 | 110823 | 627.54 | 747 | 753 | 175.4 |
| C | 0 | 207 | 7442 | 38.14 | 747 | 753 | 175.4 |
| D | 1 | 52 | 938279 | 4710.47 | 730 | 714 | 199.0 |
| D | 12 | 110 | 123538 | 617.09 | 730 | 714 | 199.0 |
| D | 2 | 16 | 94883 | 473.12 | 730 | 714 | 199.0 |
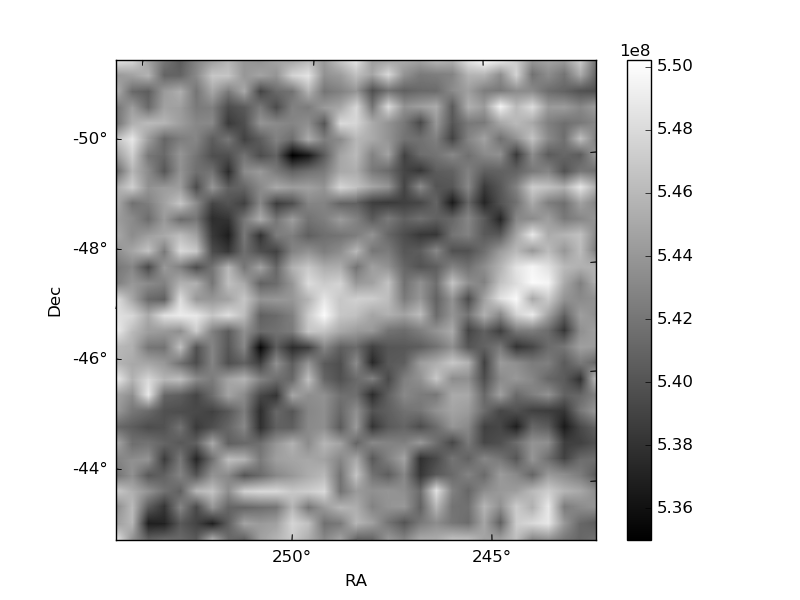
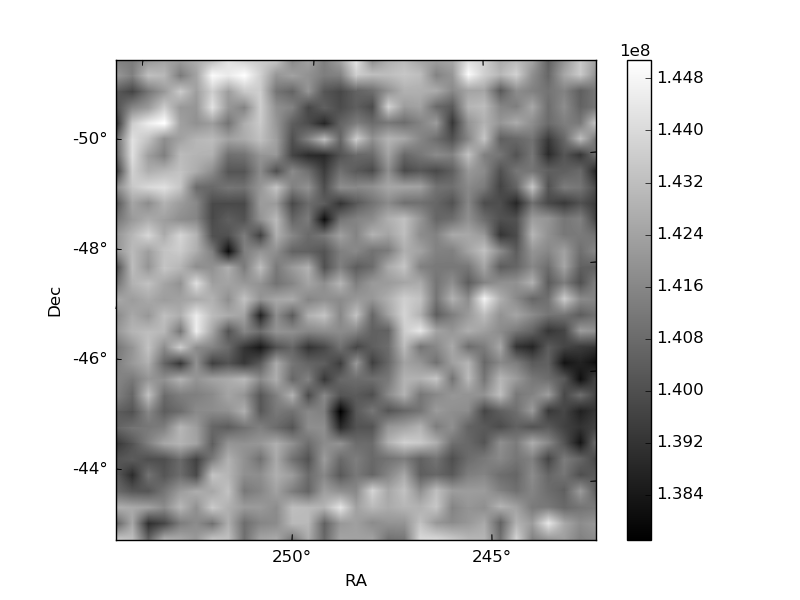
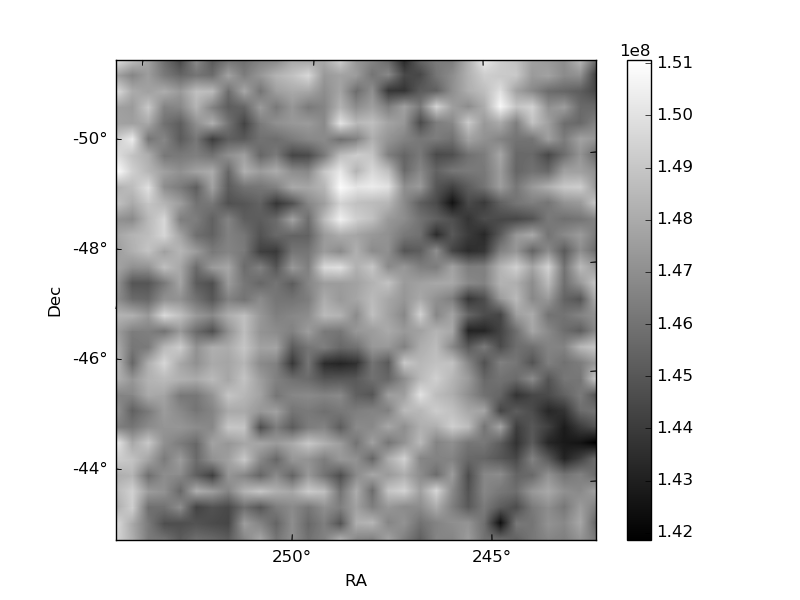
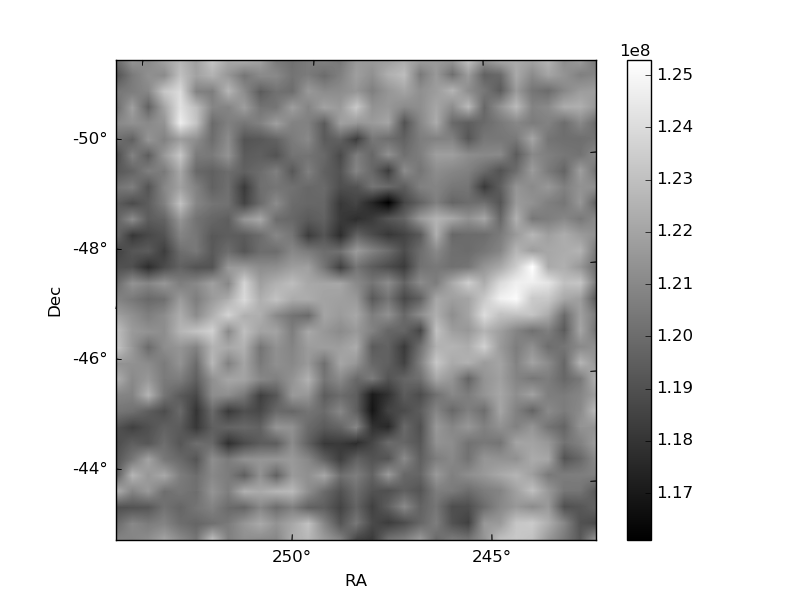
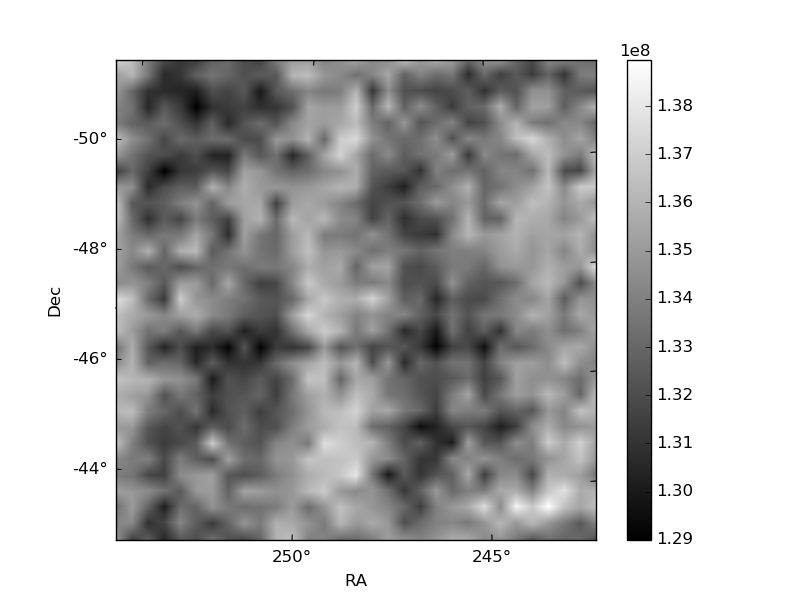
Histogram calculated using DETX and DETY for each event in the final _common_clean file
| Quadrant A | 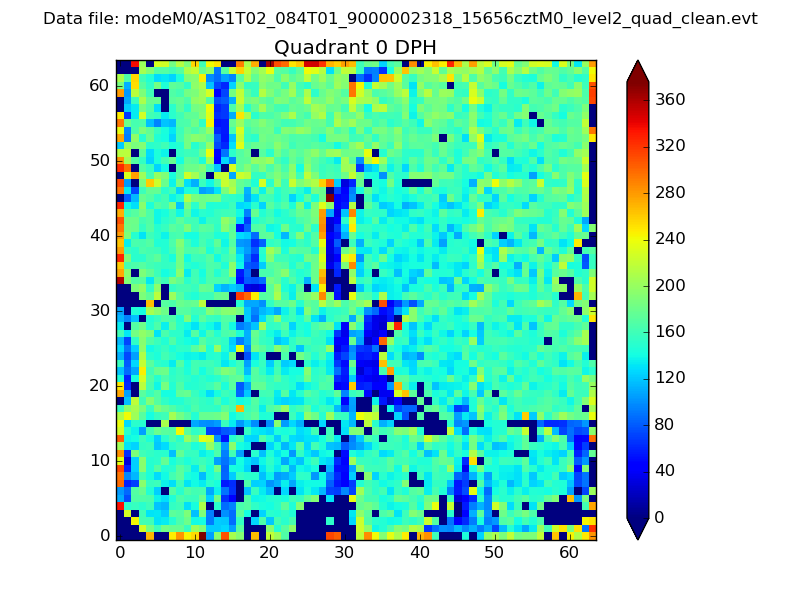 |
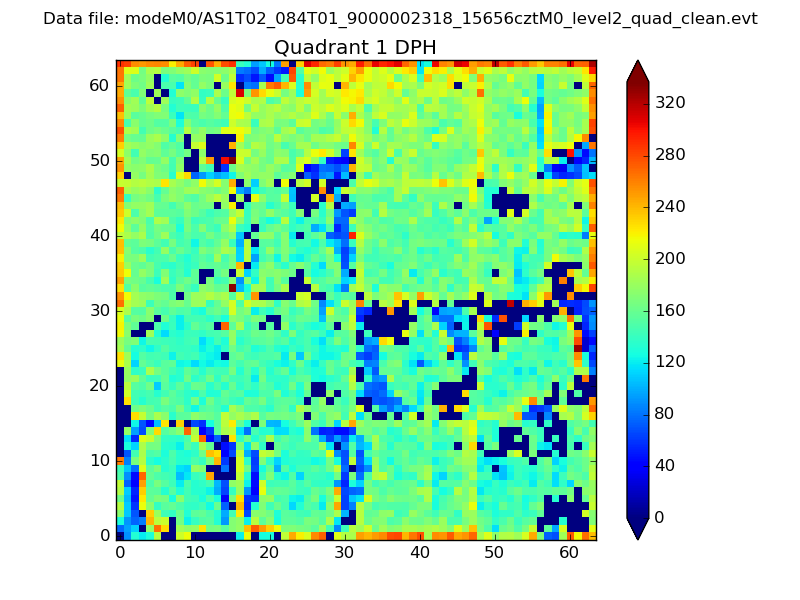 |
Quadrant B |
|---|---|---|---|
| Quadrant D | 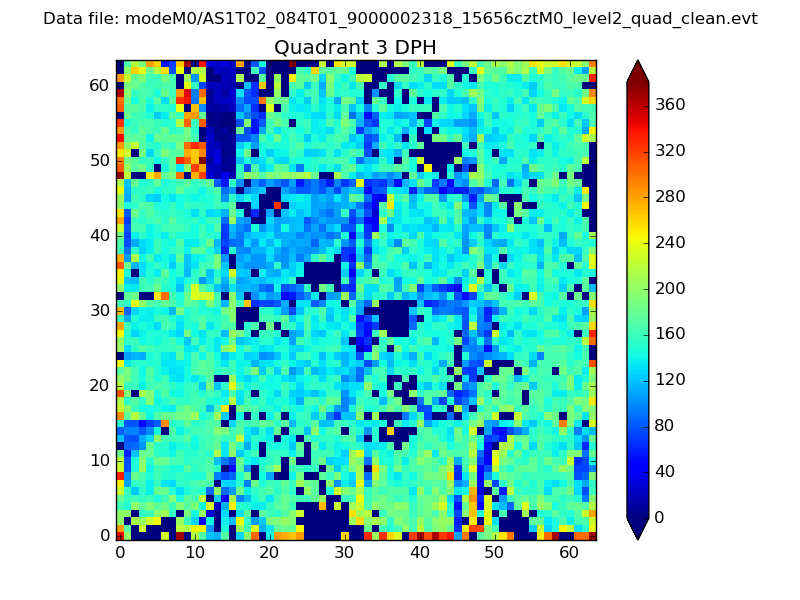 |
 |
Quadrant C |
| Plot type | Count rate plots | Images |
|---|---|---|
| Comparison with Poisson distribution Blue bars denote a histogram of data divided into 1 sec bins. Red curve is a Poisson curve with rate = median count rate of data. |
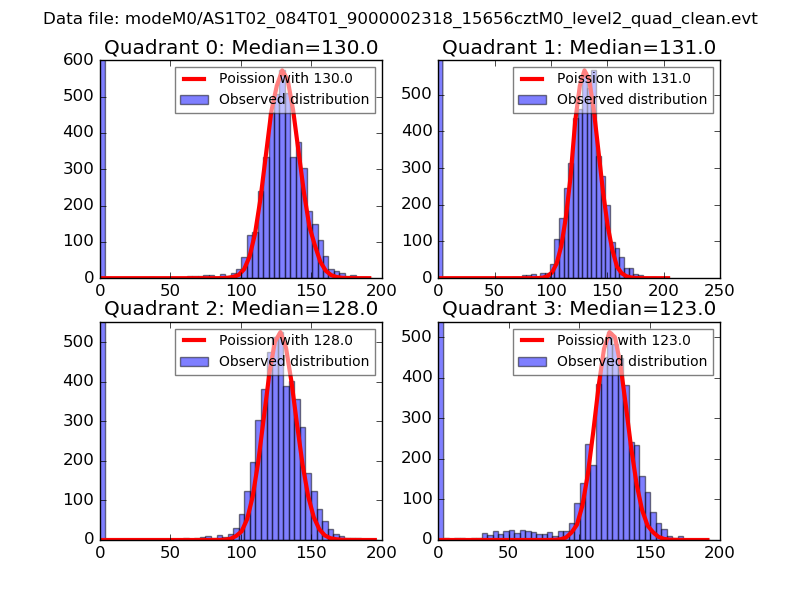 |
 |
| Quadrant-wise count rates Data is divided into 100 sec bins |
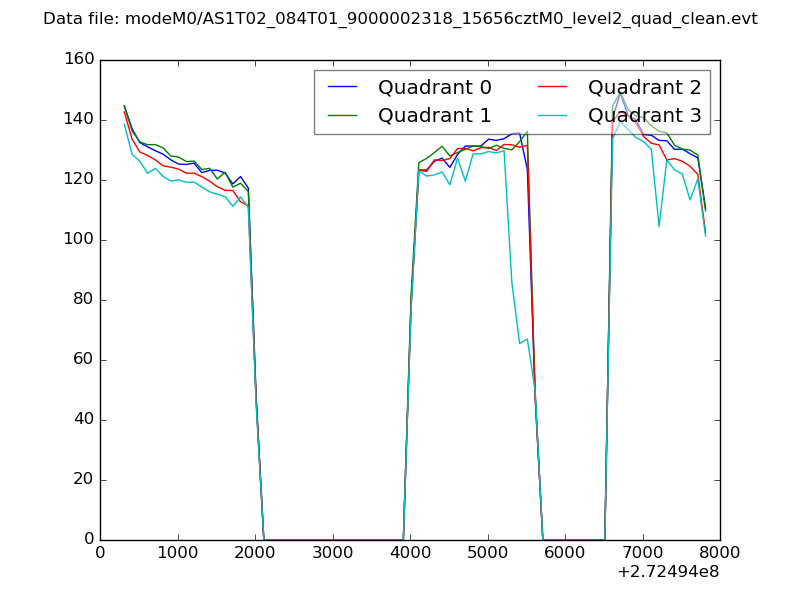 |
|
| Module-wise count rates for Quadrant A Data is divided into 100 sec bins |
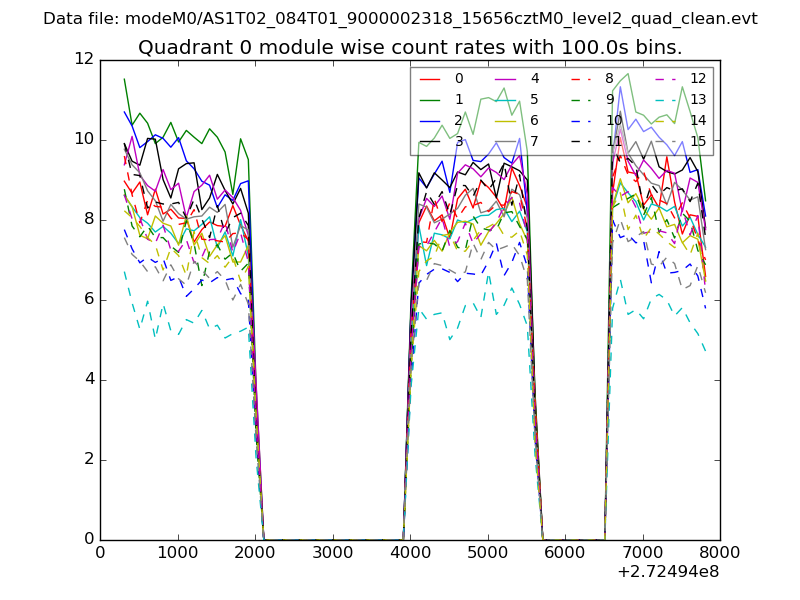 |
 |
| Module-wise count rates for Quadrant B Data is divided into 100 sec bins |
 |
 |
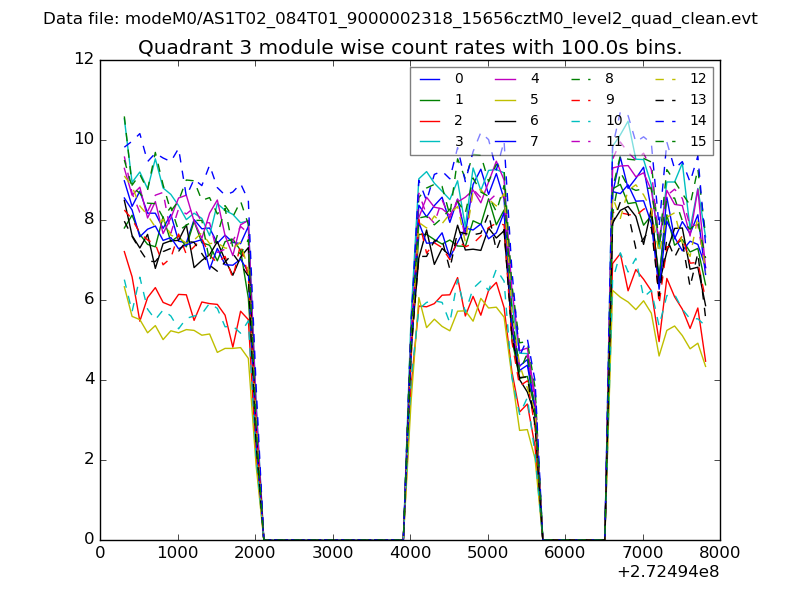
| Module-wise count rates for Quadrant C Data is divided into 100 sec bins |
 |
 |
| Module-wise count rates for Quadrant D Data is divided into 100 sec bins |
 |
 |
| Parameter | Plot |
|---|---|
| CZT HV Monitor | 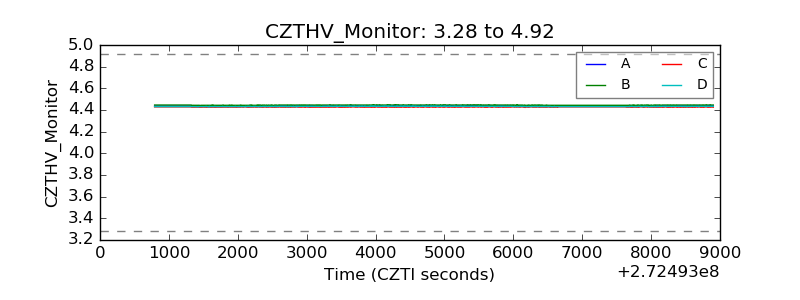 |
| D_VDD | 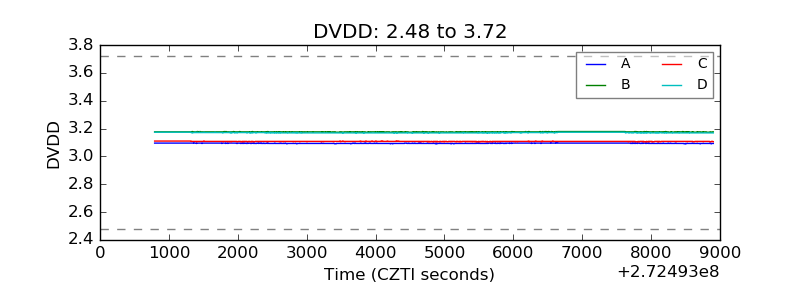 |
| Temperature 1 | 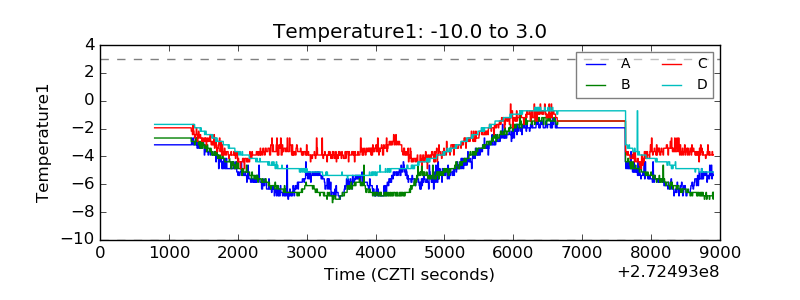 |
| Veto HV Monitor | 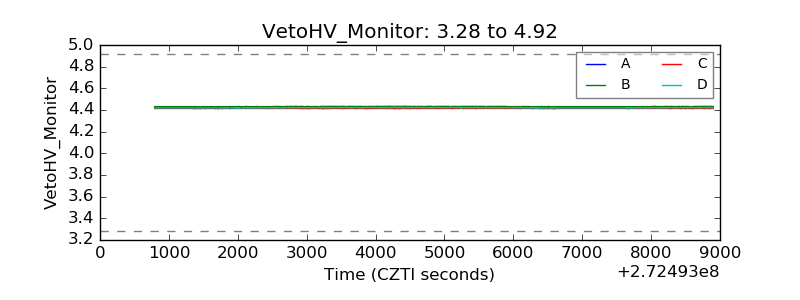 |
| Veto LLD | 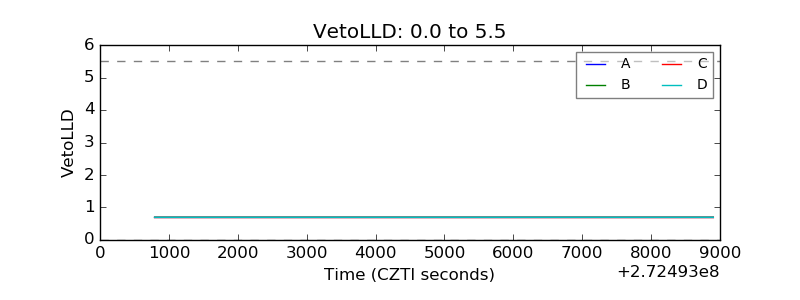 |
| Alpha Counter |  |
| _CPM_Rate | 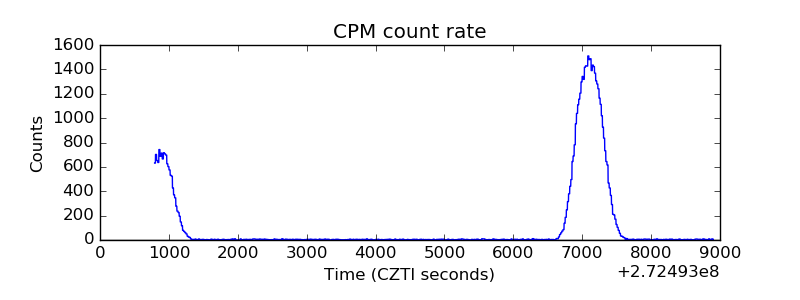 |
| CZT Counter |  |
| +2.5 Volts monitor |  |
| +5 Volts monitor | 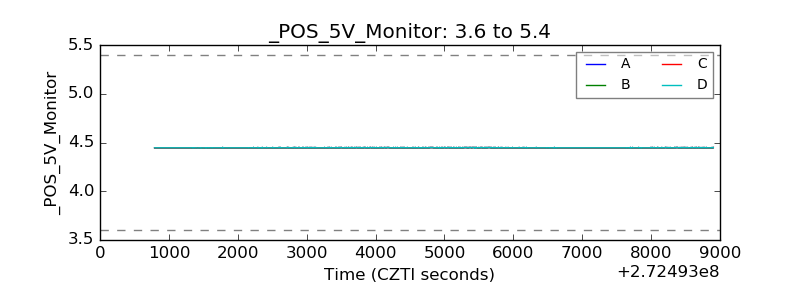 |
| _ROLL_ROT | 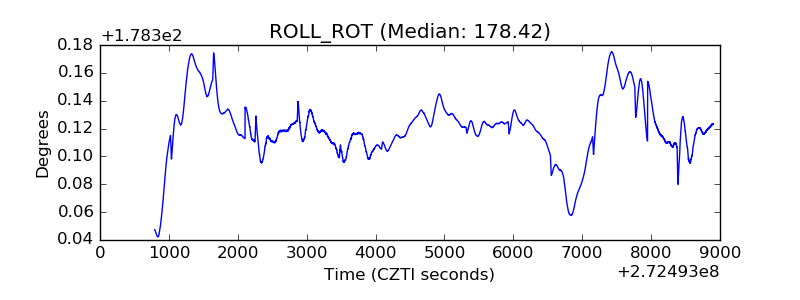 |
| _Roll_DEC | 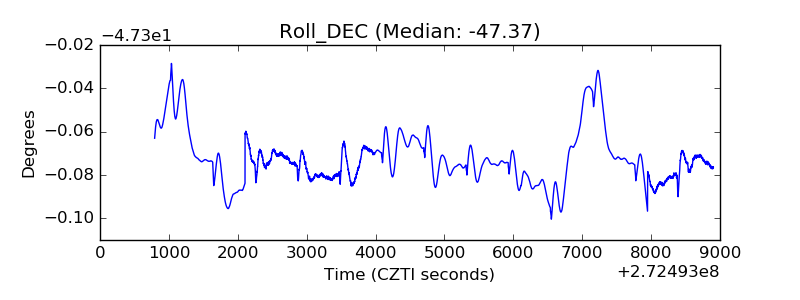 |
| _Roll_RA |  |
| Veto Counter | 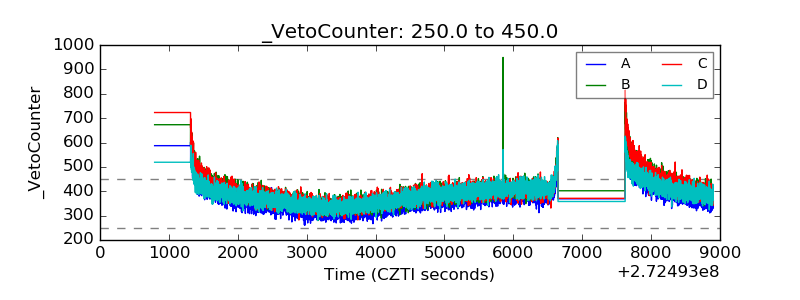 |