| Param | Original file | Final file |
|---|---|---|
| Filename | modeM0/AS1T02_084T01_9000002318_15658cztM0_level2.evt | modeM0/AS1T02_084T01_9000002318_15658cztM0_level2_quad_clean.evt |
| Size (bytes) | 429,186,240 | 87,079,680 |
| Size | 409.3 MB | 83.0 MB |
| Events in quadrant A | 3,030,162 | 551,631 |
| Events in quadrant B | 3,160,058 | 561,001 |
| Events in quadrant C | 3,109,097 | 543,789 |
| Events in quadrant D | 3,255,351 | 526,123 |
| Mode M0 | |||
|---|---|---|---|
| Quadrant | BADHDUFLAG | Total packets | Discarded packets |
| A | 0 | 13327 | 3 |
| B | 0 | 13561 | 2 |
| C | 0 | 13317 | 2 |
| D | 0 | 14190 | 2 |
| Mode M9 | |||
|---|---|---|---|
| Quadrant | BADHDUFLAG | Total packets | Discarded packets |
| A | 0 | 21 | 0 |
| B | 0 | 21 | 0 |
| C | 0 | 21 | 0 |
| D | 0 | 21 | 0 |
| Mode SS | |||
|---|---|---|---|
| Quadrant | BADHDUFLAG | Total packets | Discarded packets |
| A | 0 | 134 | 0 |
| B | 0 | 134 | 0 |
| C | 0 | 134 | 0 |
| D | 0 | 134 | 0 |
| Quadrant | Total seconds | Saturated seconds | Saturation percentage |
|---|---|---|---|
| A | 6518 | 45 | 0.690396% |
| B | 6518 | 51 | 0.782449% |
| C | 6518 | 67 | 1.027923% |
| D | 6518 | 119 | 1.825713% |
Noise dominated data is calculated using 1-second bins in cleaned event files. If a bin has >2000 counts, and if more than 50% of those come from <1% of pixels, then it is considered to be noise-dominated and hence unusable.
| Quadrant | # 1 sec bins | Bins with >0 counts | Bins with >2000 counts | High rate bins dominated by noise | Noise dominated (total time) | Noise dominated (detector-on time) | Marked lightcurve |
|---|---|---|---|---|---|---|---|
| A | 8603 | 6518 | 0 | 0 | 0.00% | 0.00% | 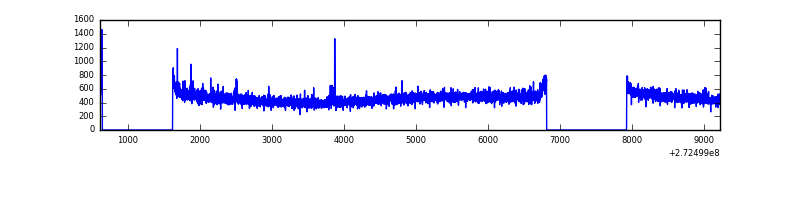 |
| B | 8603 | 6518 | 0 | 0 | 0.00% | 0.00% | 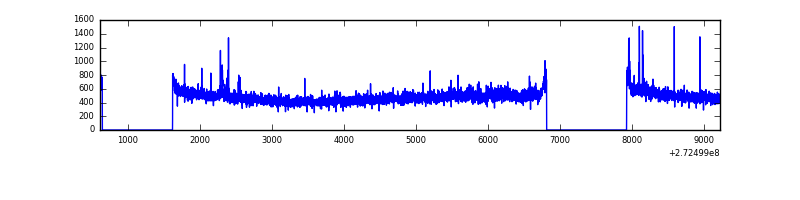 |
| C | 8603 | 6518 | 0 | 0 | 0.00% | 0.00% | 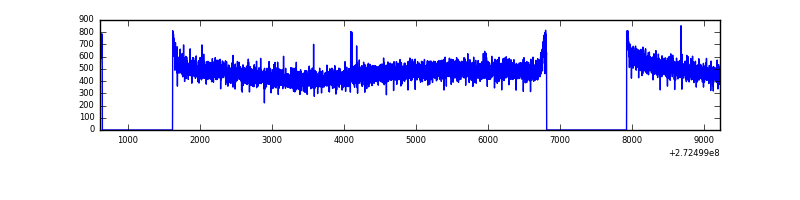 |
| D | 8603 | 6518 | 90 | 90 | 1.05% | 1.38% | 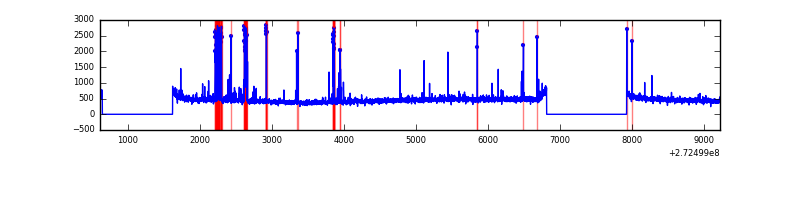 |
Top three noisy pixels from each quadrant. If the there are fewer than three noisy pixels in the level2.evt file, extra rows are filled as -1
| Pixel properties | Quadrant properties | ||||||
|---|---|---|---|---|---|---|---|
| Quadrant | DetID | PixID | Counts | Sigma | Mean | Median | Sigma |
| A | 4 | 2 | 16688 | 100.77 | 782 | 768 | 158.0 |
| A | 0 | 226 | 7042 | 39.71 | 782 | 768 | 158.0 |
| A | 15 | 157 | 5682 | 31.1 | 782 | 768 | 158.0 |
| B | 0 | 189 | 21739 | 139.41 | 790 | 772 | 150.4 |
| B | 12 | 111 | 17721 | 112.69 | 790 | 772 | 150.4 |
| B | 11 | 111 | 14780 | 93.14 | 790 | 772 | 150.4 |
| C | 14 | 238 | 119015 | 673.16 | 756 | 760 | 175.7 |
| C | 3 | 233 | 29369 | 162.86 | 756 | 760 | 175.7 |
| C | 13 | 61 | 5522 | 27.11 | 756 | 760 | 175.7 |
| D | 1 | 52 | 159759 | 864.15 | 758 | 736 | 184.0 |
| D | 12 | 110 | 111023 | 599.31 | 758 | 736 | 184.0 |
| D | 9 | 68 | 31405 | 166.66 | 758 | 736 | 184.0 |
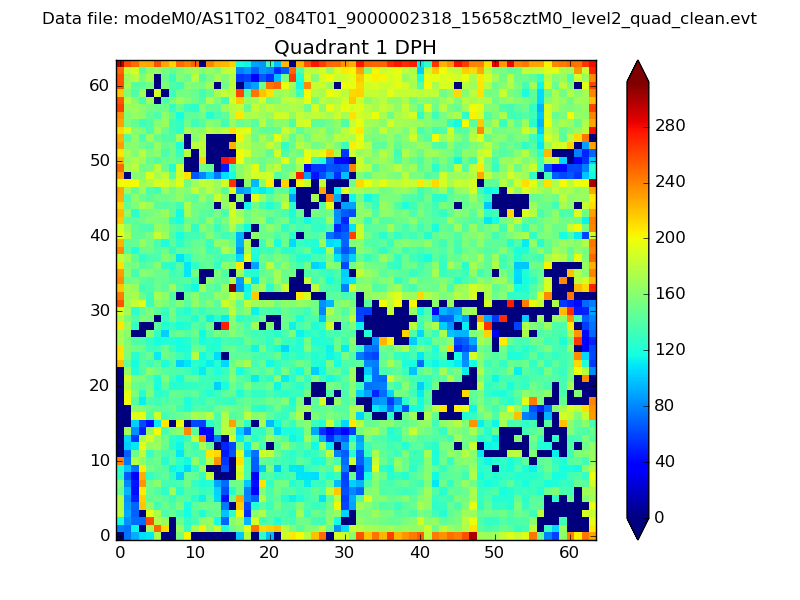
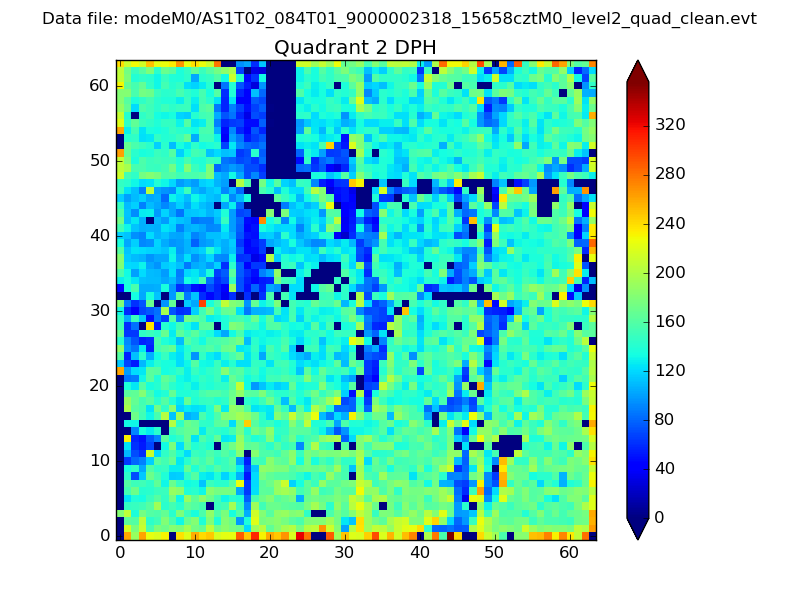
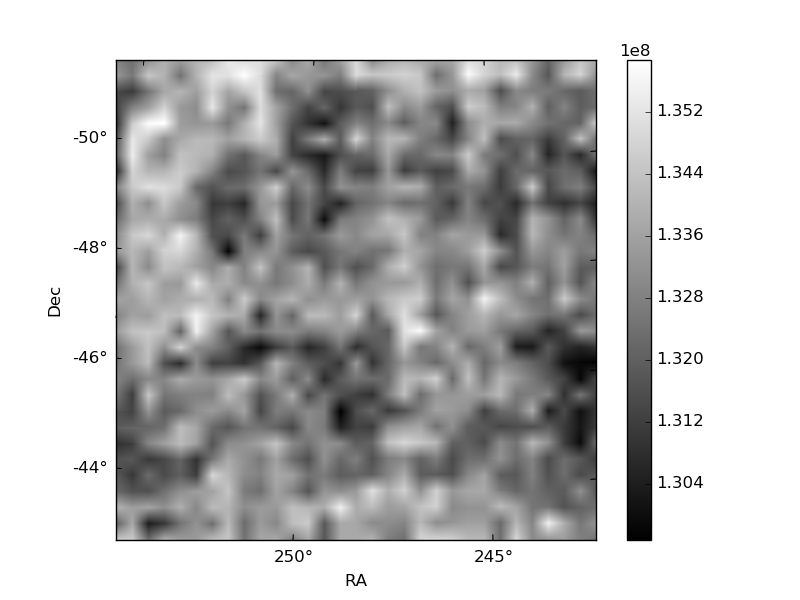
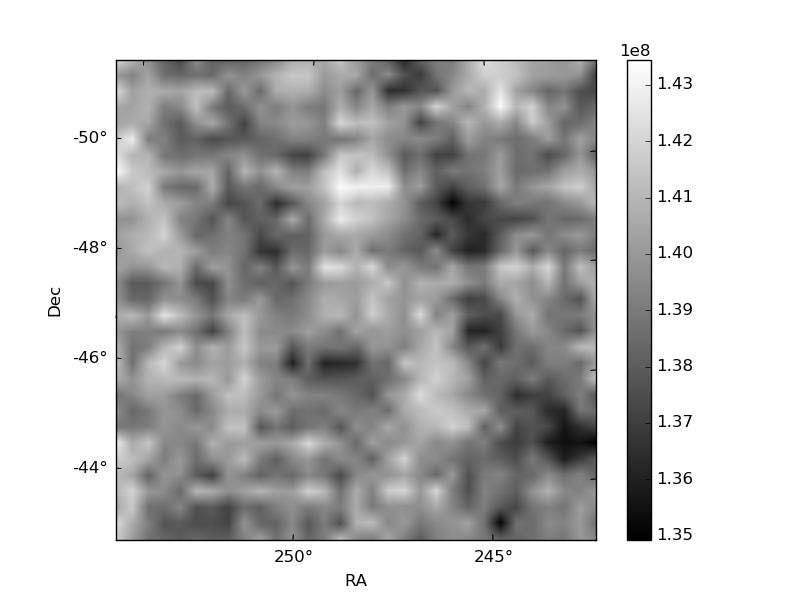
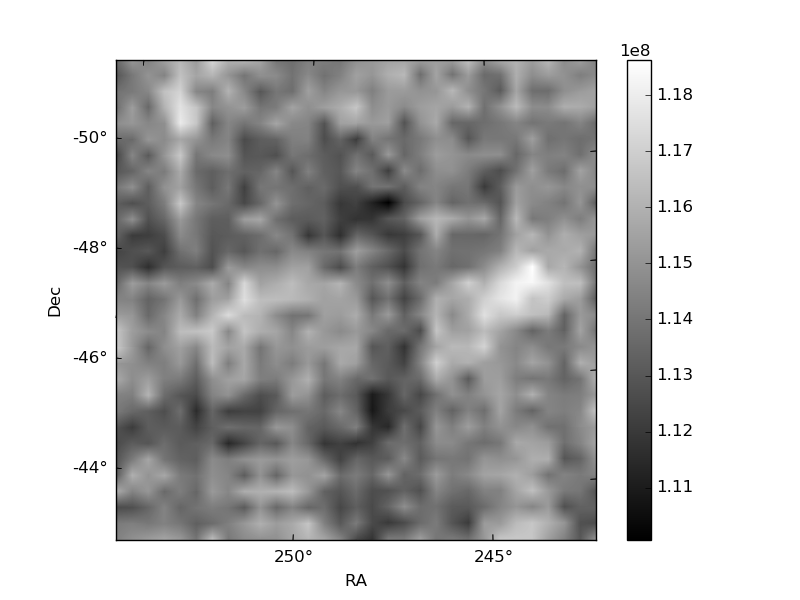
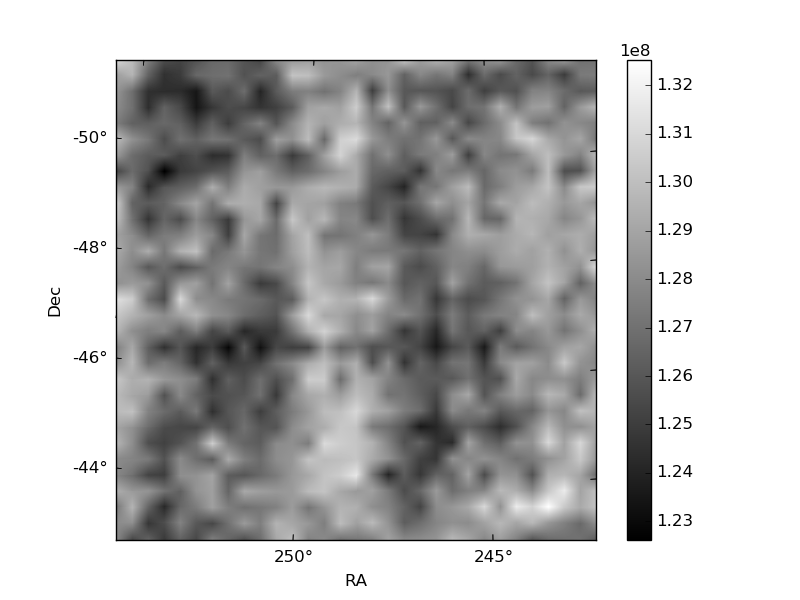
Histogram calculated using DETX and DETY for each event in the final _common_clean file
| Quadrant A |  |
 |
Quadrant B |
|---|---|---|---|
| Quadrant D | 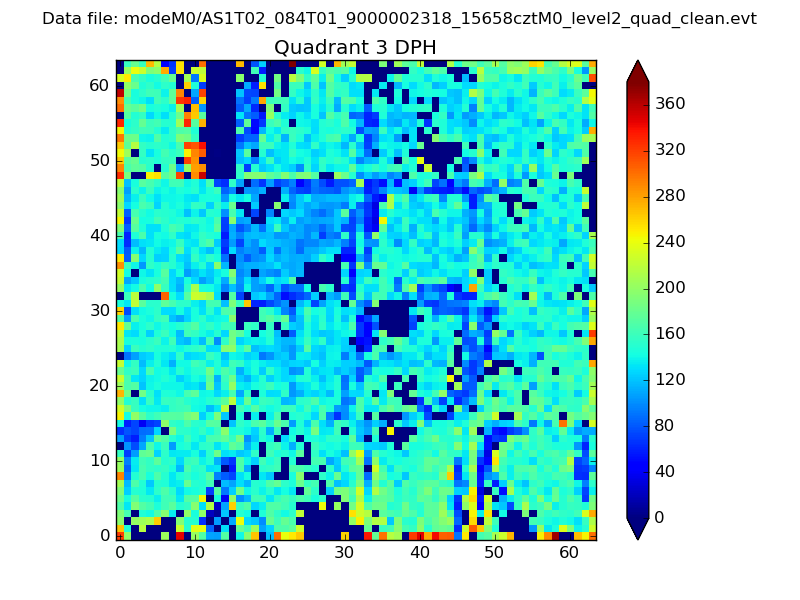 |
 |
Quadrant C |
| Plot type | Count rate plots | Images |
|---|---|---|
| Comparison with Poisson distribution Blue bars denote a histogram of data divided into 1 sec bins. Red curve is a Poisson curve with rate = median count rate of data. |
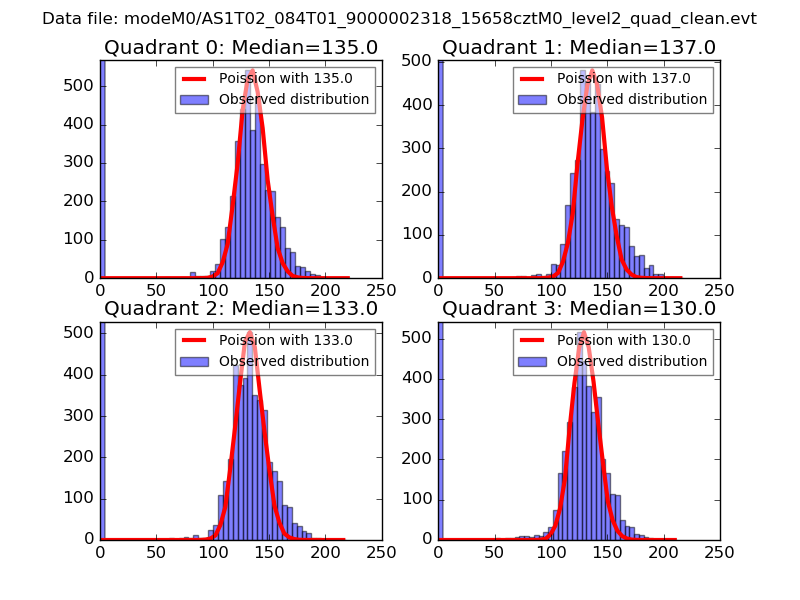 |
 |
| Quadrant-wise count rates Data is divided into 100 sec bins |
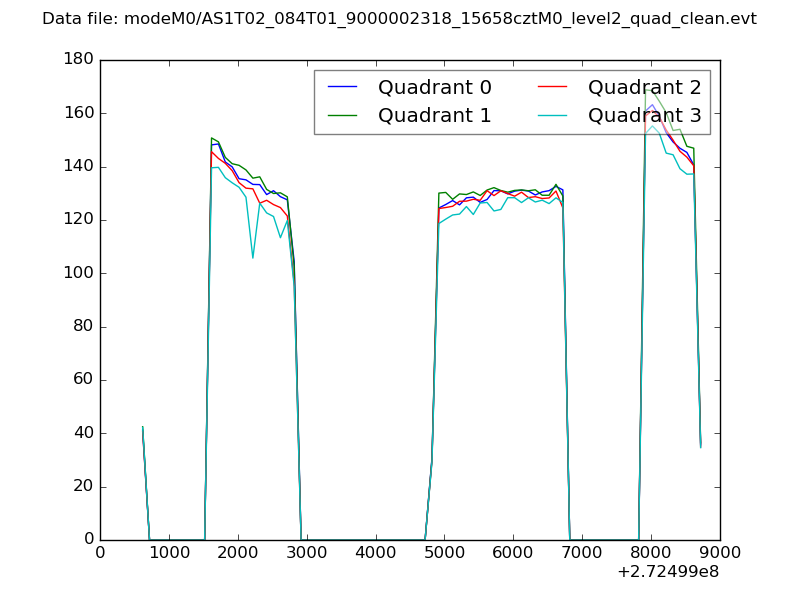 |
|
| Module-wise count rates for Quadrant A Data is divided into 100 sec bins |
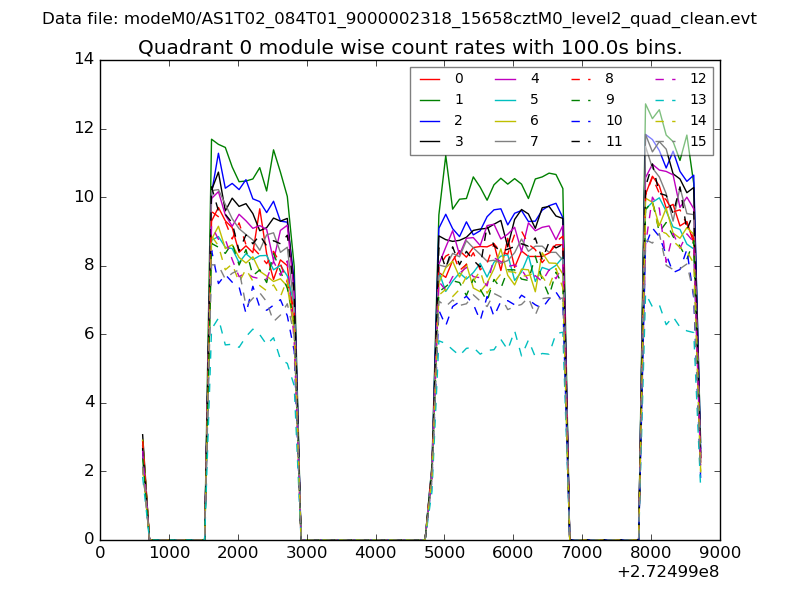 |
 |
| Module-wise count rates for Quadrant B Data is divided into 100 sec bins |
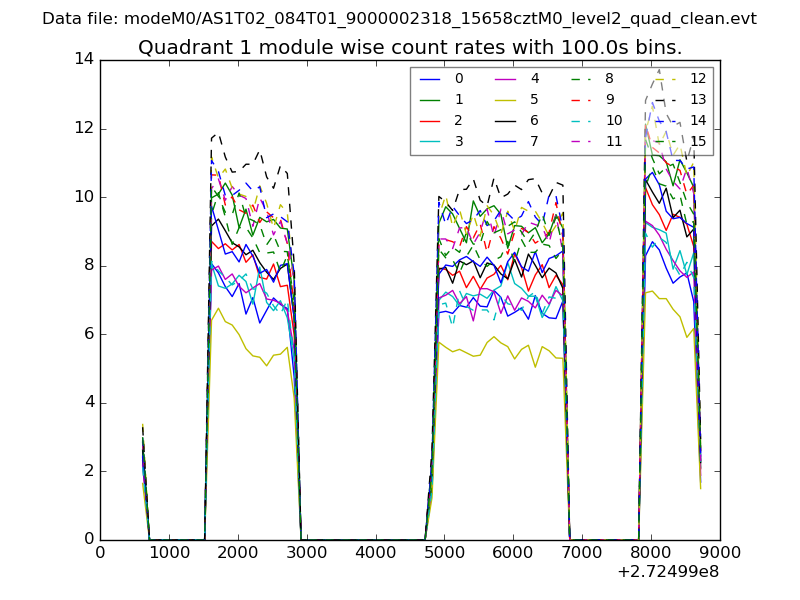 |
 |
| Module-wise count rates for Quadrant C Data is divided into 100 sec bins |
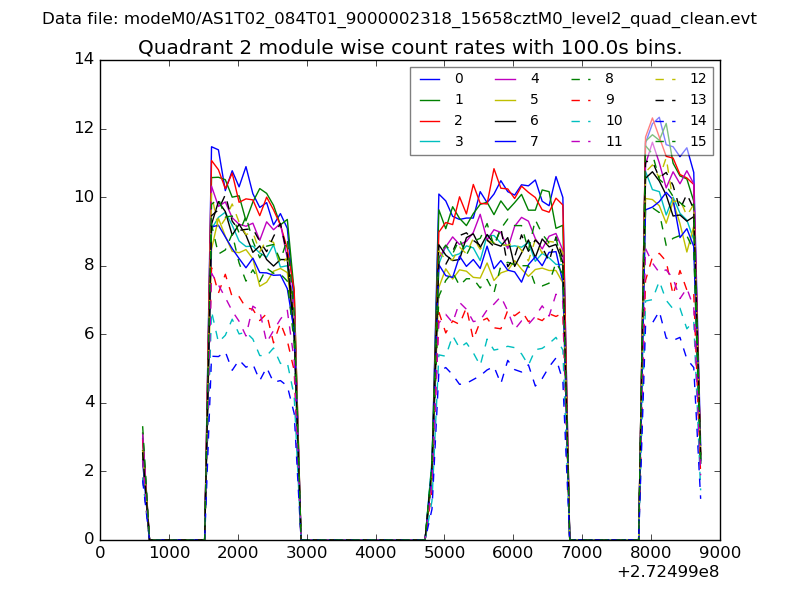 |
 |
| Module-wise count rates for Quadrant D Data is divided into 100 sec bins |
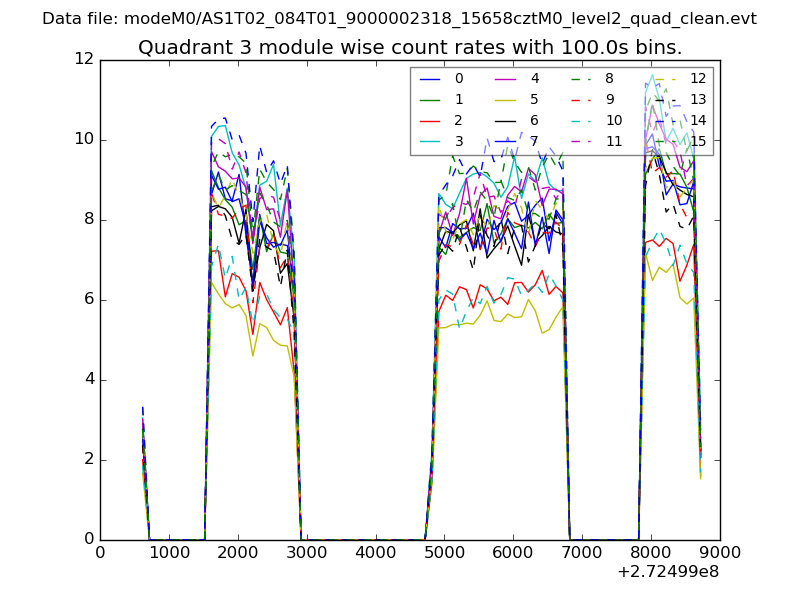 |
 |
| Parameter | Plot |
|---|---|
| CZT HV Monitor | 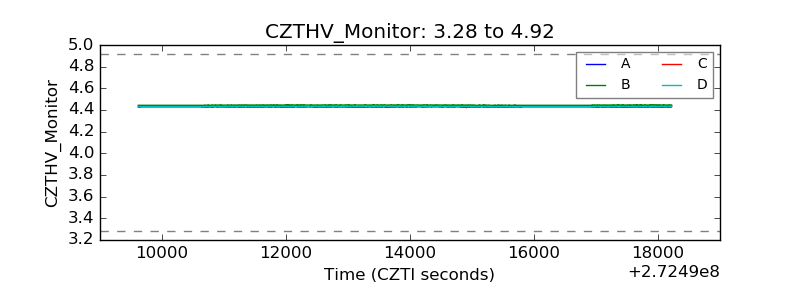 |
| D_VDD | 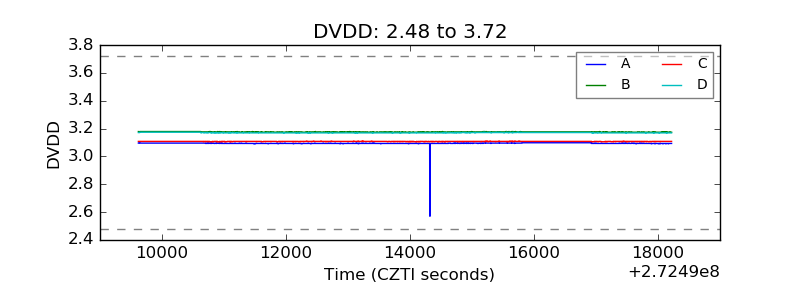 |
| Temperature 1 | 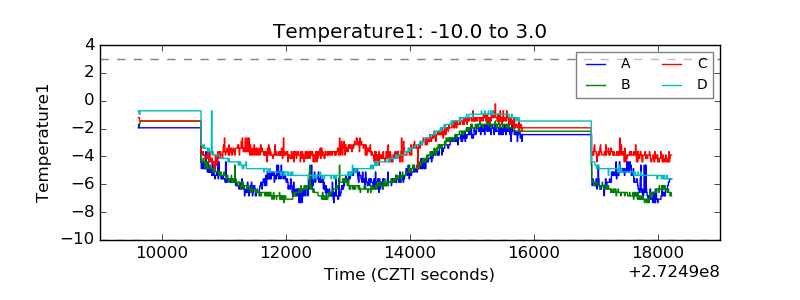 |
| Veto HV Monitor |  |
| Veto LLD | 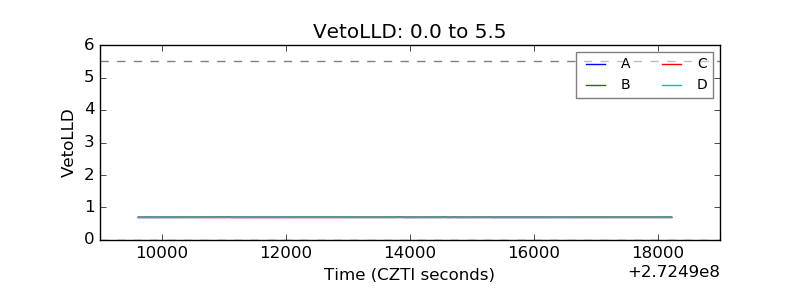 |
| Alpha Counter | 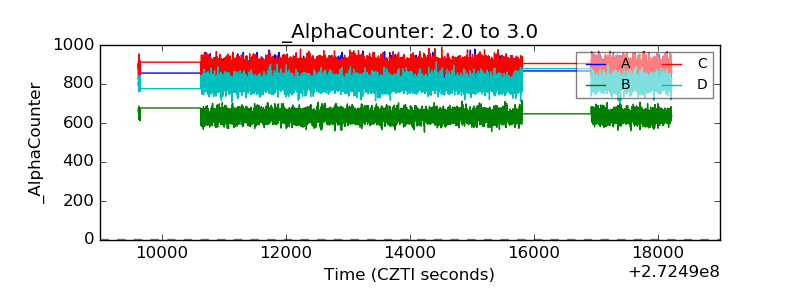 |
| _CPM_Rate | 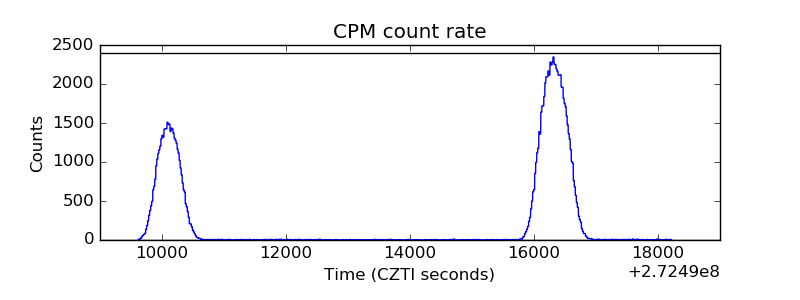 |
| CZT Counter |  |
| +2.5 Volts monitor |  |
| +5 Volts monitor | 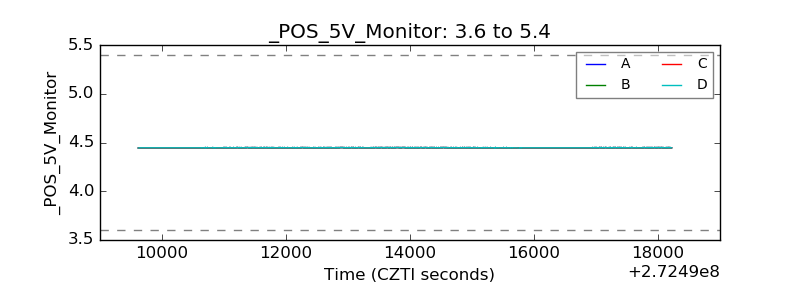 |
| _ROLL_ROT | 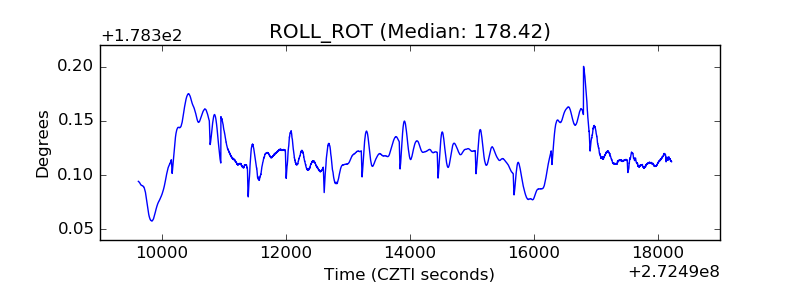 |
| _Roll_DEC | 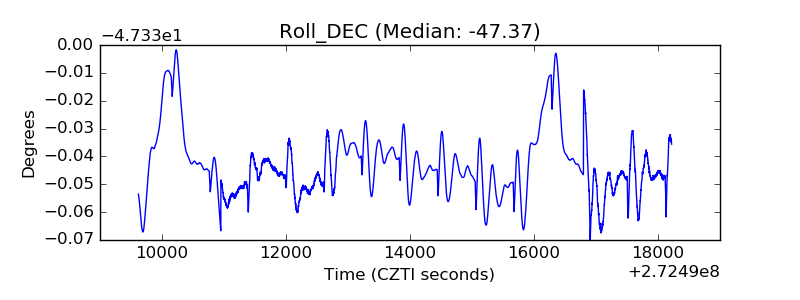 |
| _Roll_RA |  |
| Veto Counter | 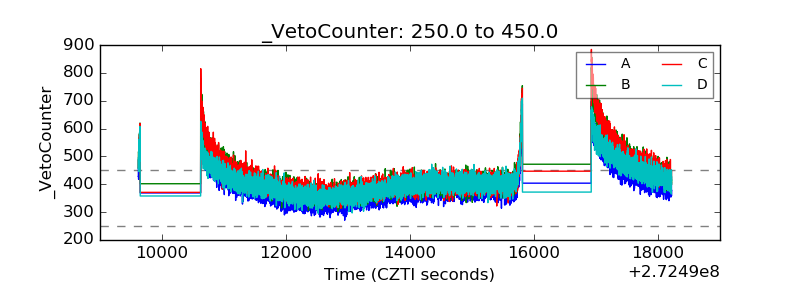 |