| Param | Original file | Final file |
|---|---|---|
| Filename | modeM0/AS1T02_084T01_9000002318_15659cztM0_level2.evt | modeM0/AS1T02_084T01_9000002318_15659cztM0_level2_quad_clean.evt |
| Size (bytes) | 460,247,040 | 85,919,040 |
| Size | 438.9 MB | 81.9 MB |
| Events in quadrant A | 3,280,680 | 533,777 |
| Events in quadrant B | 3,426,547 | 545,780 |
| Events in quadrant C | 3,416,413 | 530,489 |
| Events in quadrant D | 3,352,641 | 517,621 |
| Mode M0 | |||
|---|---|---|---|
| Quadrant | BADHDUFLAG | Total packets | Discarded packets |
| A | 0 | 14005 | 3 |
| B | 0 | 14335 | 2 |
| C | 0 | 14228 | 2 |
| D | 0 | 14392 | 2 |
| Mode M9 | |||
|---|---|---|---|
| Quadrant | BADHDUFLAG | Total packets | Discarded packets |
| A | 0 | 23 | 0 |
| B | 0 | 23 | 0 |
| C | 0 | 23 | 0 |
| D | 0 | 23 | 0 |
| Mode SS | |||
|---|---|---|---|
| Quadrant | BADHDUFLAG | Total packets | Discarded packets |
| A | 0 | 142 | 0 |
| B | 0 | 142 | 0 |
| C | 0 | 142 | 0 |
| D | 0 | 142 | 0 |
| Quadrant | Total seconds | Saturated seconds | Saturation percentage |
|---|---|---|---|
| A | 6796 | 52 | 0.765156% |
| B | 6796 | 67 | 0.985874% |
| C | 6796 | 96 | 1.412596% |
| D | 6796 | 80 | 1.177163% |
Noise dominated data is calculated using 1-second bins in cleaned event files. If a bin has >2000 counts, and if more than 50% of those come from <1% of pixels, then it is considered to be noise-dominated and hence unusable.
| Quadrant | # 1 sec bins | Bins with >0 counts | Bins with >2000 counts | High rate bins dominated by noise | Noise dominated (total time) | Noise dominated (detector-on time) | Marked lightcurve |
|---|---|---|---|---|---|---|---|
| A | 9136 | 6796 | 0 | 0 | 0.00% | 0.00% | 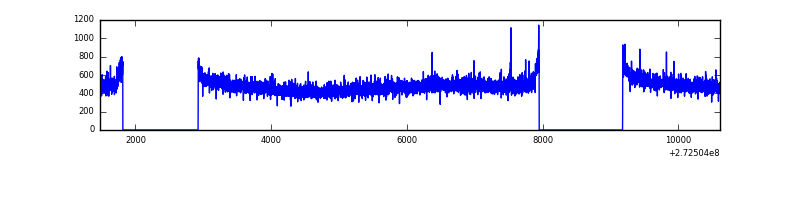 |
| B | 9136 | 6796 | 5 | 5 | 0.05% | 0.07% | 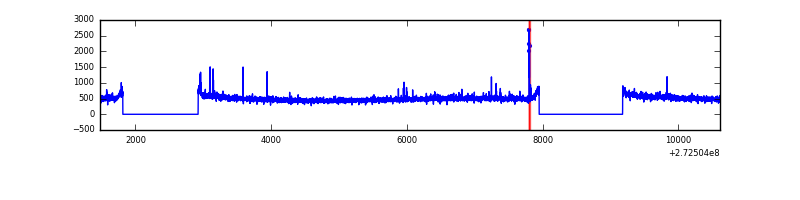 |
| C | 9136 | 6796 | 1 | 1 | 0.01% | 0.01% | 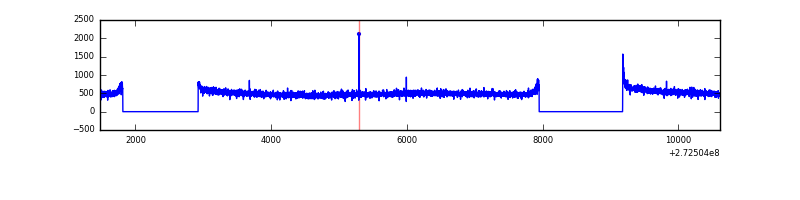 |
| D | 9136 | 6796 | 22 | 22 | 0.24% | 0.32% | 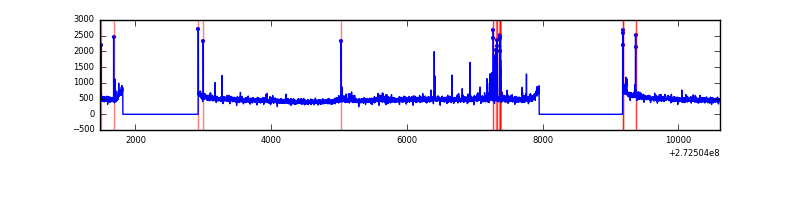 |
Top three noisy pixels from each quadrant. If the there are fewer than three noisy pixels in the level2.evt file, extra rows are filled as -1
| Pixel properties | Quadrant properties | ||||||
|---|---|---|---|---|---|---|---|
| Quadrant | DetID | PixID | Counts | Sigma | Mean | Median | Sigma |
| A | 0 | 226 | 7588 | 40.07 | 850 | 833 | 168.6 |
| A | 12 | 194 | 6331 | 32.62 | 850 | 833 | 168.6 |
| A | 3 | 137 | 5685 | 28.78 | 850 | 833 | 168.6 |
| B | 0 | 189 | 20355 | 122.53 | 855 | 835 | 159.3 |
| B | 0 | 219 | 19865 | 119.45 | 855 | 835 | 159.3 |
| B | 12 | 111 | 18566 | 111.3 | 855 | 835 | 159.3 |
| C | 14 | 238 | 129344 | 675.94 | 827 | 833 | 190.1 |
| C | 3 | 233 | 40332 | 207.76 | 827 | 833 | 190.1 |
| C | 5 | 96 | 7708 | 36.16 | 827 | 833 | 190.1 |
| D | 1 | 52 | 94850 | 469.87 | 830 | 809 | 200.1 |
| D | 13 | 104 | 33179 | 161.74 | 830 | 809 | 200.1 |
| D | 2 | 234 | 28337 | 137.54 | 830 | 809 | 200.1 |
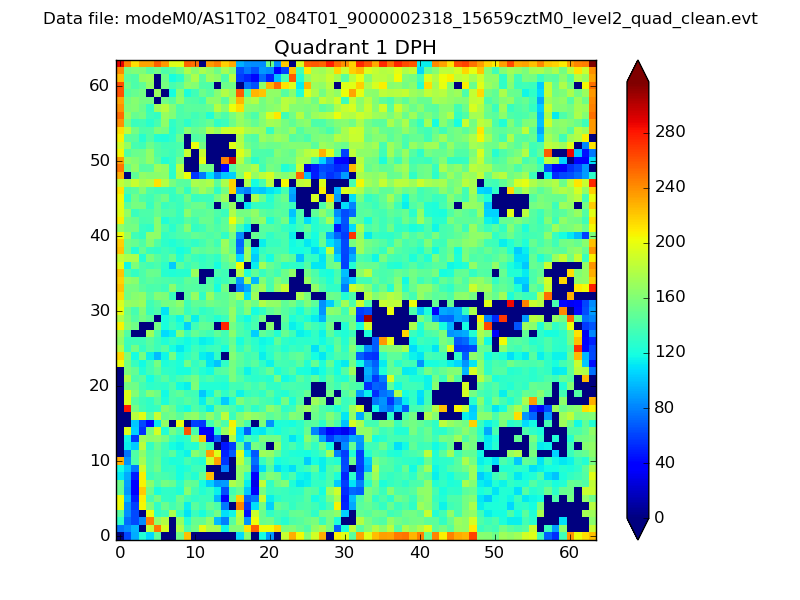
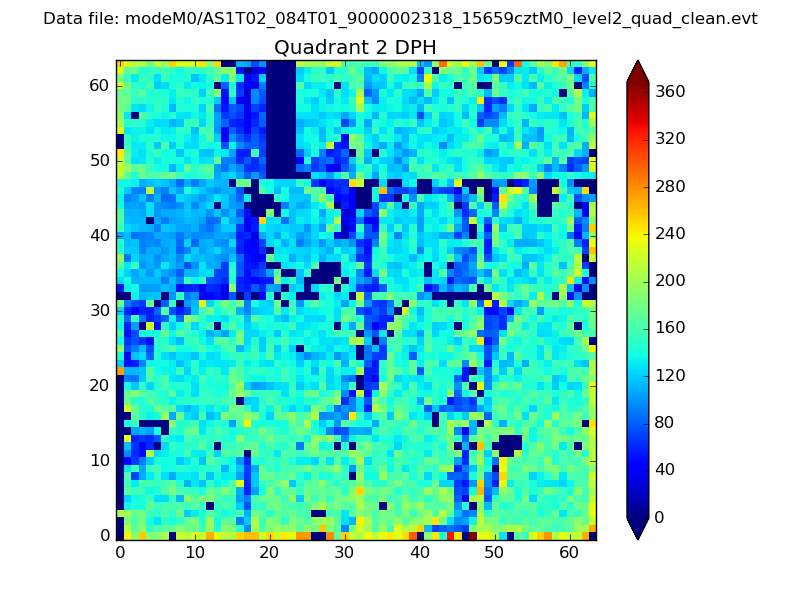
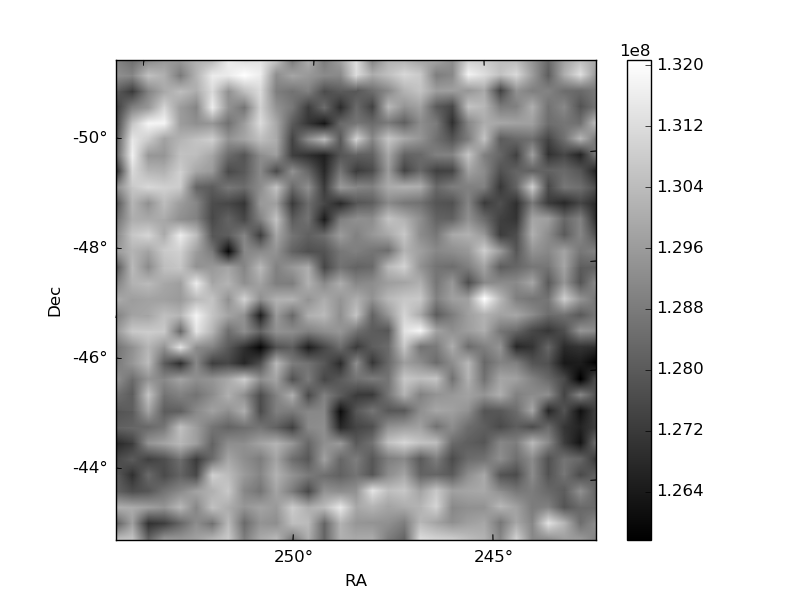
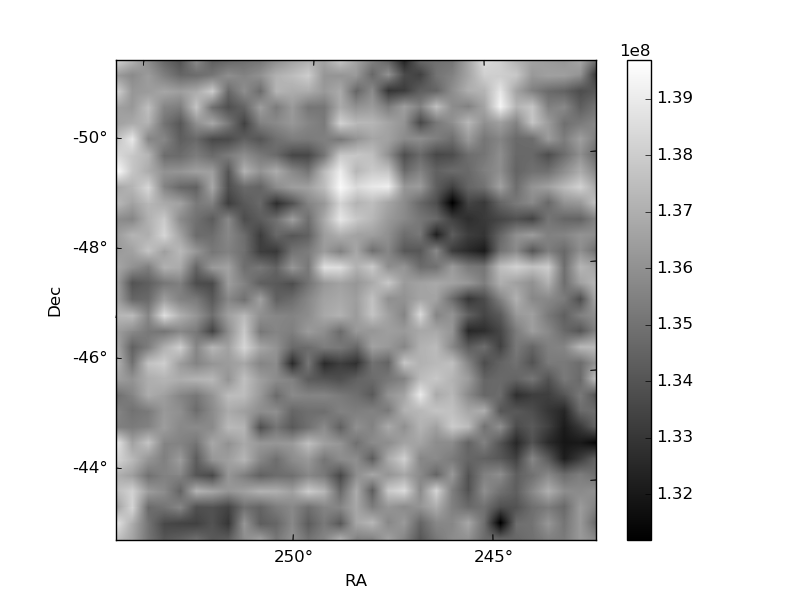
Histogram calculated using DETX and DETY for each event in the final _common_clean file
| Quadrant A |  |
 |
Quadrant B |
|---|---|---|---|
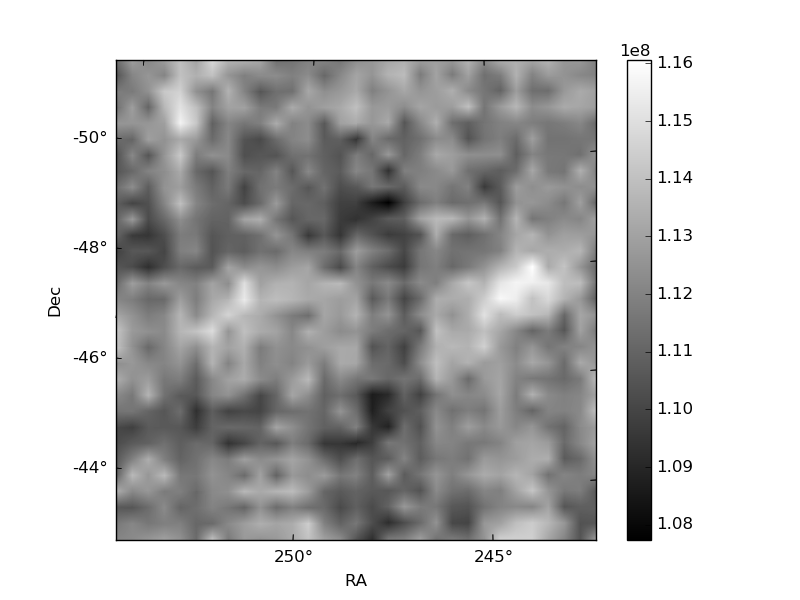
| Quadrant D |  |
 |
Quadrant C |
| Plot type | Count rate plots | Images |
|---|---|---|
| Comparison with Poisson distribution Blue bars denote a histogram of data divided into 1 sec bins. Red curve is a Poisson curve with rate = median count rate of data. |
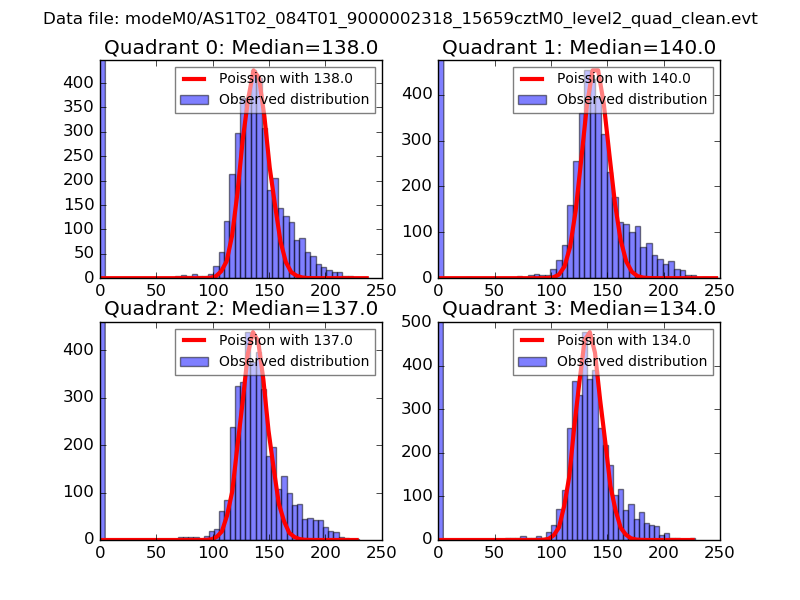 |
 |
| Quadrant-wise count rates Data is divided into 100 sec bins |
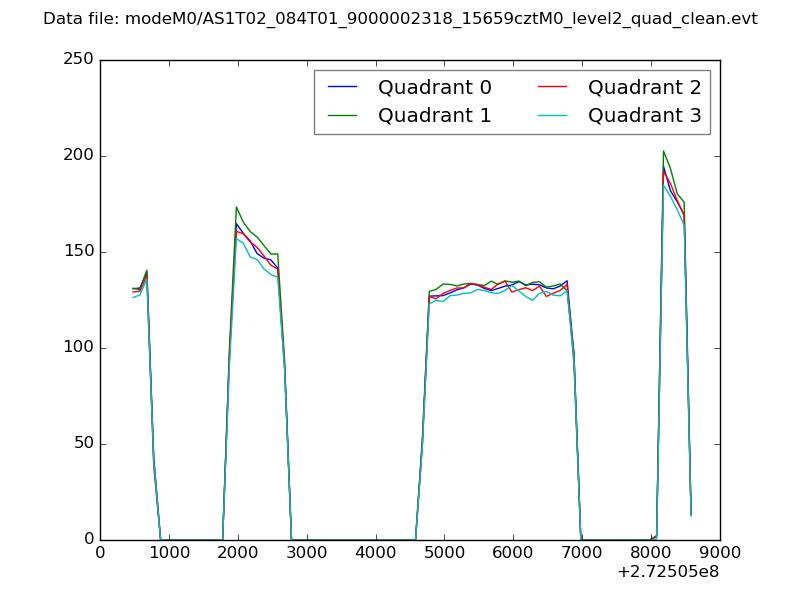 |
|
| Module-wise count rates for Quadrant A Data is divided into 100 sec bins |
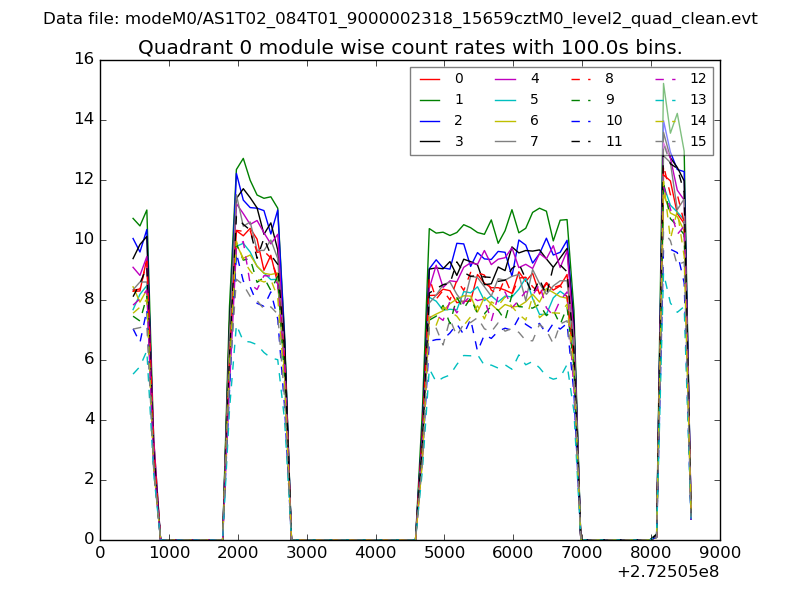 |
 |
| Module-wise count rates for Quadrant B Data is divided into 100 sec bins |
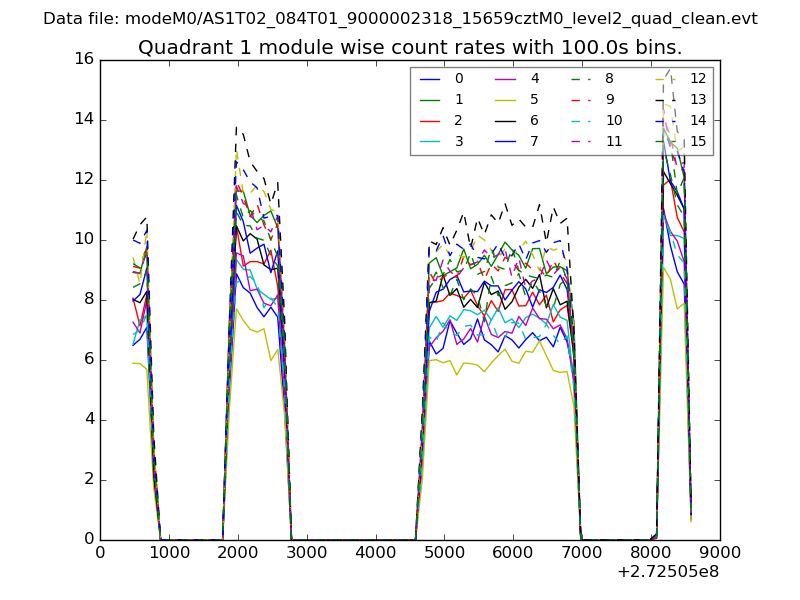 |
 |
| Module-wise count rates for Quadrant C Data is divided into 100 sec bins |
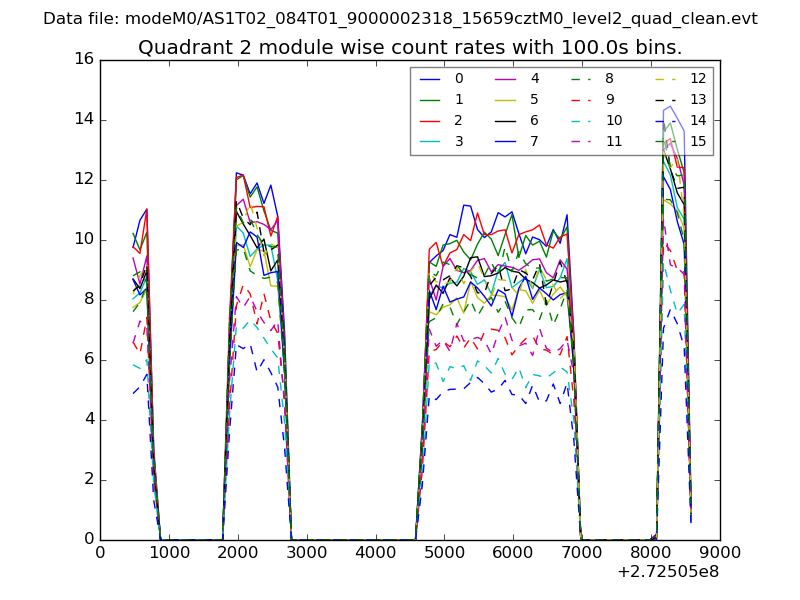 |
 |
| Module-wise count rates for Quadrant D Data is divided into 100 sec bins |
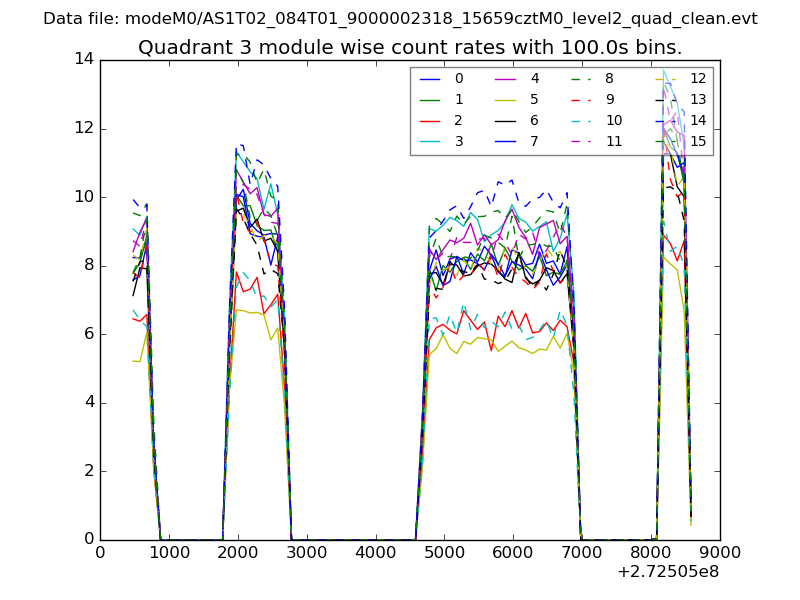 |
 |
| Parameter | Plot |
|---|---|
| CZT HV Monitor | 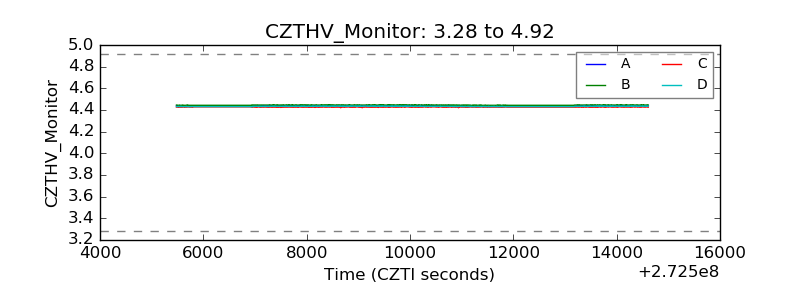 |
| D_VDD | 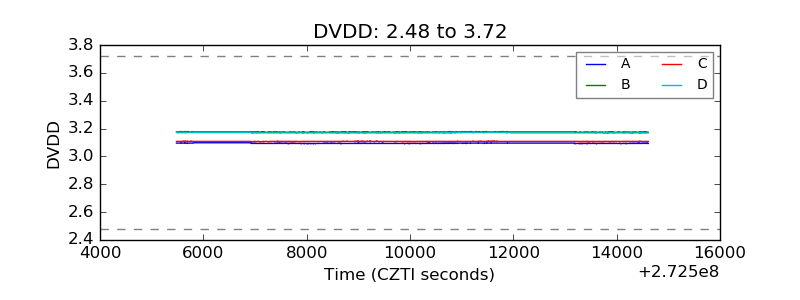 |
| Temperature 1 | 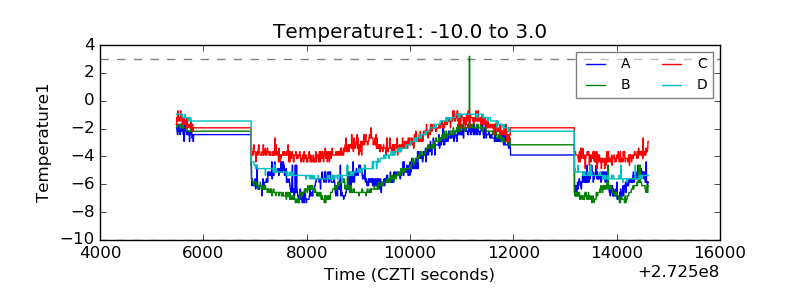 |
| Veto HV Monitor | 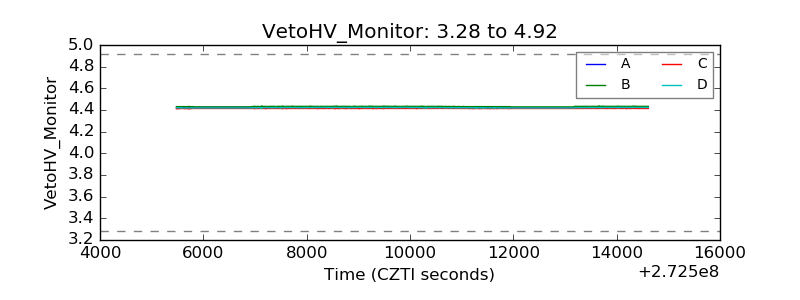 |
| Veto LLD | 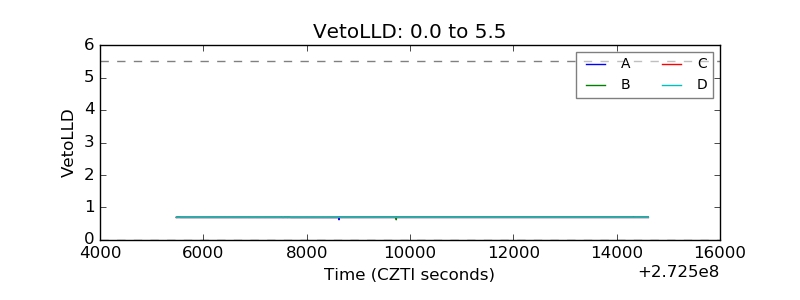 |
| Alpha Counter | 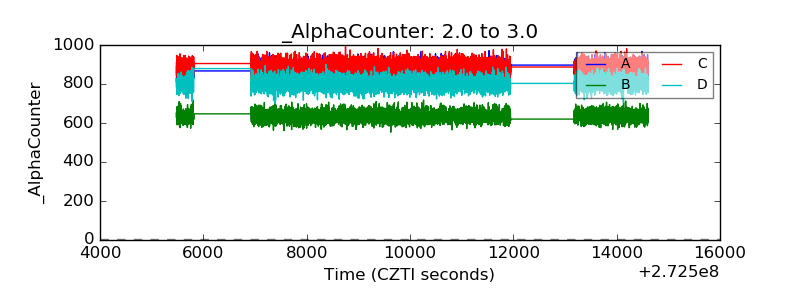 |
| _CPM_Rate | 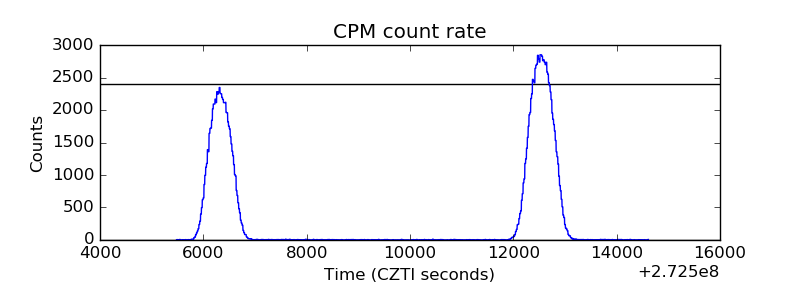 |
| CZT Counter | 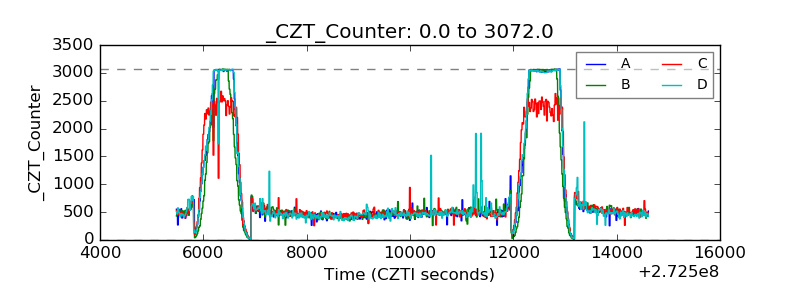 |
| +2.5 Volts monitor |  |
| +5 Volts monitor |  |
| _ROLL_ROT | 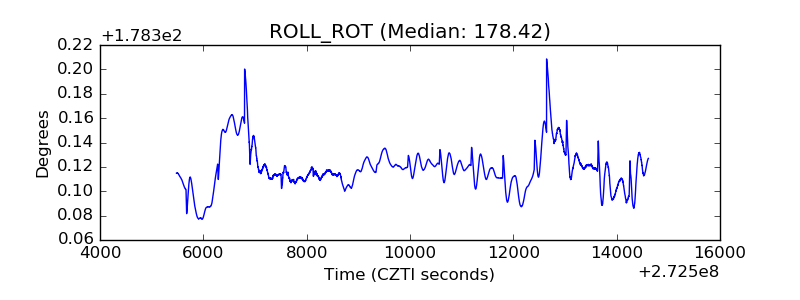 |
| _Roll_DEC | 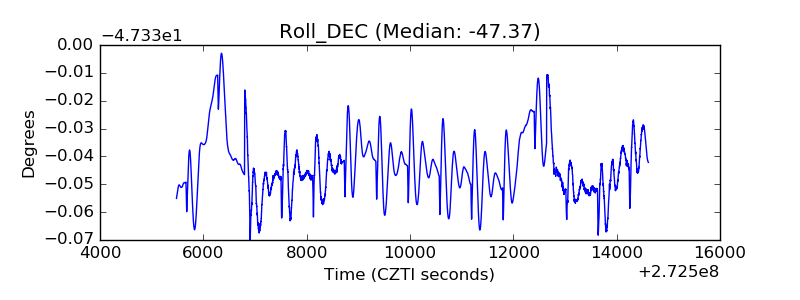 |
| _Roll_RA | 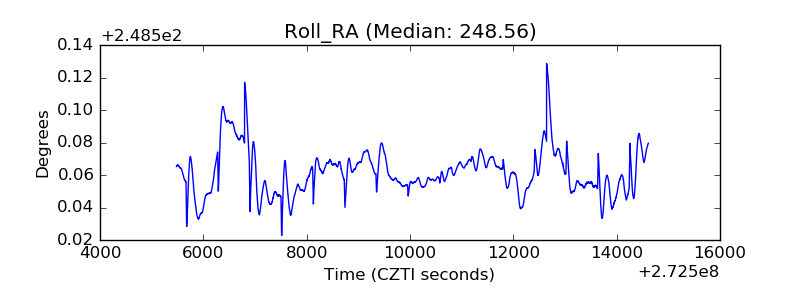 |
| Veto Counter | 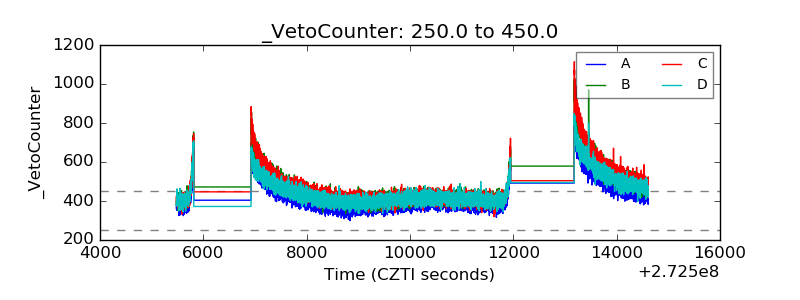 |