| Param | Original file | Final file |
|---|---|---|
| Filename | modeM0/AS1T02_084T01_9000002318_15660cztM0_level2.evt | modeM0/AS1T02_084T01_9000002318_15660cztM0_level2_quad_clean.evt |
| Size (bytes) | 450,610,560 | 70,009,920 |
| Size | 429.7 MB | 66.8 MB |
| Events in quadrant A | 3,172,357 | 422,838 |
| Events in quadrant B | 3,402,888 | 428,150 |
| Events in quadrant C | 3,312,326 | 421,975 |
| Events in quadrant D | 3,331,751 | 407,587 |
| Mode M0 | |||
|---|---|---|---|
| Quadrant | BADHDUFLAG | Total packets | Discarded packets |
| A | 0 | 13150 | 3 |
| B | 0 | 13871 | 2 |
| C | 0 | 13550 | 2 |
| D | 0 | 13814 | 2 |
| Mode M9 | |||
|---|---|---|---|
| Quadrant | BADHDUFLAG | Total packets | Discarded packets |
| A | 0 | 18 | 0 |
| B | 0 | 18 | 0 |
| C | 0 | 18 | 0 |
| D | 0 | 19 | 0 |
| Mode SS | |||
|---|---|---|---|
| Quadrant | BADHDUFLAG | Total packets | Discarded packets |
| A | 0 | 128 | 0 |
| B | 0 | 128 | 0 |
| C | 0 | 128 | 0 |
| D | 0 | 128 | 0 |
| Quadrant | Total seconds | Saturated seconds | Saturation percentage |
|---|---|---|---|
| A | 6291 | 44 | 0.699412% |
| B | 6291 | 60 | 0.953743% |
| C | 6291 | 83 | 1.319345% |
| D | 6291 | 65 | 1.033222% |
Noise dominated data is calculated using 1-second bins in cleaned event files. If a bin has >2000 counts, and if more than 50% of those come from <1% of pixels, then it is considered to be noise-dominated and hence unusable.
| Quadrant | # 1 sec bins | Bins with >0 counts | Bins with >2000 counts | High rate bins dominated by noise | Noise dominated (total time) | Noise dominated (detector-on time) | Marked lightcurve |
|---|---|---|---|---|---|---|---|
| A | 7591 | 6291 | 0 | 0 | 0.00% | 0.00% | 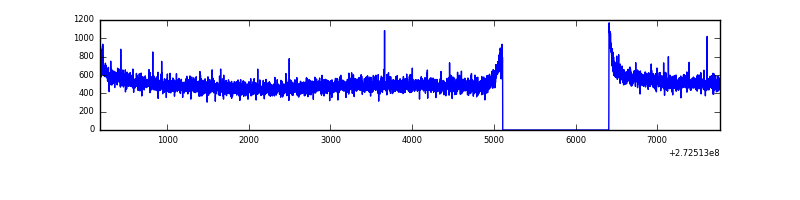 |
| B | 7591 | 6291 | 13 | 13 | 0.17% | 0.21% | 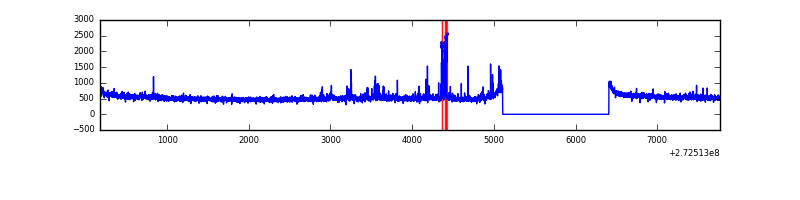 |
| C | 7591 | 6291 | 0 | 0 | 0.00% | 0.00% | 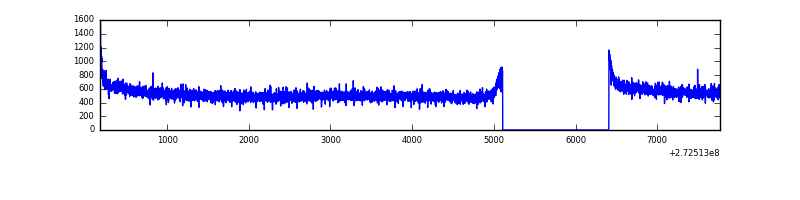 |
| D | 7591 | 6291 | 33 | 33 | 0.43% | 0.52% | 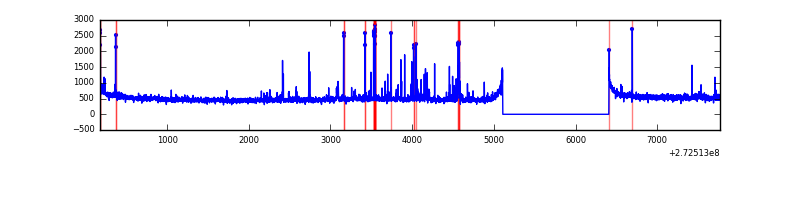 |
Top three noisy pixels from each quadrant. If the there are fewer than three noisy pixels in the level2.evt file, extra rows are filled as -1
| Pixel properties | Quadrant properties | ||||||
|---|---|---|---|---|---|---|---|
| Quadrant | DetID | PixID | Counts | Sigma | Mean | Median | Sigma |
| A | 0 | 226 | 7292 | 39.45 | 824 | 809 | 164.3 |
| A | 12 | 194 | 6027 | 31.75 | 824 | 809 | 164.3 |
| A | 3 | 137 | 5206 | 26.76 | 824 | 809 | 164.3 |
| B | 3 | 64 | 109375 | 712.5 | 828 | 810 | 152.4 |
| B | 0 | 189 | 30560 | 195.25 | 828 | 810 | 152.4 |
| B | 12 | 111 | 16960 | 105.99 | 828 | 810 | 152.4 |
| C | 14 | 238 | 125879 | 676.62 | 806 | 813 | 184.8 |
| C | 3 | 233 | 27919 | 146.64 | 806 | 813 | 184.8 |
| C | 5 | 96 | 7619 | 36.82 | 806 | 813 | 184.8 |
| D | 1 | 52 | 186388 | 956.04 | 807 | 786 | 194.1 |
| D | 10 | 70 | 37239 | 187.77 | 807 | 786 | 194.1 |
| D | 2 | 234 | 23847 | 118.79 | 807 | 786 | 194.1 |
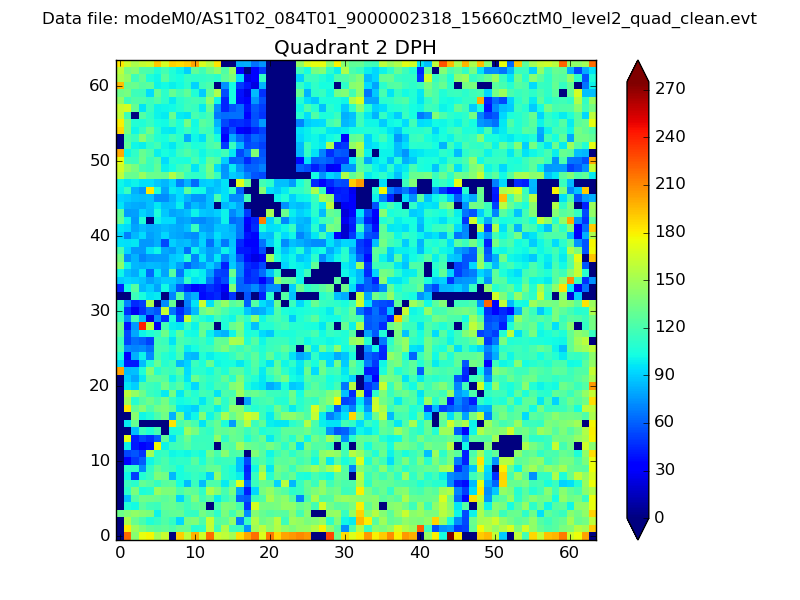
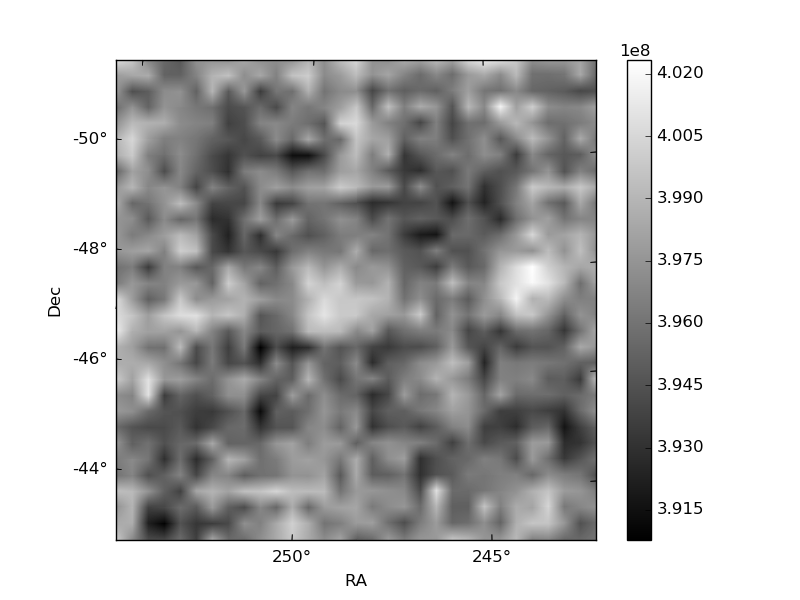
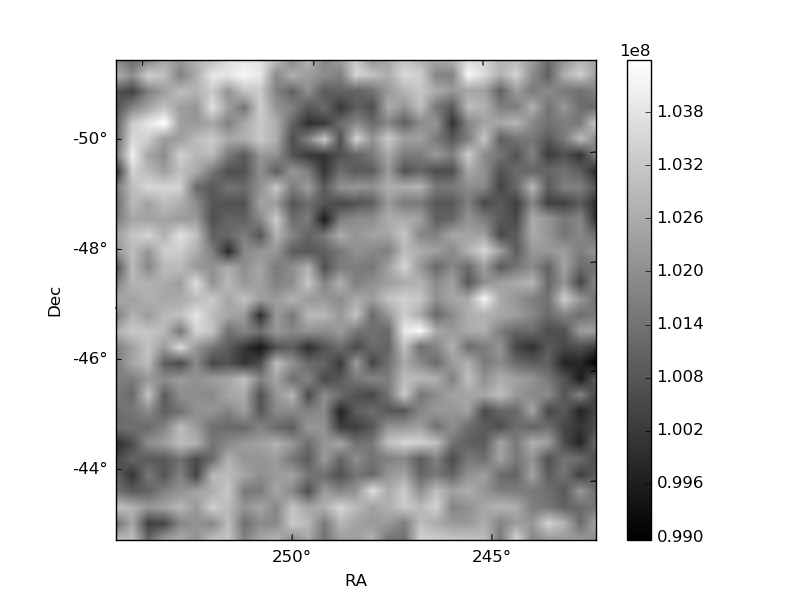
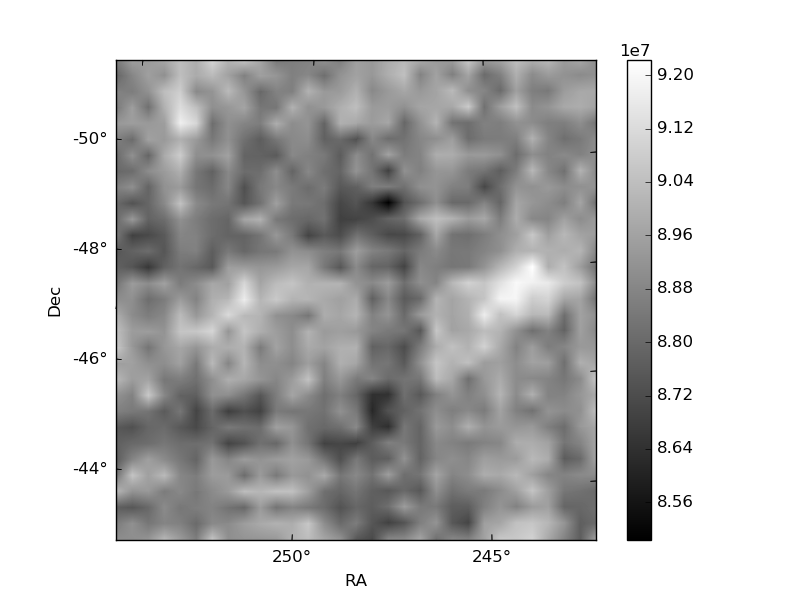
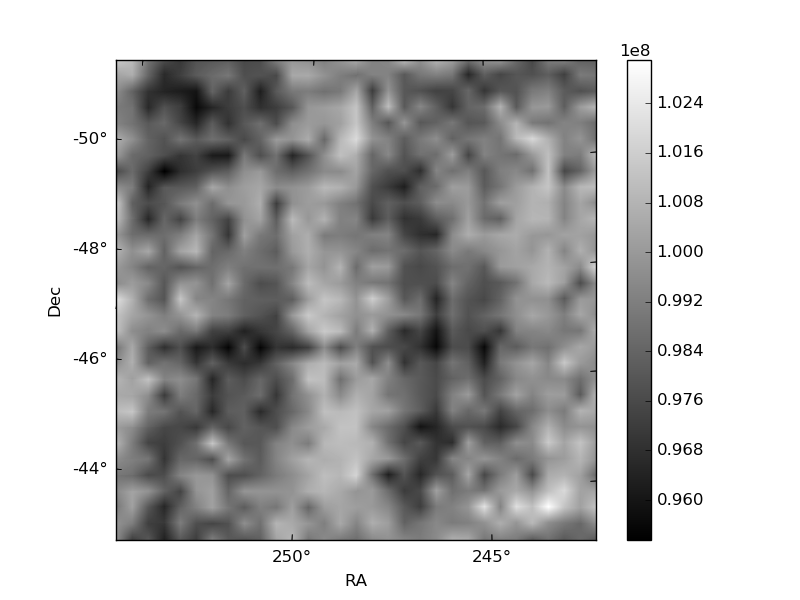
Histogram calculated using DETX and DETY for each event in the final _common_clean file
| Quadrant A | 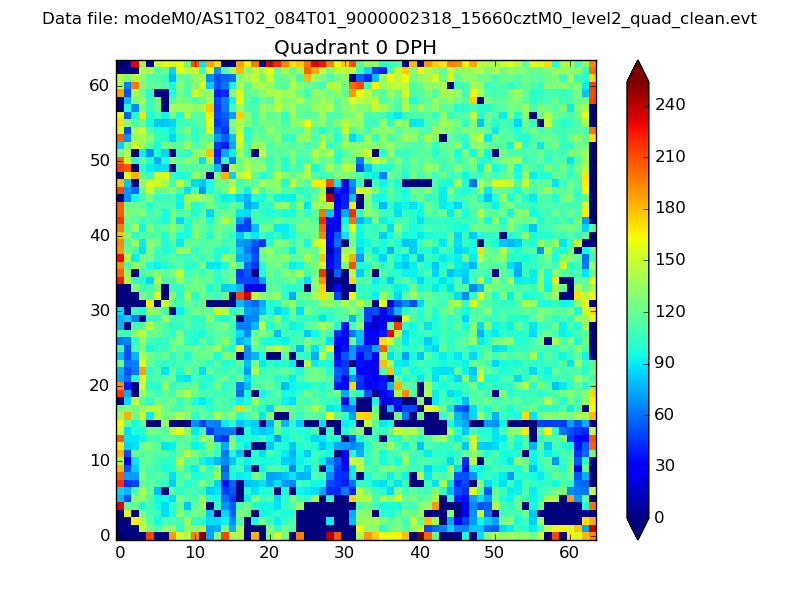 |
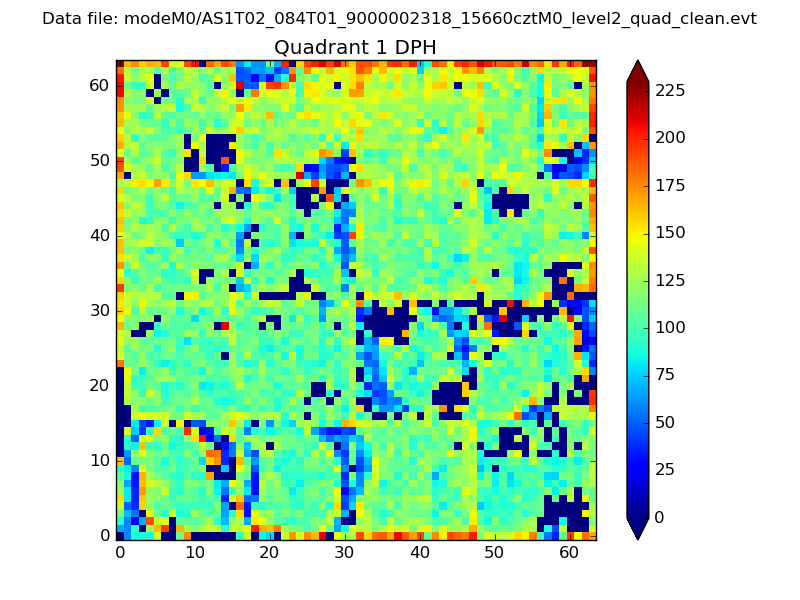 |
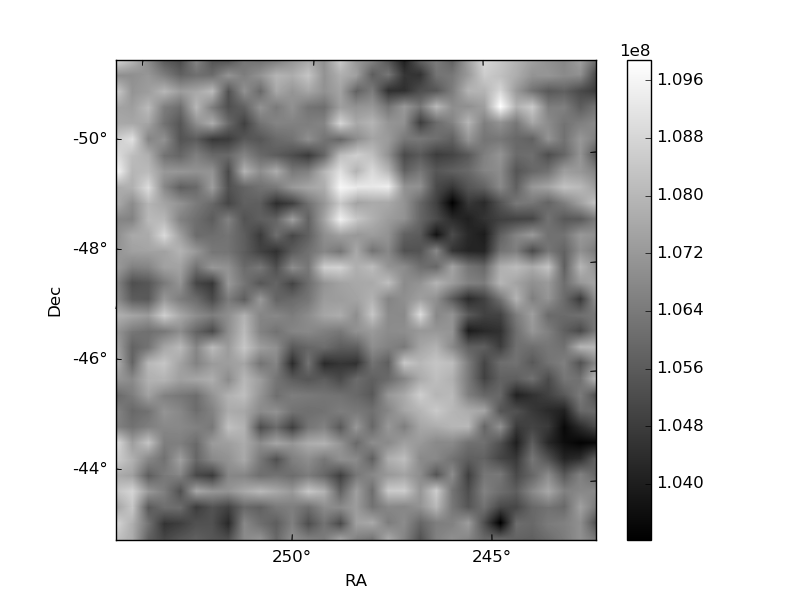
Quadrant B |
|---|---|---|---|
| Quadrant D | 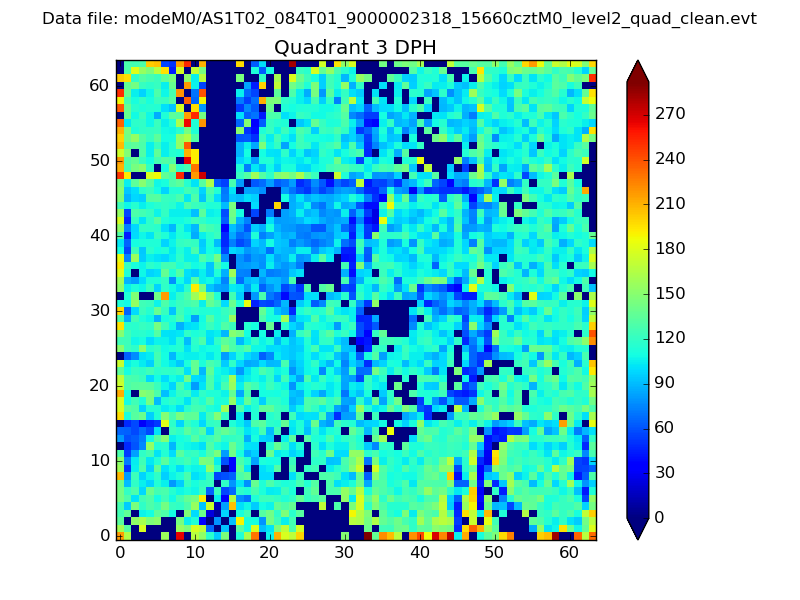 |
 |
Quadrant C |
| Plot type | Count rate plots | Images |
|---|---|---|
| Comparison with Poisson distribution Blue bars denote a histogram of data divided into 1 sec bins. Red curve is a Poisson curve with rate = median count rate of data. |
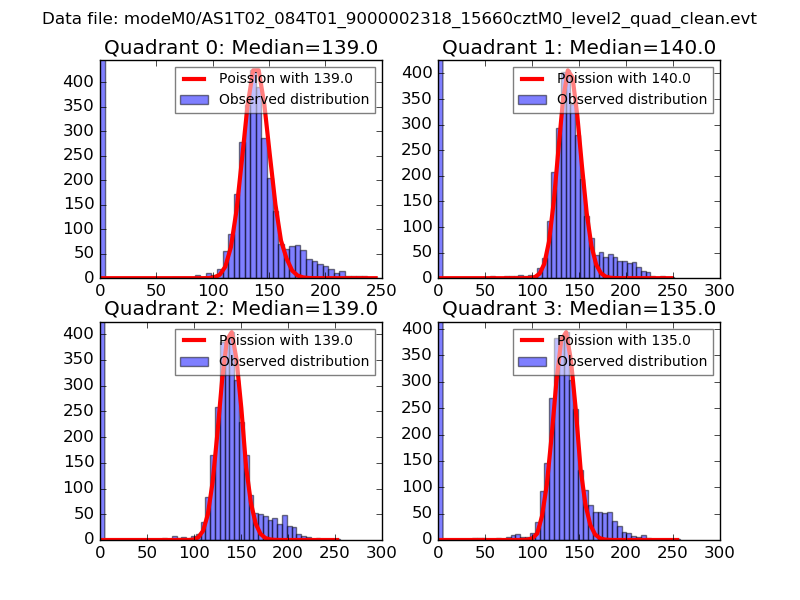 |
 |
| Quadrant-wise count rates Data is divided into 100 sec bins |
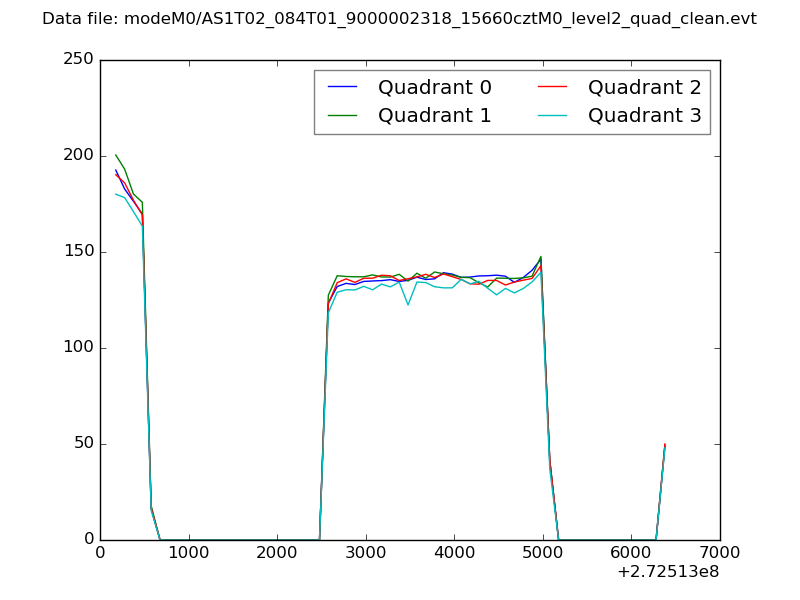 |
|
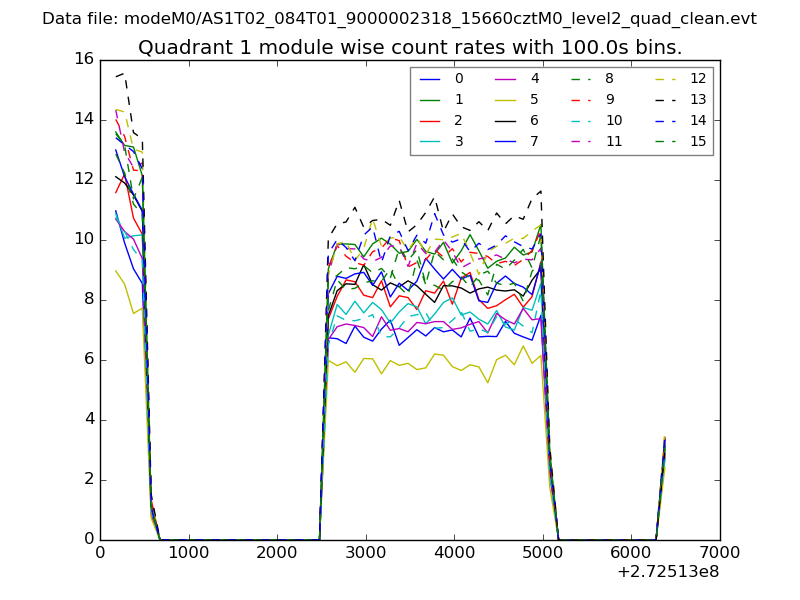
| Module-wise count rates for Quadrant A Data is divided into 100 sec bins |
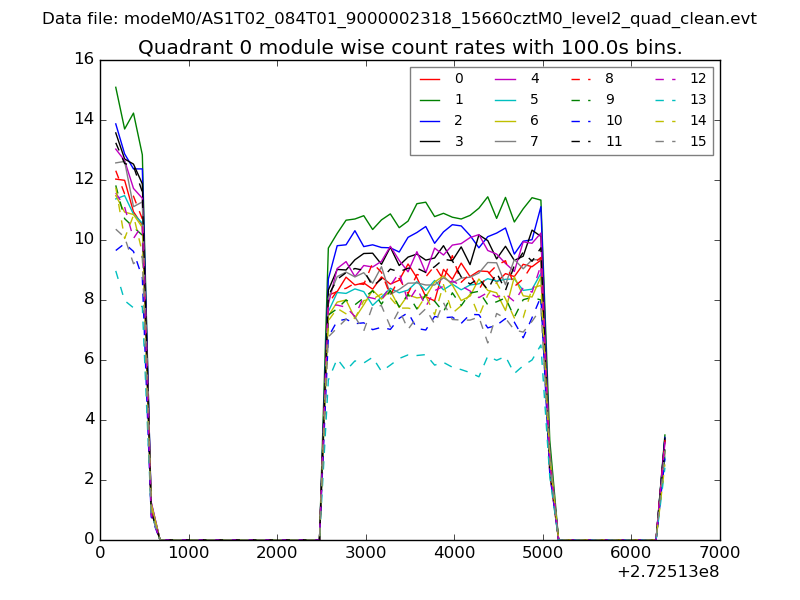 |
 |
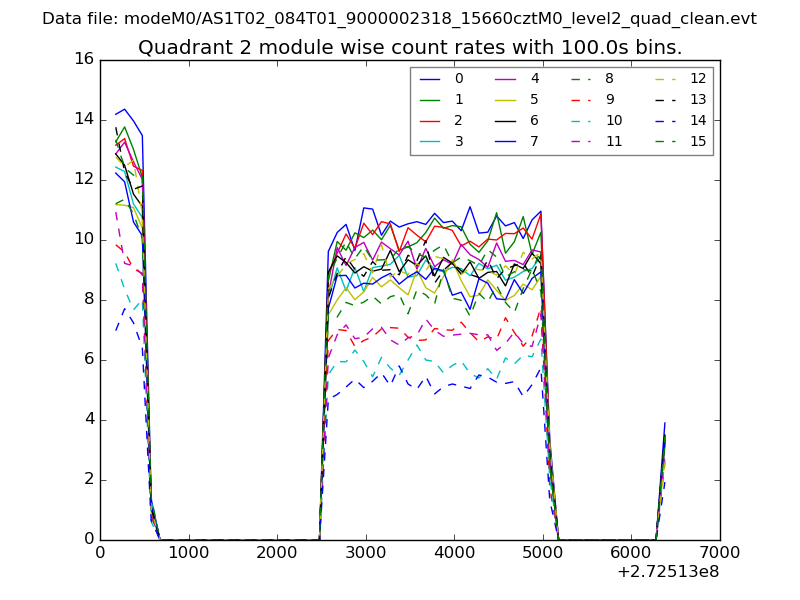
| Module-wise count rates for Quadrant B Data is divided into 100 sec bins |
 |
 |
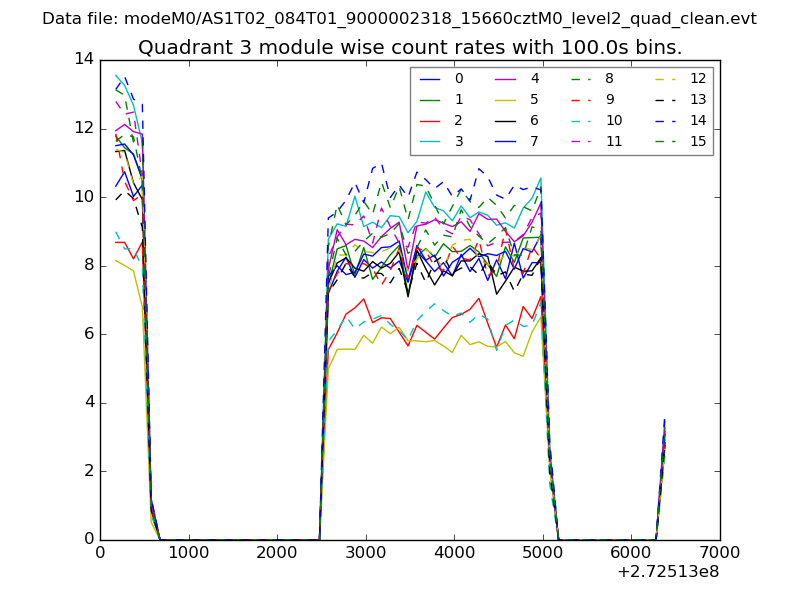
| Module-wise count rates for Quadrant C Data is divided into 100 sec bins |
 |
 |
| Module-wise count rates for Quadrant D Data is divided into 100 sec bins |
 |
 |
| Parameter | Plot |
|---|---|
| CZT HV Monitor | 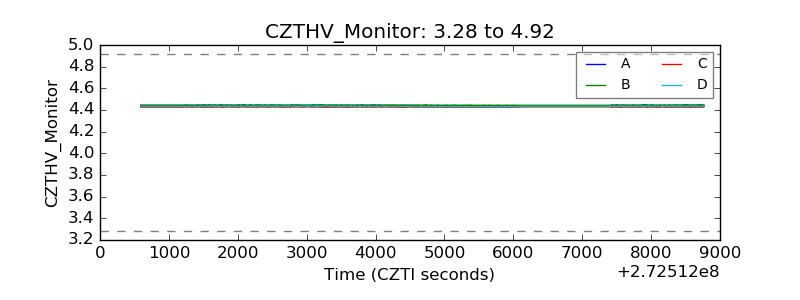 |
| D_VDD | 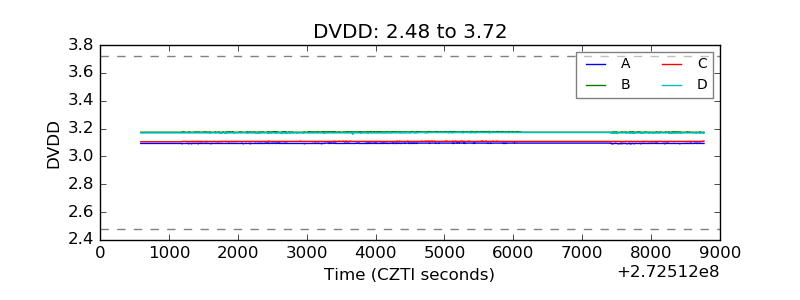 |
| Temperature 1 | 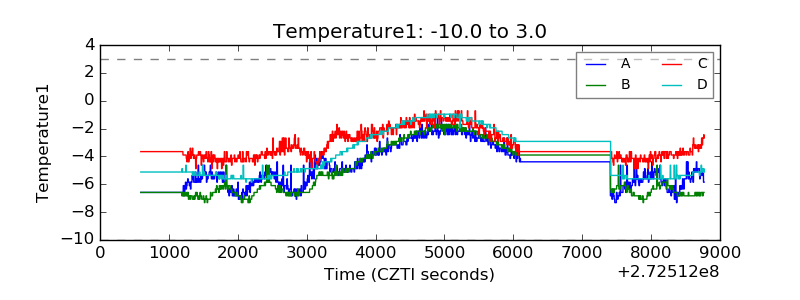 |
| Veto HV Monitor | 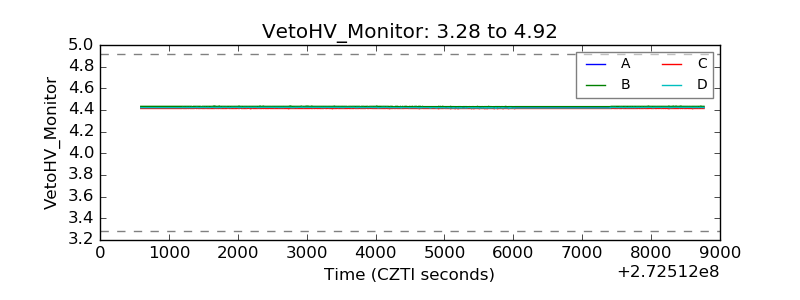 |
| Veto LLD | 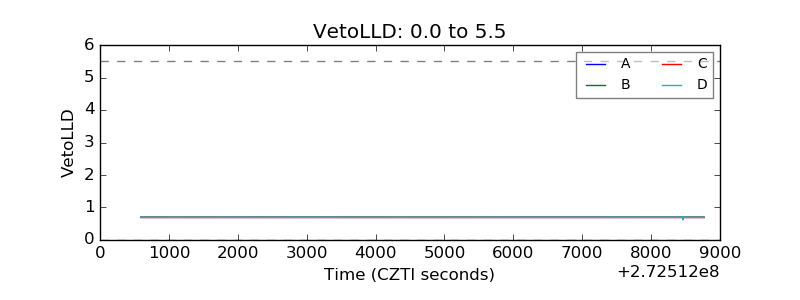 |
| Alpha Counter | 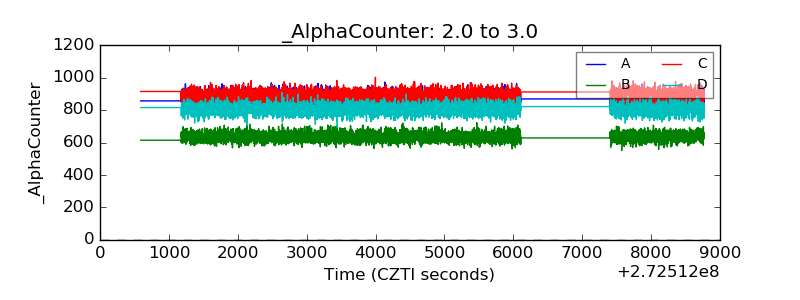 |
| _CPM_Rate | 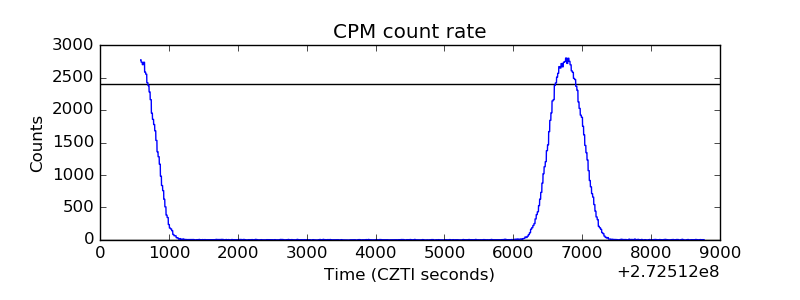 |
| CZT Counter | 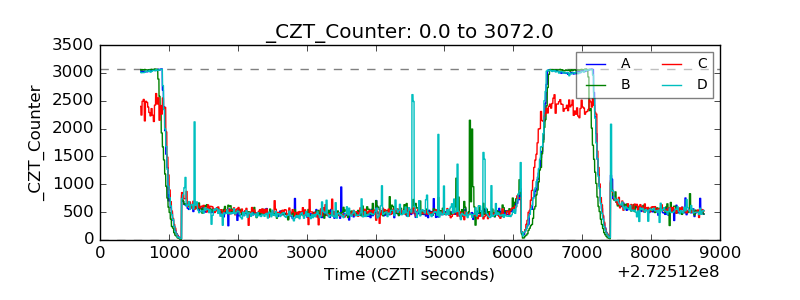 |
| +2.5 Volts monitor |  |
| +5 Volts monitor |  |
| _ROLL_ROT | 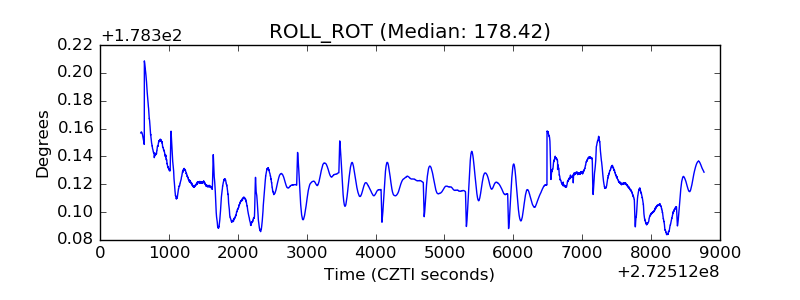 |
| _Roll_DEC | 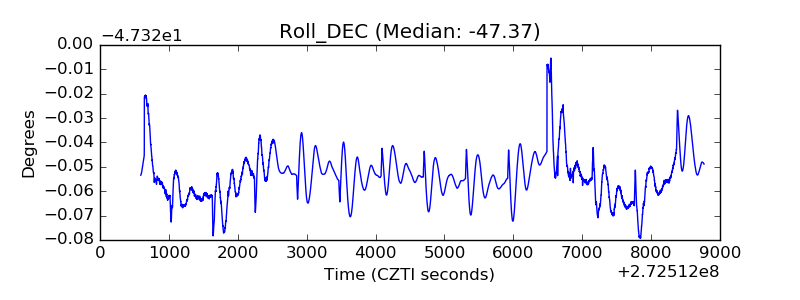 |
| _Roll_RA | 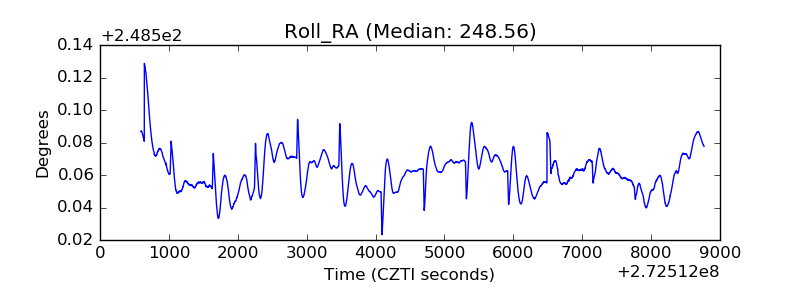 |
| Veto Counter | 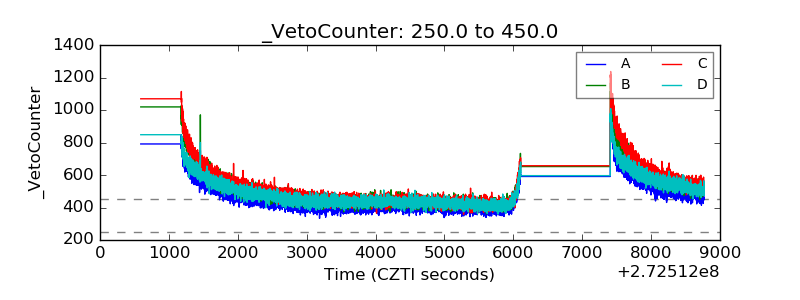 |