| Param | Original file | Final file |
|---|---|---|
| Filename | modeM0/AS1T02_084T01_9000002318_15661cztM0_level2.evt | modeM0/AS1T02_084T01_9000002318_15661cztM0_level2_quad_clean.evt |
| Size (bytes) | 456,871,680 | 68,031,360 |
| Size | 435.7 MB | 64.9 MB |
| Events in quadrant A | 3,318,336 | 405,479 |
| Events in quadrant B | 3,303,040 | 414,603 |
| Events in quadrant C | 3,350,210 | 407,963 |
| Events in quadrant D | 3,441,791 | 396,922 |
| Mode M0 | |||
|---|---|---|---|
| Quadrant | BADHDUFLAG | Total packets | Discarded packets |
| A | 0 | 13442 | 3 |
| B | 0 | 13416 | 2 |
| C | 0 | 13622 | 2 |
| D | 0 | 13919 | 2 |
| Mode M9 | |||
|---|---|---|---|
| Quadrant | BADHDUFLAG | Total packets | Discarded packets |
| A | 0 | 24 | 0 |
| B | 0 | 24 | 0 |
| C | 0 | 24 | 0 |
| D | 0 | 25 | 0 |
| Mode SS | |||
|---|---|---|---|
| Quadrant | BADHDUFLAG | Total packets | Discarded packets |
| A | 0 | 128 | 0 |
| B | 0 | 128 | 0 |
| C | 0 | 128 | 0 |
| D | 0 | 128 | 0 |
| Quadrant | Total seconds | Saturated seconds | Saturation percentage |
|---|---|---|---|
| A | 6223 | 66 | 1.060582% |
| B | 6223 | 56 | 0.899888% |
| C | 6223 | 98 | 1.574803% |
| D | 6223 | 87 | 1.398040% |
Noise dominated data is calculated using 1-second bins in cleaned event files. If a bin has >2000 counts, and if more than 50% of those come from <1% of pixels, then it is considered to be noise-dominated and hence unusable.
| Quadrant | # 1 sec bins | Bins with >0 counts | Bins with >2000 counts | High rate bins dominated by noise | Noise dominated (total time) | Noise dominated (detector-on time) | Marked lightcurve |
|---|---|---|---|---|---|---|---|
| A | 7603 | 6224 | 14 | 14 | 0.18% | 0.22% | 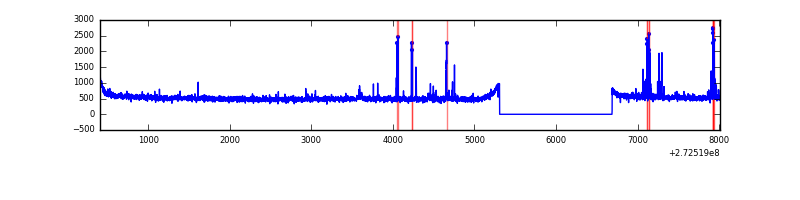 |
| B | 7603 | 6224 | 1 | 1 | 0.01% | 0.02% | 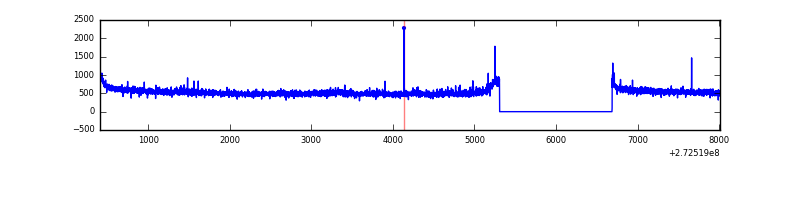 |
| C | 7603 | 6224 | 0 | 0 | 0.00% | 0.00% | 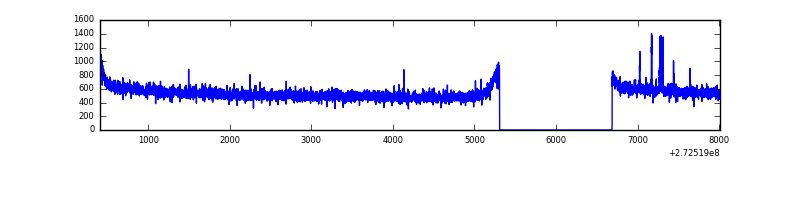 |
| D | 7603 | 6224 | 39 | 39 | 0.51% | 0.63% | 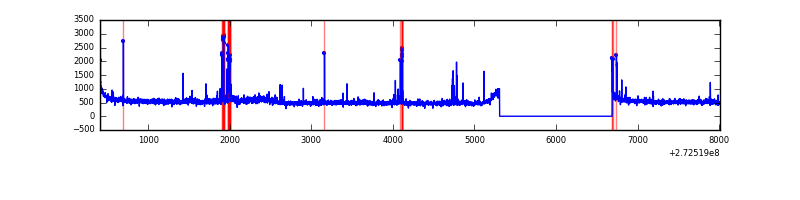 |
Top three noisy pixels from each quadrant. If the there are fewer than three noisy pixels in the level2.evt file, extra rows are filled as -1
| Pixel properties | Quadrant properties | ||||||
|---|---|---|---|---|---|---|---|
| Quadrant | DetID | PixID | Counts | Sigma | Mean | Median | Sigma |
| A | 4 | 2 | 82190 | 499.3 | 831 | 817 | 163.0 |
| A | 13 | 248 | 21604 | 127.55 | 831 | 817 | 163.0 |
| A | 0 | 226 | 7602 | 41.63 | 831 | 817 | 163.0 |
| B | 0 | 189 | 20291 | 127.78 | 833 | 815 | 152.4 |
| B | 12 | 111 | 17281 | 108.03 | 833 | 815 | 152.4 |
| B | 11 | 111 | 14936 | 92.65 | 833 | 815 | 152.4 |
| C | 14 | 238 | 130011 | 696.78 | 814 | 821 | 185.4 |
| C | 3 | 233 | 40038 | 211.51 | 814 | 821 | 185.4 |
| C | 13 | 61 | 5950 | 27.66 | 814 | 821 | 185.4 |
| D | 1 | 52 | 196563 | 1000.5 | 817 | 795 | 195.7 |
| D | 13 | 104 | 52591 | 264.71 | 817 | 795 | 195.7 |
| D | 2 | 120 | 41118 | 206.08 | 817 | 795 | 195.7 |
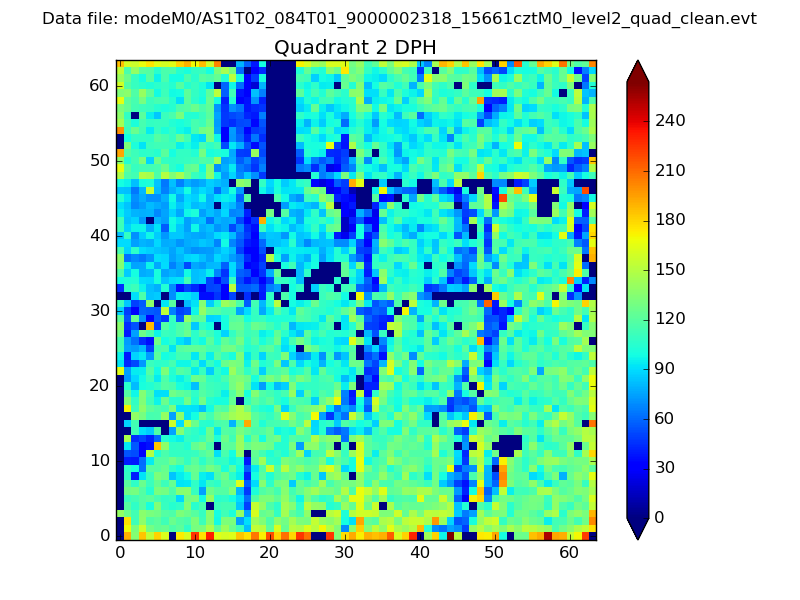
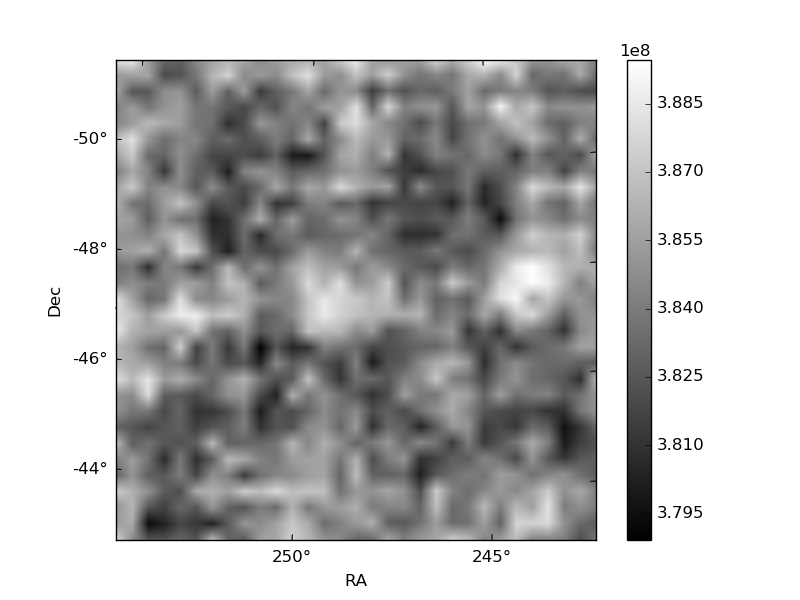
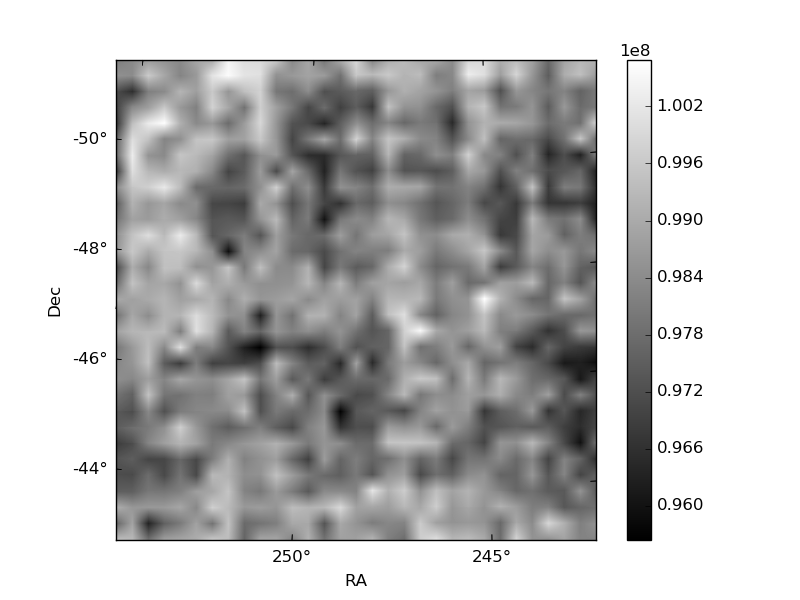
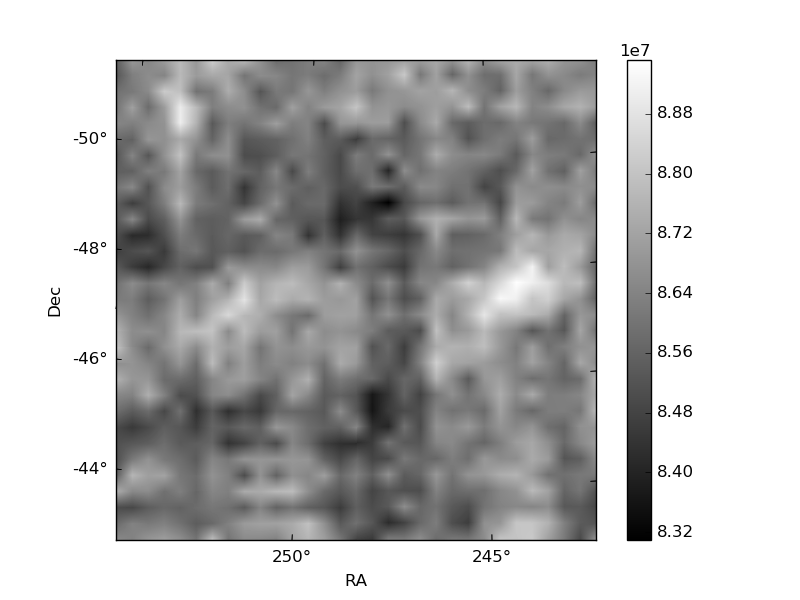
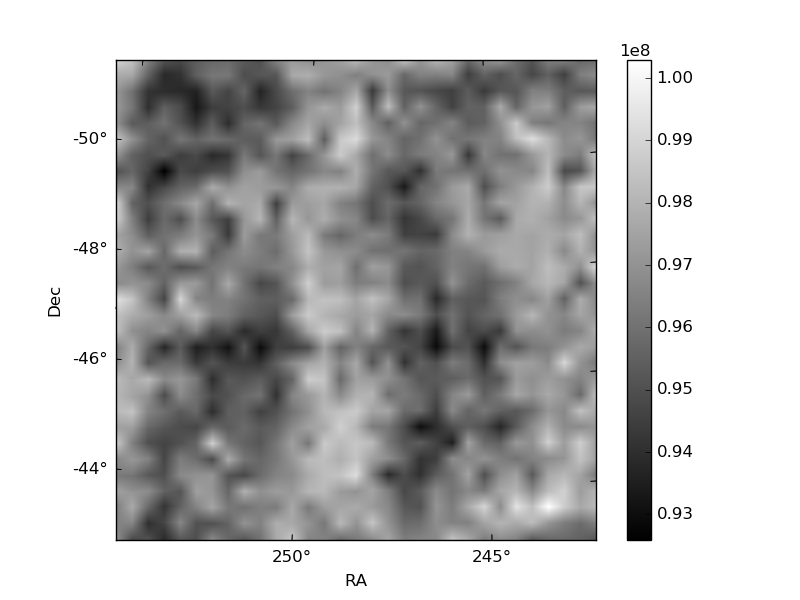
Histogram calculated using DETX and DETY for each event in the final _common_clean file
| Quadrant A | 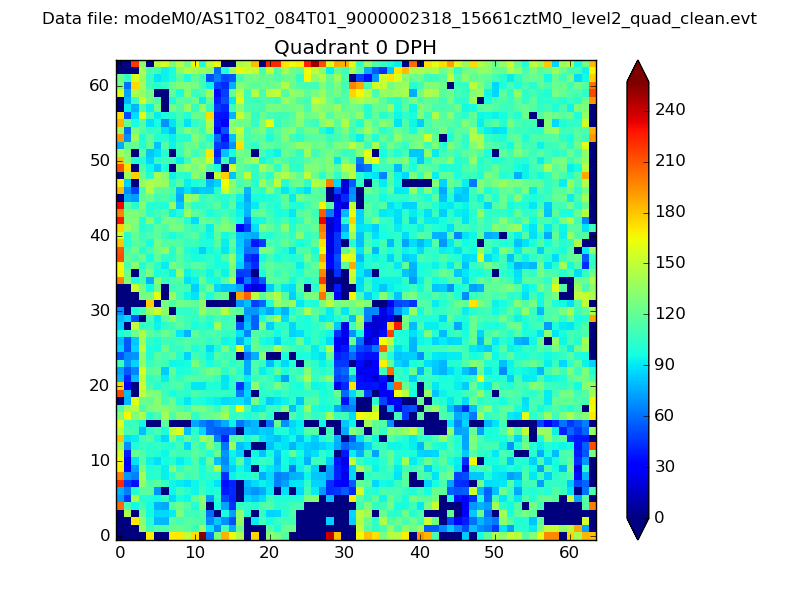 |
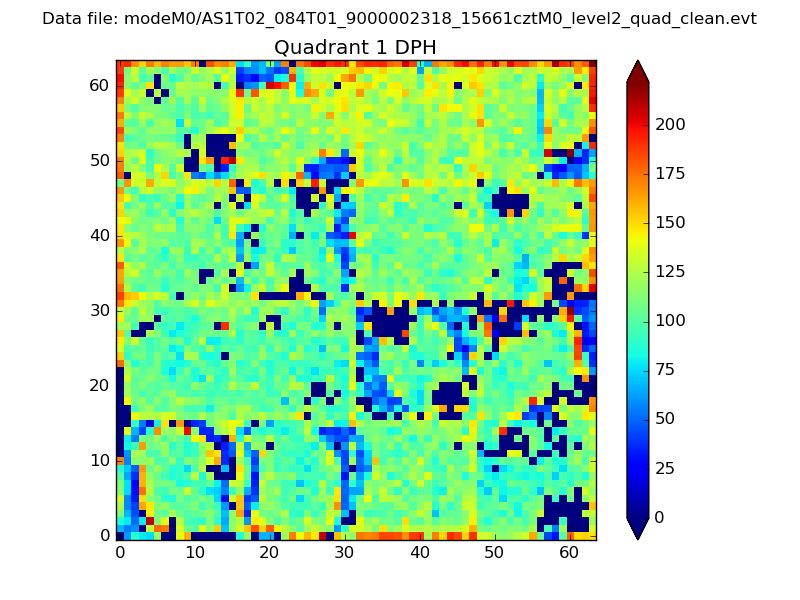 |
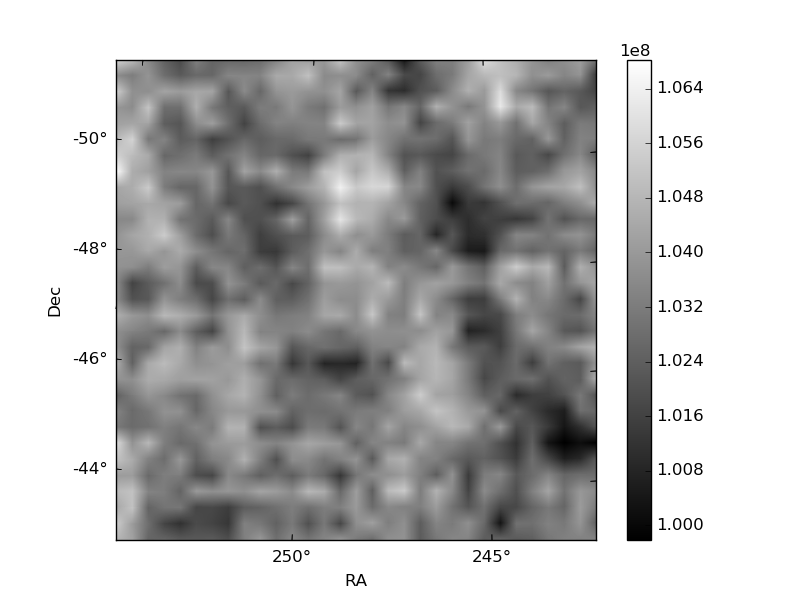
Quadrant B |
|---|---|---|---|
| Quadrant D | 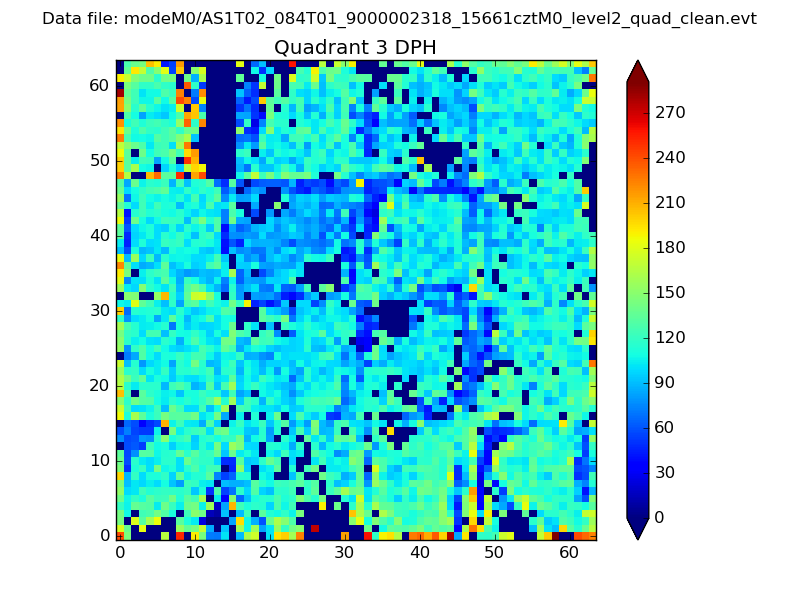 |
 |
Quadrant C |
| Plot type | Count rate plots | Images |
|---|---|---|
| Comparison with Poisson distribution Blue bars denote a histogram of data divided into 1 sec bins. Red curve is a Poisson curve with rate = median count rate of data. |
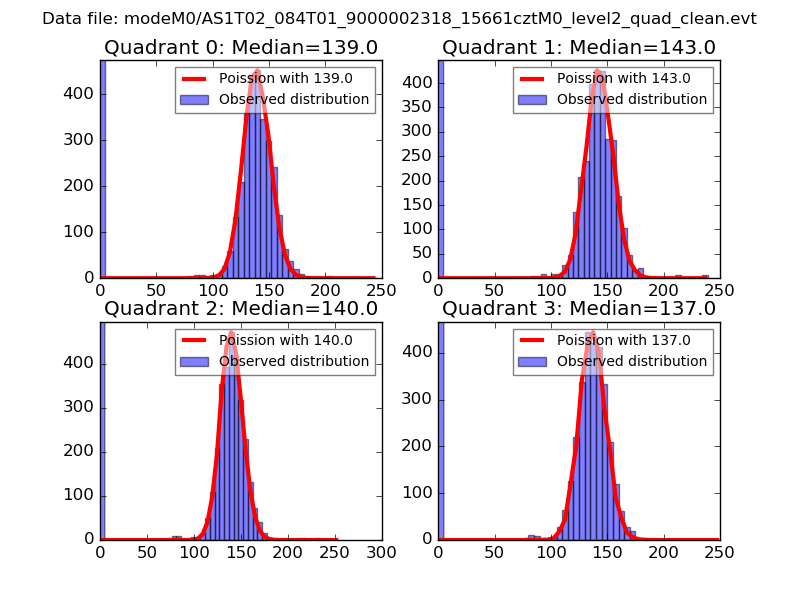 |
 |
| Quadrant-wise count rates Data is divided into 100 sec bins |
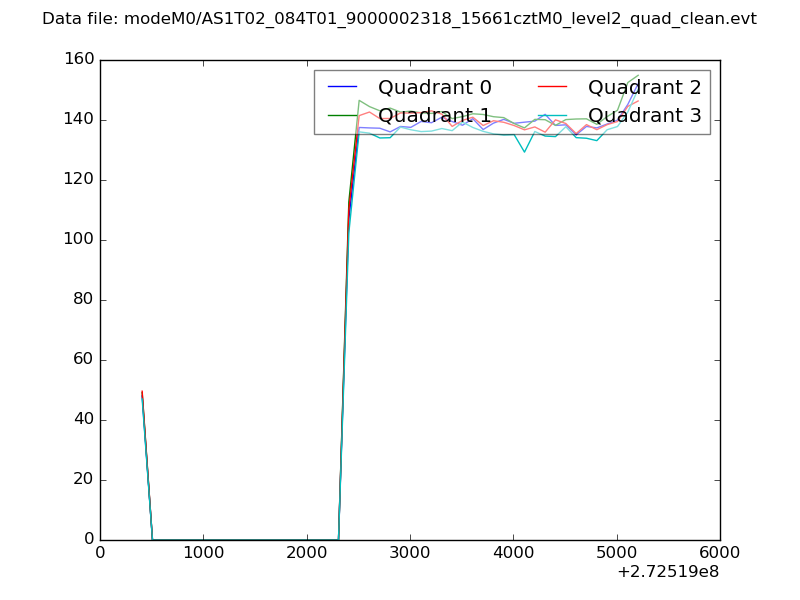 |
|
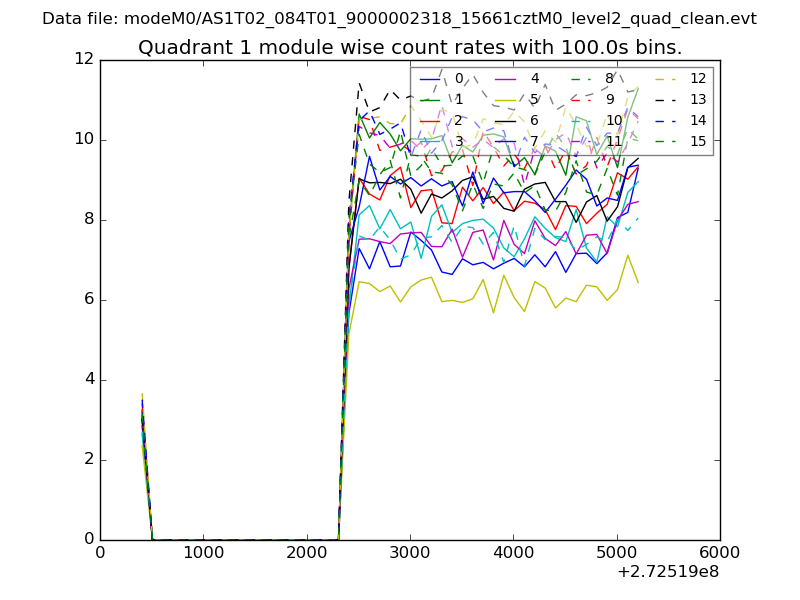
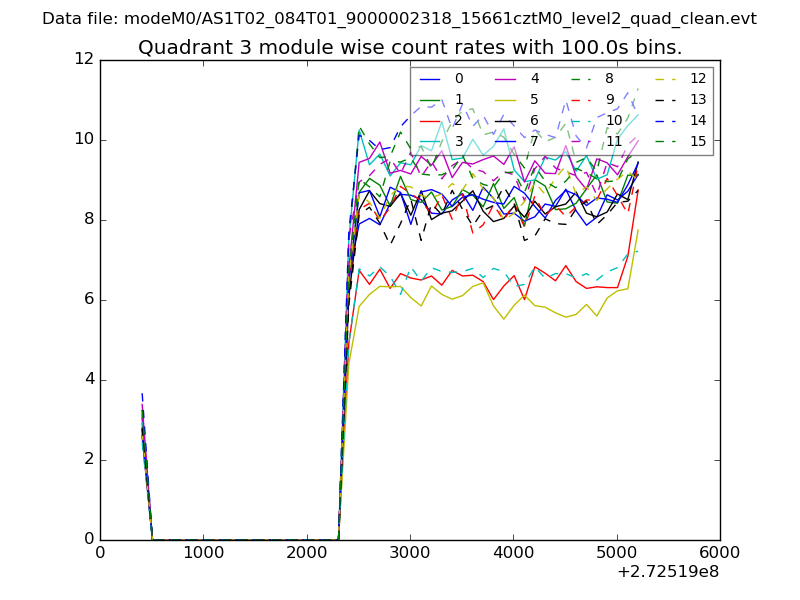
| Module-wise count rates for Quadrant A Data is divided into 100 sec bins |
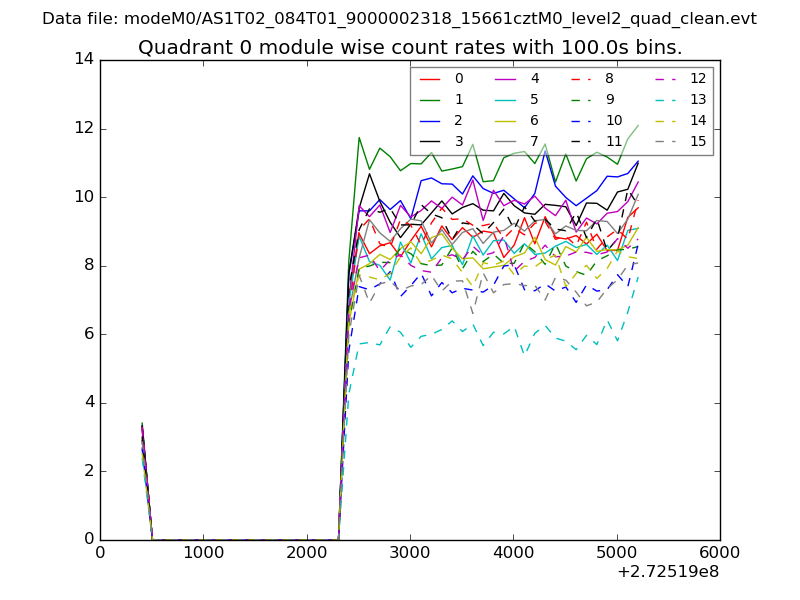 |
 |
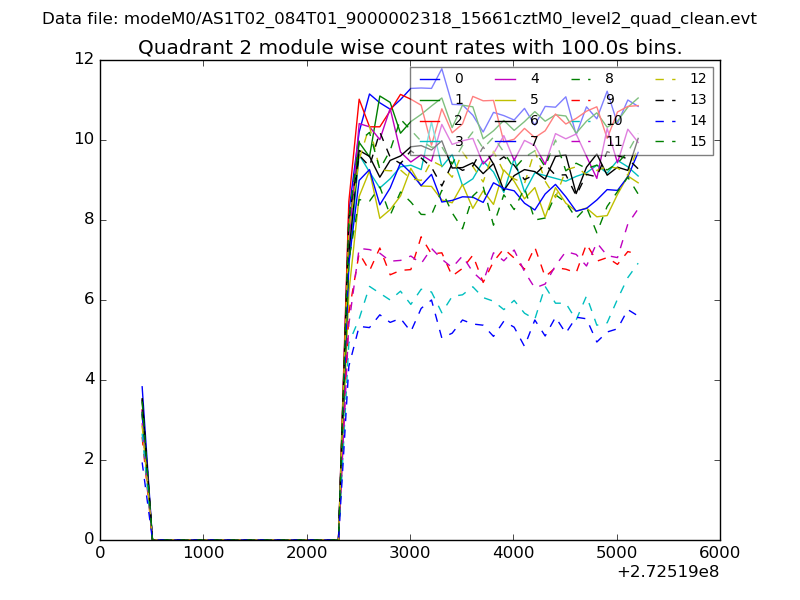
| Module-wise count rates for Quadrant B Data is divided into 100 sec bins |
 |
 |
| Module-wise count rates for Quadrant C Data is divided into 100 sec bins |
 |
 |
| Module-wise count rates for Quadrant D Data is divided into 100 sec bins |
 |
 |
| Parameter | Plot |
|---|---|
| CZT HV Monitor | 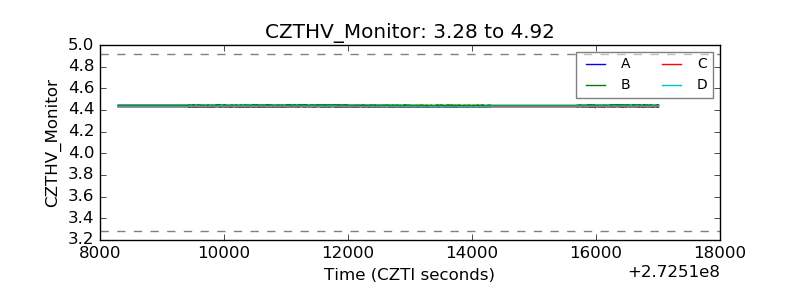 |
| D_VDD | 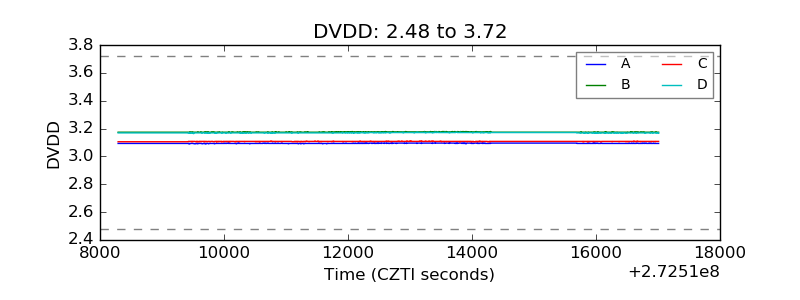 |
| Temperature 1 | 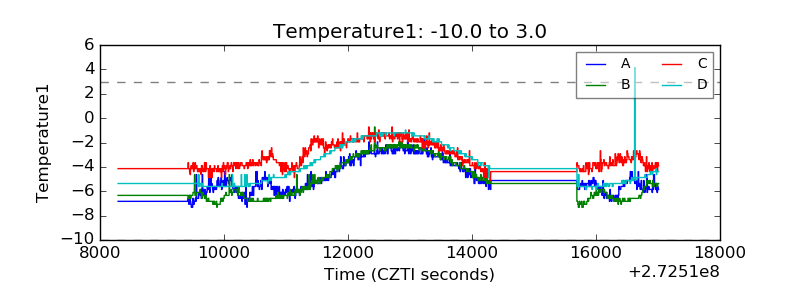 |
| Veto HV Monitor | 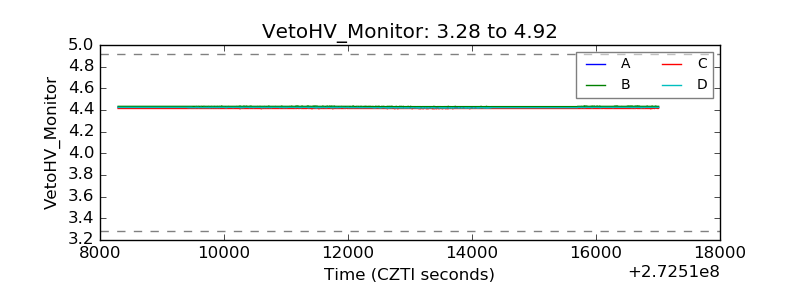 |
| Veto LLD | 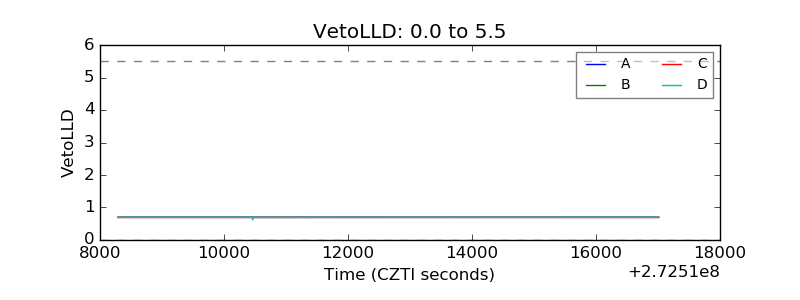 |
| Alpha Counter | 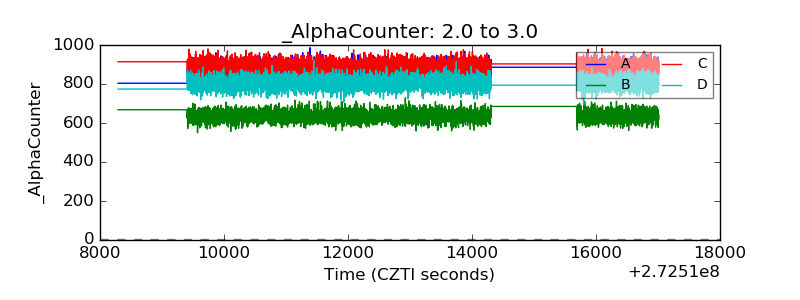 |
| _CPM_Rate | 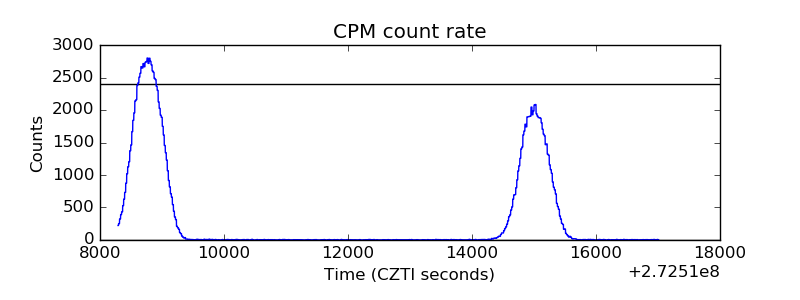 |
| CZT Counter | 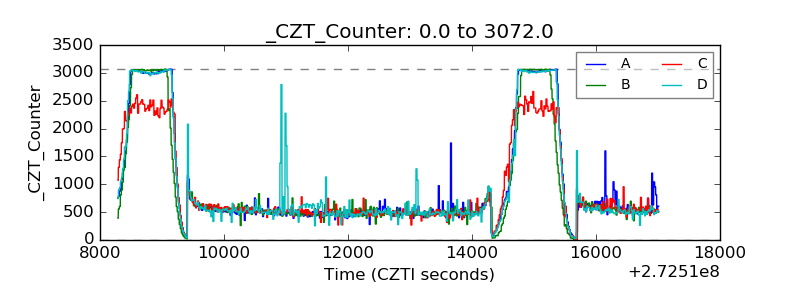 |
| +2.5 Volts monitor |  |
| +5 Volts monitor |  |
| _ROLL_ROT | 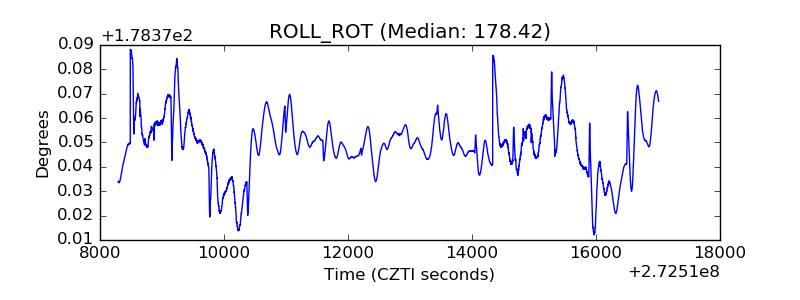 |
| _Roll_DEC |  |
| _Roll_RA | 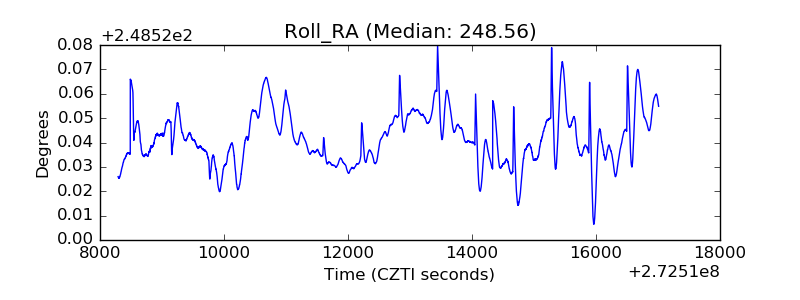 |
| Veto Counter | 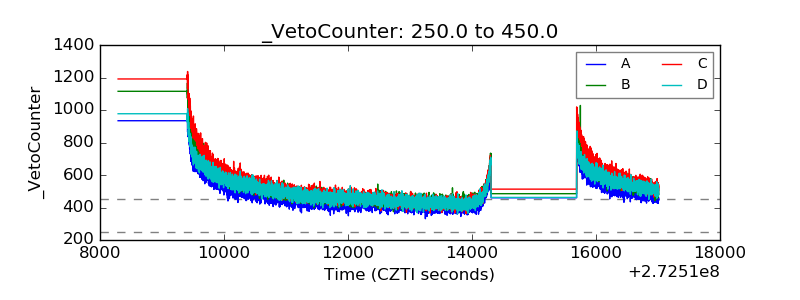 |