| Param | Original file | Final file |
|---|---|---|
| Filename | modeM0/AS1T02_084T01_9000002318_15662cztM0_level2.evt | modeM0/AS1T02_084T01_9000002318_15662cztM0_level2_quad_clean.evt |
| Size (bytes) | 459,319,680 | 77,261,760 |
| Size | 438.0 MB | 73.7 MB |
| Events in quadrant A | 3,492,532 | 477,410 |
| Events in quadrant B | 3,292,486 | 482,390 |
| Events in quadrant C | 3,318,872 | 474,262 |
| Events in quadrant D | 3,382,662 | 469,894 |
| Mode M0 | |||
|---|---|---|---|
| Quadrant | BADHDUFLAG | Total packets | Discarded packets |
| A | 0 | 14061 | 3 |
| B | 0 | 13367 | 2 |
| C | 0 | 13561 | 2 |
| D | 0 | 13712 | 2 |
| Mode M9 | |||
|---|---|---|---|
| Quadrant | BADHDUFLAG | Total packets | Discarded packets |
| A | 0 | 15 | 0 |
| B | 0 | 15 | 0 |
| C | 0 | 15 | 0 |
| D | 0 | 16 | 0 |
| Mode SS | |||
|---|---|---|---|
| Quadrant | BADHDUFLAG | Total packets | Discarded packets |
| A | 0 | 128 | 0 |
| B | 0 | 128 | 0 |
| C | 0 | 128 | 0 |
| D | 0 | 128 | 0 |
| Quadrant | Total seconds | Saturated seconds | Saturation percentage |
|---|---|---|---|
| A | 6235 | 162 | 2.598236% |
| B | 6235 | 139 | 2.229350% |
| C | 6235 | 186 | 2.983160% |
| D | 6235 | 150 | 2.405774% |
Noise dominated data is calculated using 1-second bins in cleaned event files. If a bin has >2000 counts, and if more than 50% of those come from <1% of pixels, then it is considered to be noise-dominated and hence unusable.
| Quadrant | # 1 sec bins | Bins with >0 counts | Bins with >2000 counts | High rate bins dominated by noise | Noise dominated (total time) | Noise dominated (detector-on time) | Marked lightcurve |
|---|---|---|---|---|---|---|---|
| A | 7491 | 6237 | 28 | 28 | 0.37% | 0.45% | 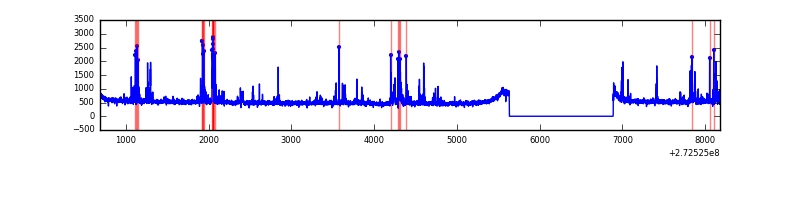 |
| B | 7491 | 6237 | 0 | 0 | 0.00% | 0.00% | 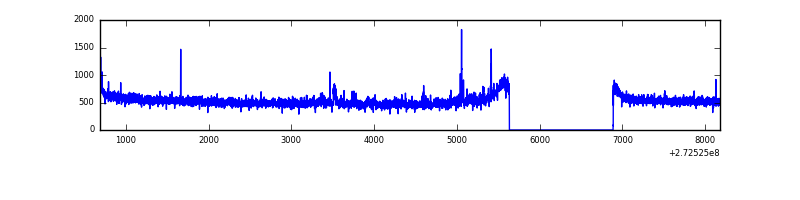 |
| C | 7491 | 6237 | 1 | 1 | 0.01% | 0.02% | 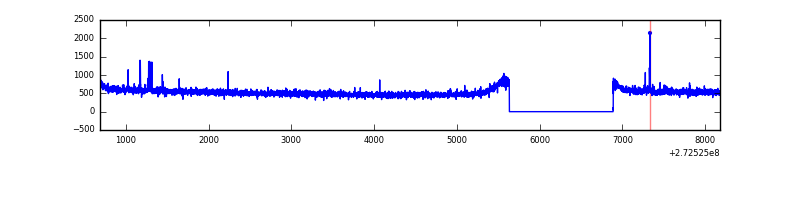 |
| D | 7491 | 6237 | 33 | 33 | 0.44% | 0.53% | 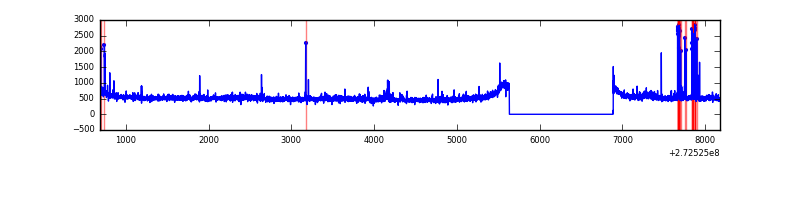 |
Top three noisy pixels from each quadrant. If the there are fewer than three noisy pixels in the level2.evt file, extra rows are filled as -1
| Pixel properties | Quadrant properties | ||||||
|---|---|---|---|---|---|---|---|
| Quadrant | DetID | PixID | Counts | Sigma | Mean | Median | Sigma |
| A | 4 | 2 | 296087 | 1795.94 | 826 | 811 | 164.4 |
| A | 7 | 32 | 9188 | 50.95 | 826 | 811 | 164.4 |
| A | 0 | 226 | 7509 | 40.74 | 826 | 811 | 164.4 |
| B | 0 | 189 | 26483 | 166.02 | 826 | 807 | 154.7 |
| B | 12 | 111 | 17413 | 107.38 | 826 | 807 | 154.7 |
| B | 11 | 111 | 15101 | 92.43 | 826 | 807 | 154.7 |
| C | 14 | 238 | 129263 | 694.83 | 804 | 810 | 184.9 |
| C | 3 | 233 | 35348 | 186.82 | 804 | 810 | 184.9 |
| C | 9 | 54 | 12727 | 64.46 | 804 | 810 | 184.9 |
| D | 1 | 52 | 248011 | 1150.27 | 807 | 794 | 214.9 |
| D | 2 | 234 | 28347 | 128.2 | 807 | 794 | 214.9 |
| D | 10 | 70 | 11584 | 50.2 | 807 | 794 | 214.9 |
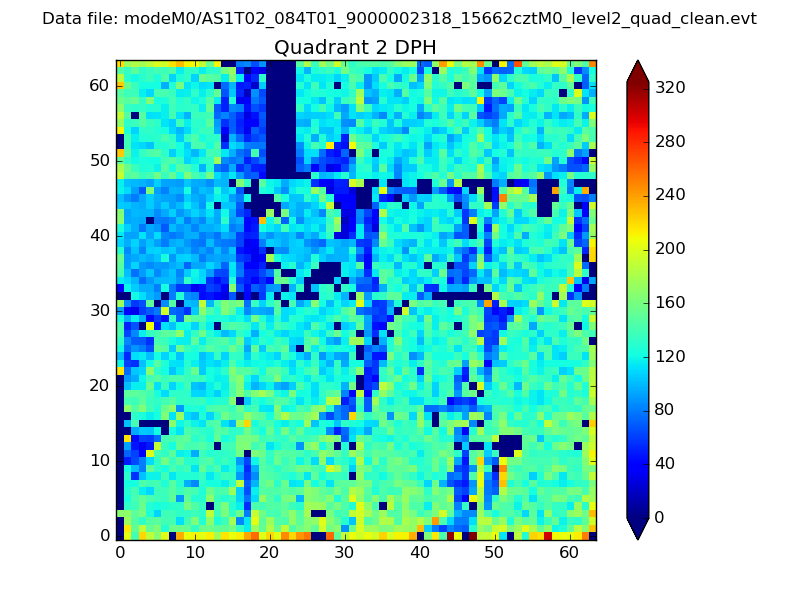
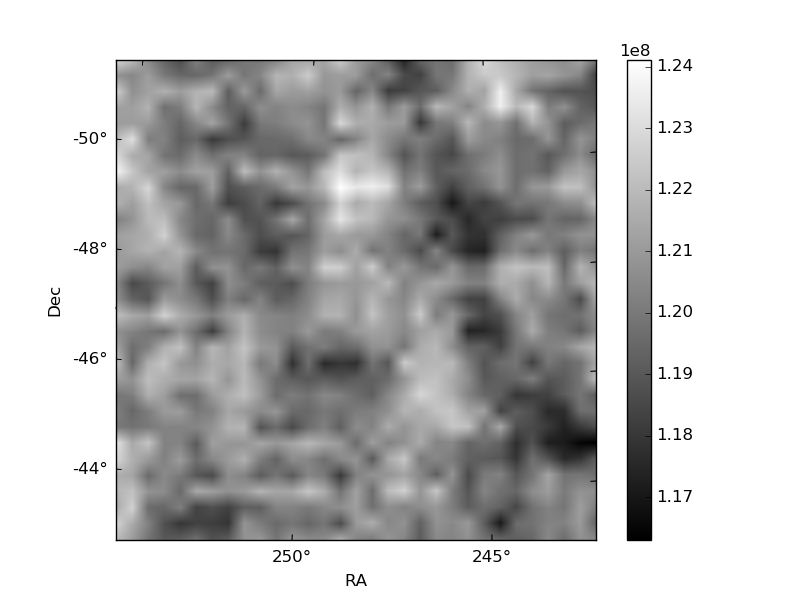
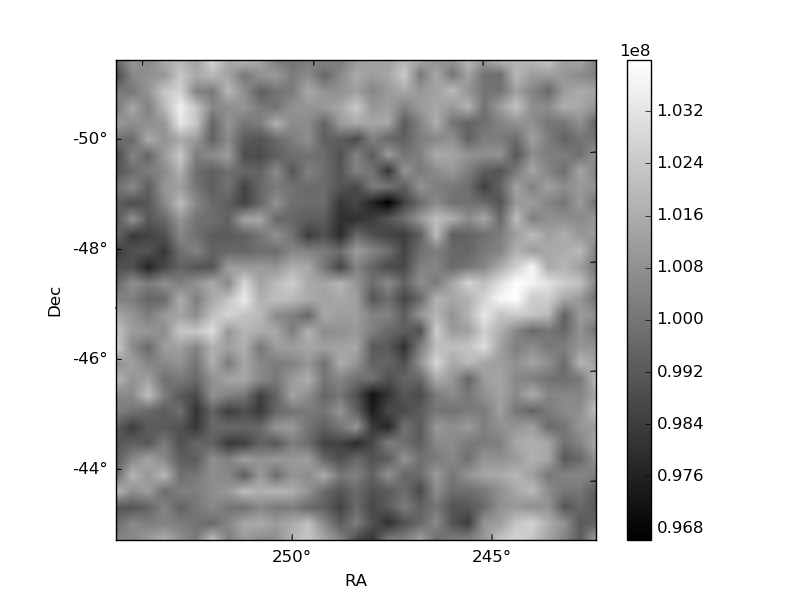
Histogram calculated using DETX and DETY for each event in the final _common_clean file
| Quadrant A | 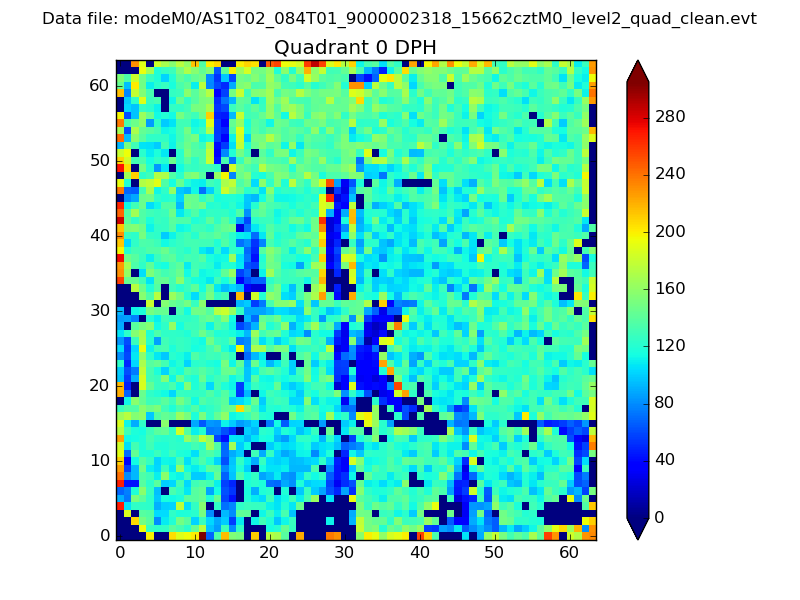 |
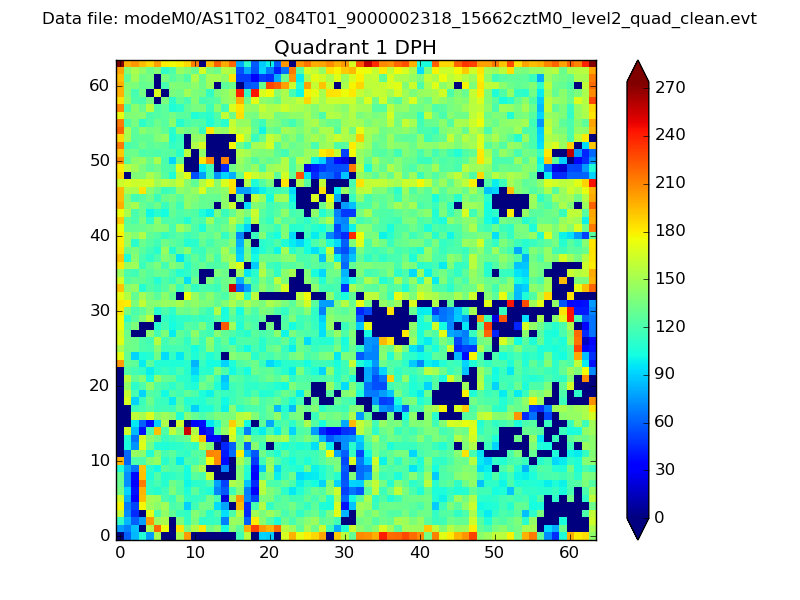 |
Quadrant B |
|---|---|---|---|
| Quadrant D |  |
 |
Quadrant C |
| Plot type | Count rate plots | Images |
|---|---|---|
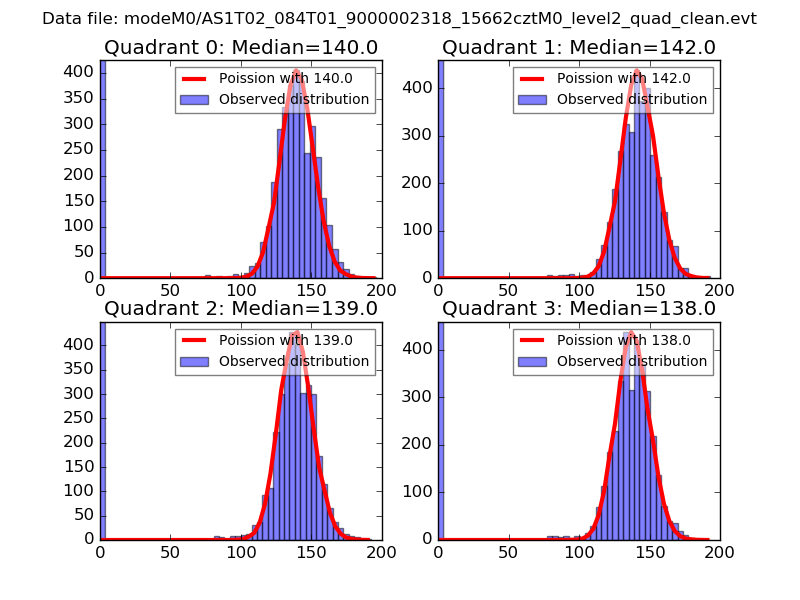
| Comparison with Poisson distribution Blue bars denote a histogram of data divided into 1 sec bins. Red curve is a Poisson curve with rate = median count rate of data. |
 |
 |
| Quadrant-wise count rates Data is divided into 100 sec bins |
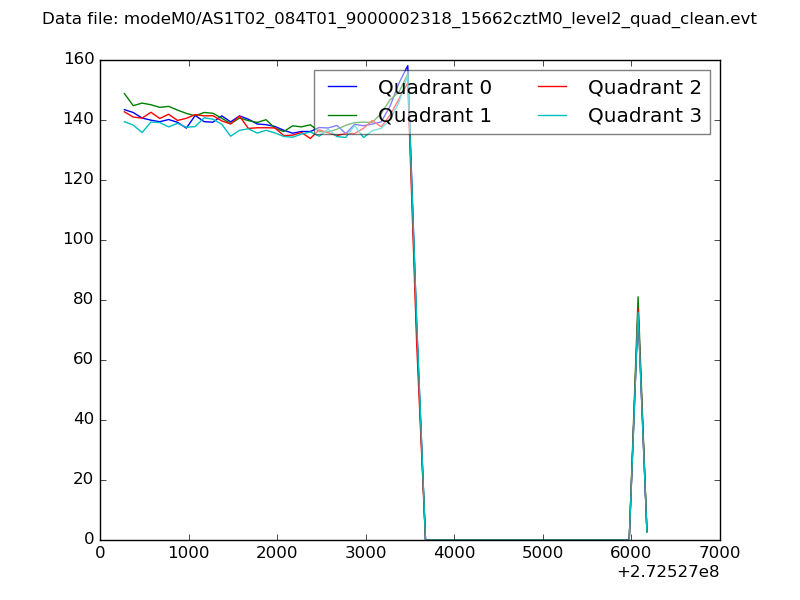 |
|
| Module-wise count rates for Quadrant A Data is divided into 100 sec bins |
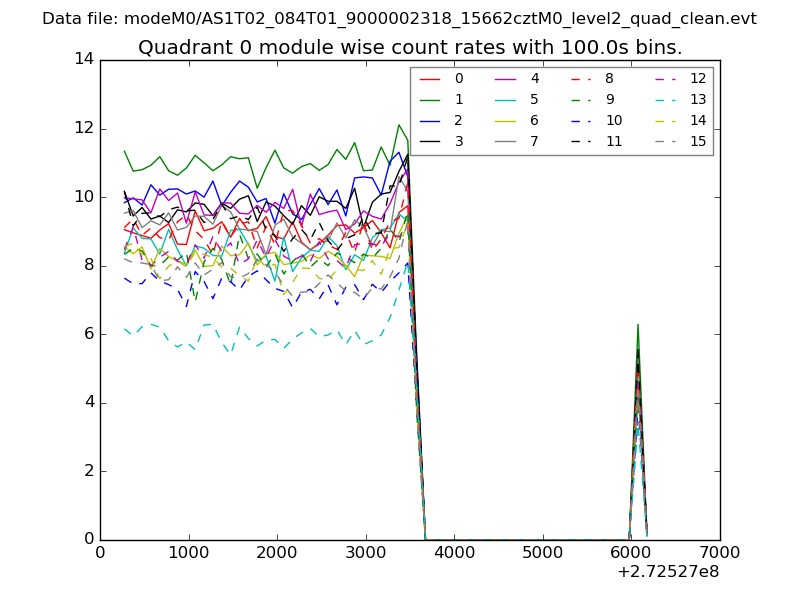 |
 |
| Module-wise count rates for Quadrant B Data is divided into 100 sec bins |
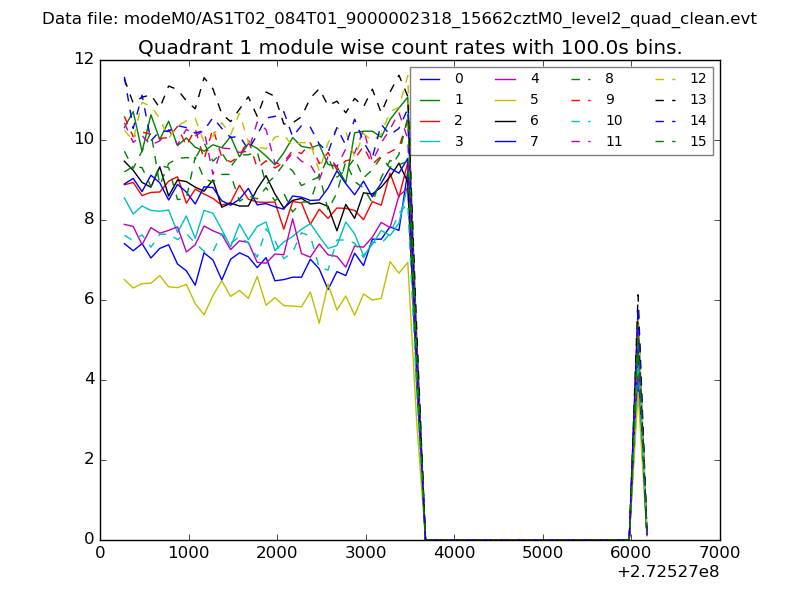 |
 |
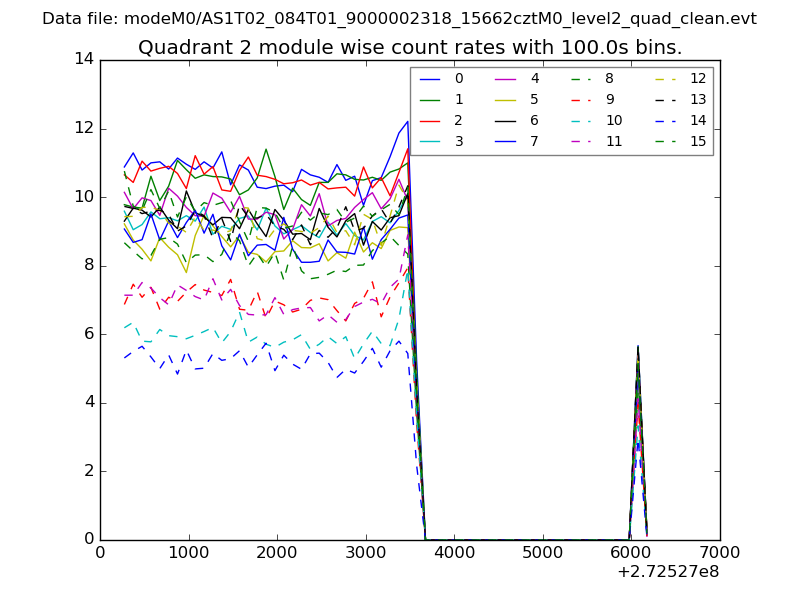
| Module-wise count rates for Quadrant C Data is divided into 100 sec bins |
 |
 |
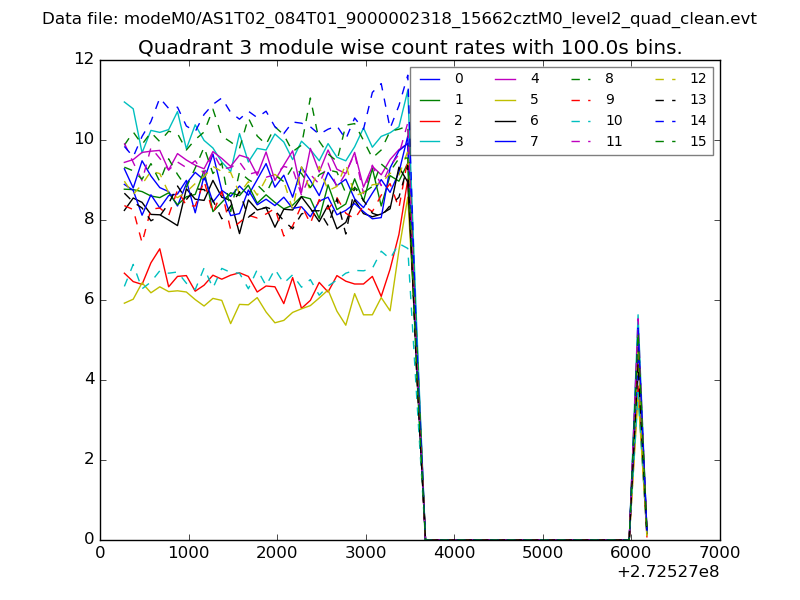
| Module-wise count rates for Quadrant D Data is divided into 100 sec bins |
 |
 |
| Parameter | Plot |
|---|---|
| CZT HV Monitor | 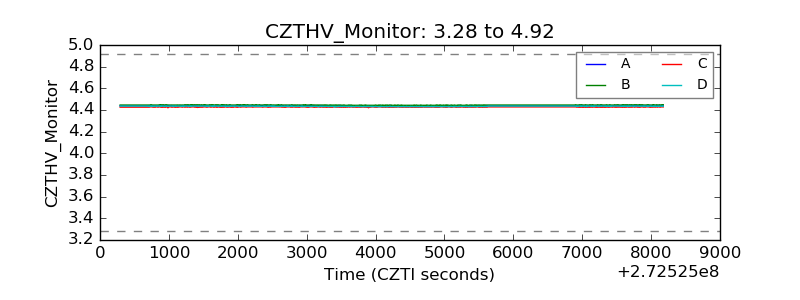 |
| D_VDD | 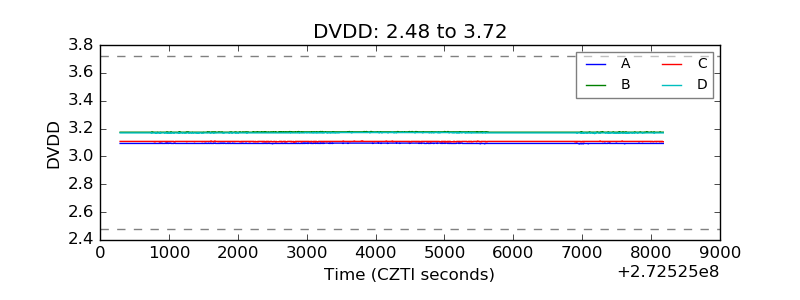 |
| Temperature 1 | 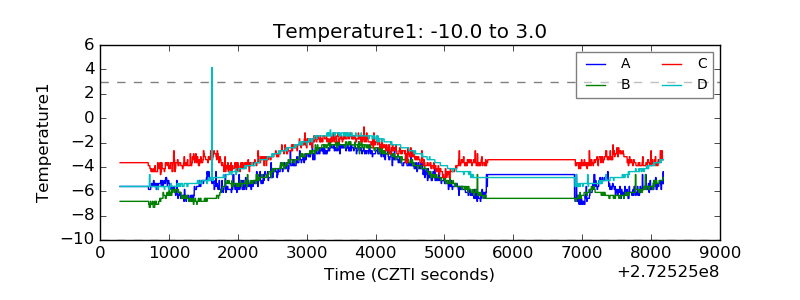 |
| Veto HV Monitor |  |
| Veto LLD | 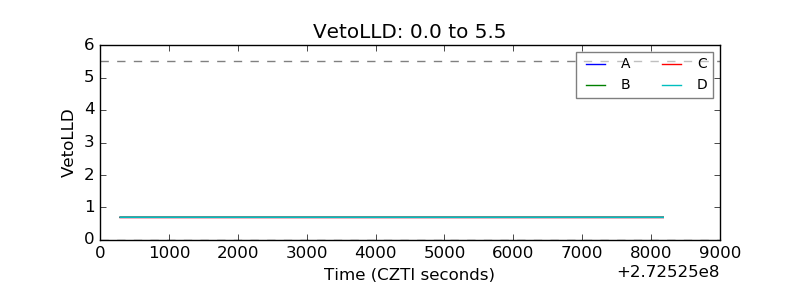 |
| Alpha Counter | 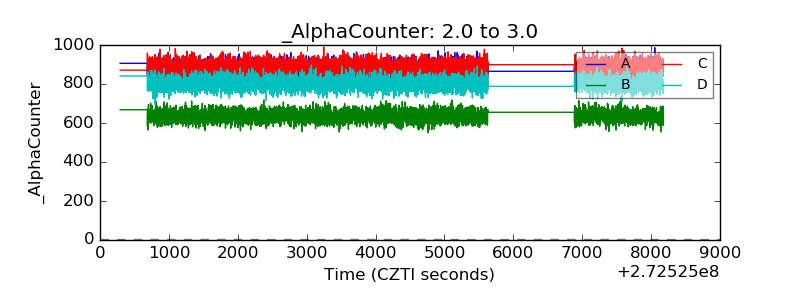 |
| _CPM_Rate | 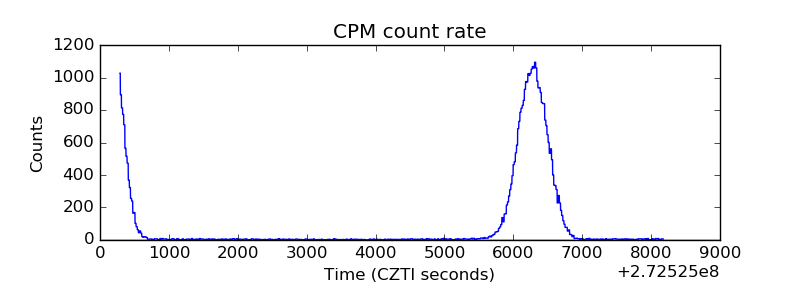 |
| CZT Counter | 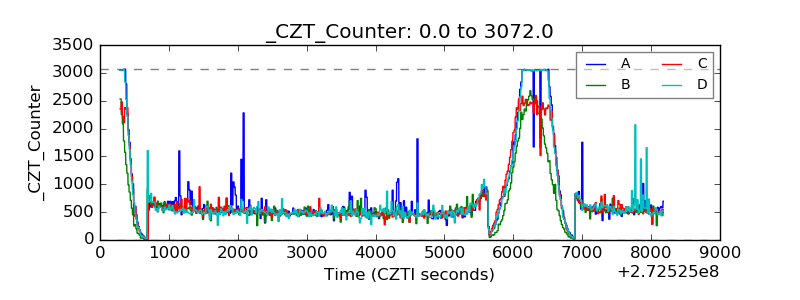 |
| +2.5 Volts monitor |  |
| +5 Volts monitor |  |
| _ROLL_ROT | 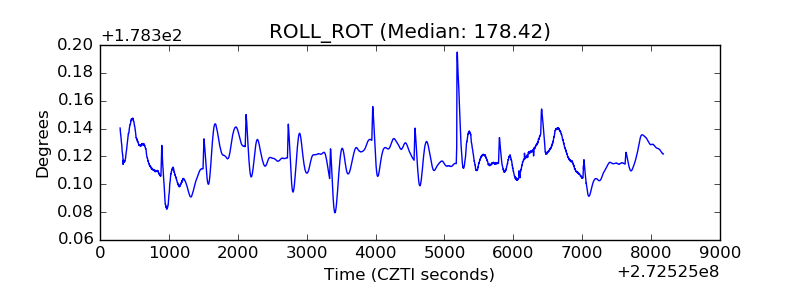 |
| _Roll_DEC |  |
| _Roll_RA |  |
| Veto Counter | 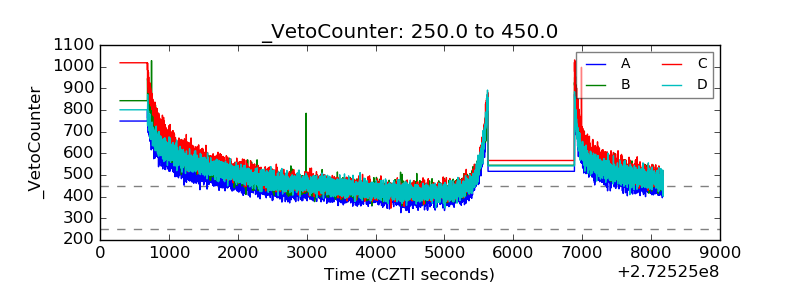 |