| Param | Original file | Final file |
|---|---|---|
| Filename | modeM0/AS1T02_084T01_9000002318_15666cztM0_level2.evt | modeM0/AS1T02_084T01_9000002318_15666cztM0_level2_quad_clean.evt |
| Size (bytes) | 613,935,360 | 100,175,040 |
| Size | 585.5 MB | 95.5 MB |
| Events in quadrant A | 3,543,909 | 648,380 |
| Events in quadrant B | 6,720,479 | 614,345 |
| Events in quadrant C | 3,479,652 | 640,020 |
| Events in quadrant D | 4,358,775 | 626,995 |
| Mode M0 | |||
|---|---|---|---|
| Quadrant | BADHDUFLAG | Total packets | Discarded packets |
| A | 0 | 15176 | 2 |
| B | 0 | 24714 | 1 |
| C | 0 | 14945 | 1 |
| D | 0 | 17670 | 1 |
| Mode M9 | |||
|---|---|---|---|
| Quadrant | BADHDUFLAG | Total packets | Discarded packets |
| A | 0 | 2 | 0 |
| B | 0 | 2 | 0 |
| C | 0 | 2 | 0 |
| D | 0 | 2 | 0 |
| Mode SS | |||
|---|---|---|---|
| Quadrant | BADHDUFLAG | Total packets | Discarded packets |
| A | 0 | 148 | 0 |
| B | 0 | 148 | 0 |
| C | 0 | 148 | 0 |
| D | 0 | 148 | 0 |
| Quadrant | Total seconds | Saturated seconds | Saturation percentage |
|---|---|---|---|
| A | 7227 | 97 | 1.342189% |
| B | 7227 | 1070 | 14.805590% |
| C | 7227 | 123 | 1.701951% |
| D | 7227 | 159 | 2.200083% |
Noise dominated data is calculated using 1-second bins in cleaned event files. If a bin has >2000 counts, and if more than 50% of those come from <1% of pixels, then it is considered to be noise-dominated and hence unusable.
| Quadrant | # 1 sec bins | Bins with >0 counts | Bins with >2000 counts | High rate bins dominated by noise | Noise dominated (total time) | Noise dominated (detector-on time) | Marked lightcurve |
|---|---|---|---|---|---|---|---|
| A | 7458 | 7229 | 0 | 0 | 0.00% | 0.00% | 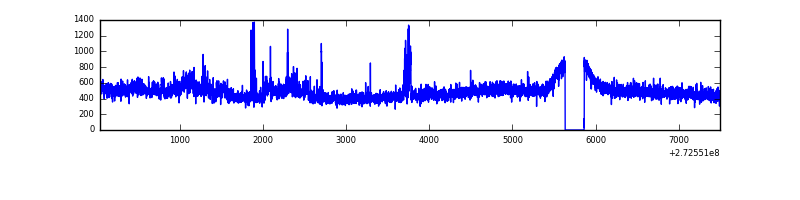 |
| B | 7458 | 7229 | 782 | 782 | 10.49% | 10.82% | 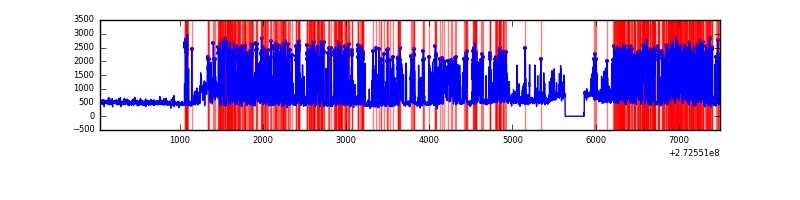 |
| C | 7458 | 7229 | 1 | 1 | 0.01% | 0.01% | 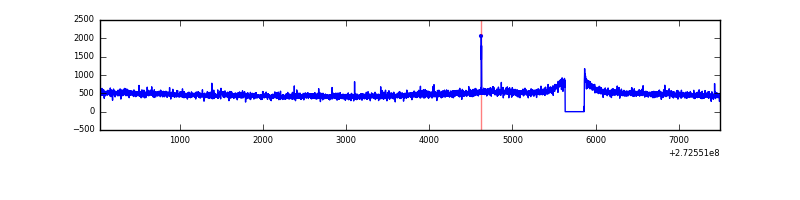 |
| D | 7458 | 7229 | 140 | 140 | 1.88% | 1.94% | 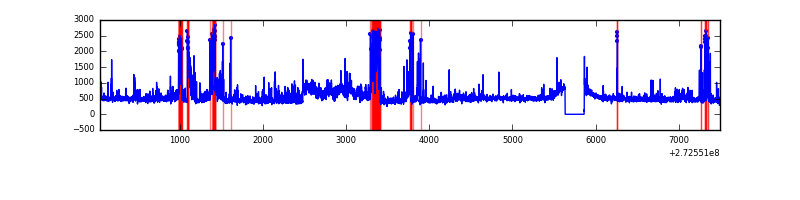 |
Top three noisy pixels from each quadrant. If the there are fewer than three noisy pixels in the level2.evt file, extra rows are filled as -1
| Pixel properties | Quadrant properties | ||||||
|---|---|---|---|---|---|---|---|
| Quadrant | DetID | PixID | Counts | Sigma | Mean | Median | Sigma |
| A | 3 | 80 | 164189 | 931.69 | 870 | 852 | 175.3 |
| A | 15 | 157 | 27339 | 151.08 | 870 | 852 | 175.3 |
| A | 0 | 226 | 7684 | 38.97 | 870 | 852 | 175.3 |
| B | 5 | 65 | 3355793 | 20963.67 | 832 | 810 | 160.0 |
| B | 3 | 209 | 35274 | 215.35 | 832 | 810 | 160.0 |
| B | 0 | 189 | 23754 | 143.37 | 832 | 810 | 160.0 |
| C | 14 | 238 | 129030 | 658.03 | 830 | 835 | 194.8 |
| C | 3 | 233 | 103951 | 529.3 | 830 | 835 | 194.8 |
| C | 10 | 187 | 8282 | 38.23 | 830 | 835 | 194.8 |
| D | 1 | 52 | 981599 | 4426.44 | 838 | 820 | 221.6 |
| D | 10 | 40 | 48619 | 215.73 | 838 | 820 | 221.6 |
| D | 13 | 172 | 45228 | 200.42 | 838 | 820 | 221.6 |
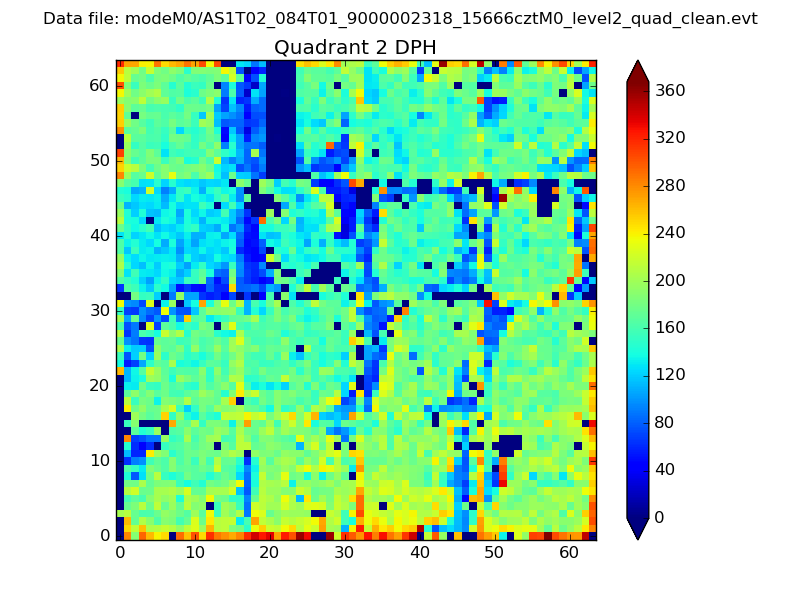
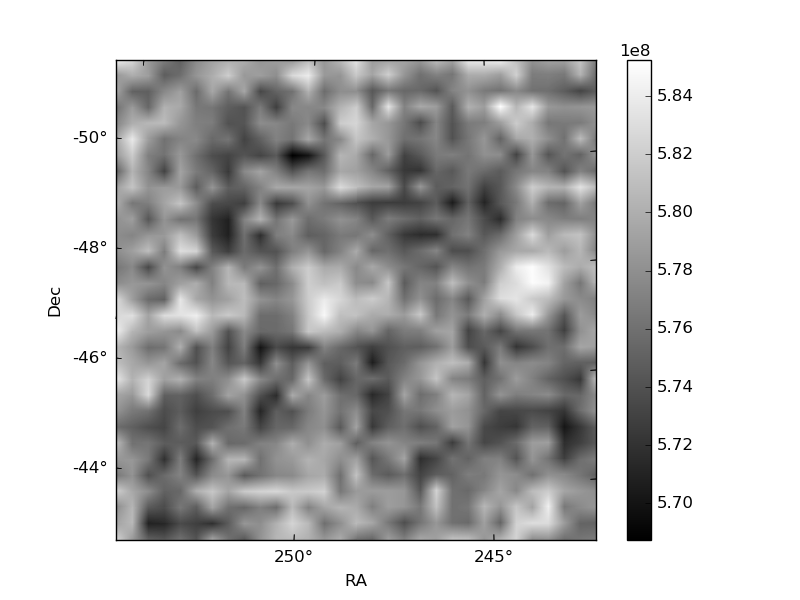
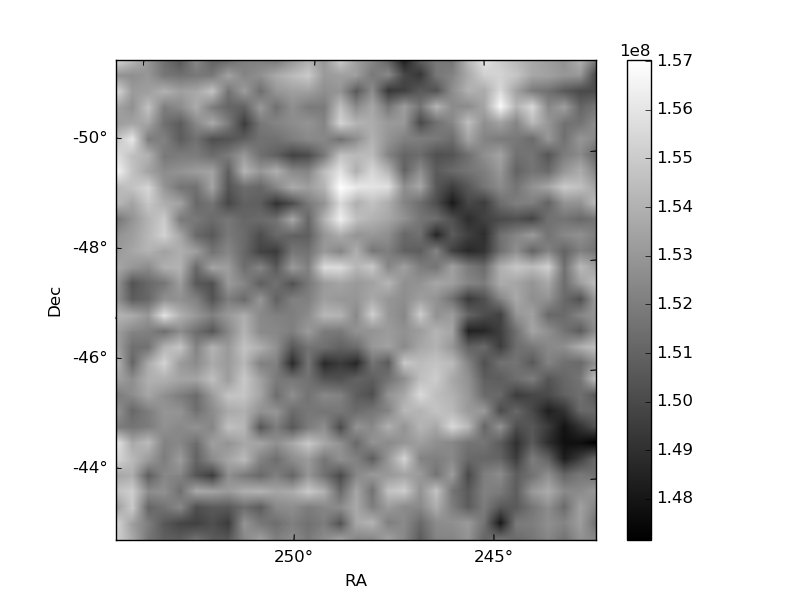
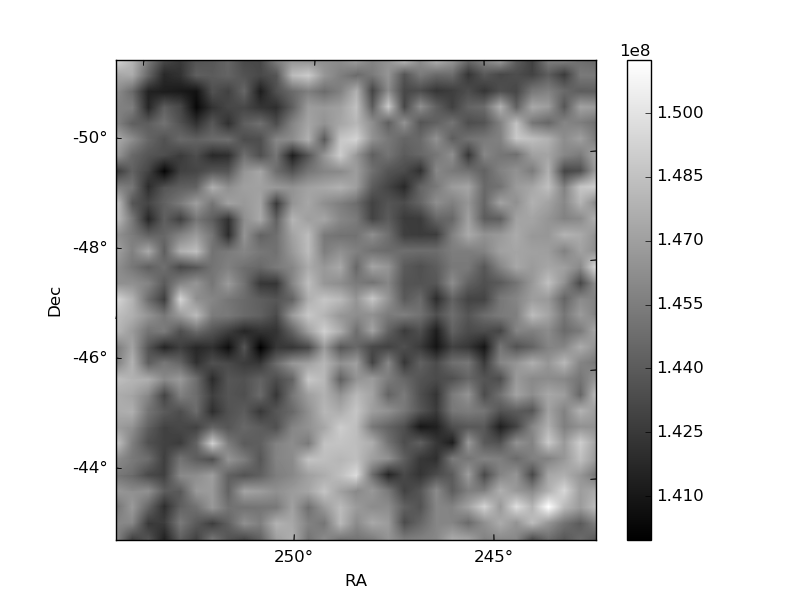
Histogram calculated using DETX and DETY for each event in the final _common_clean file
| Quadrant A | 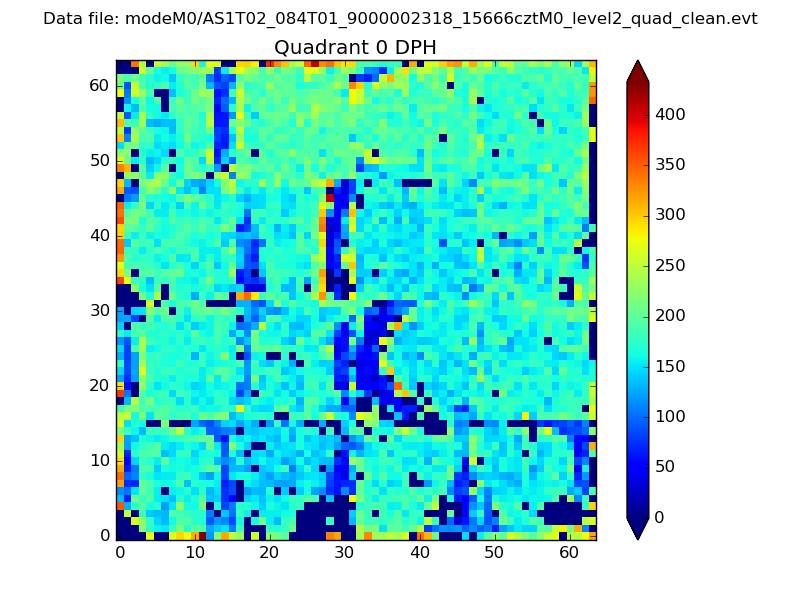 |
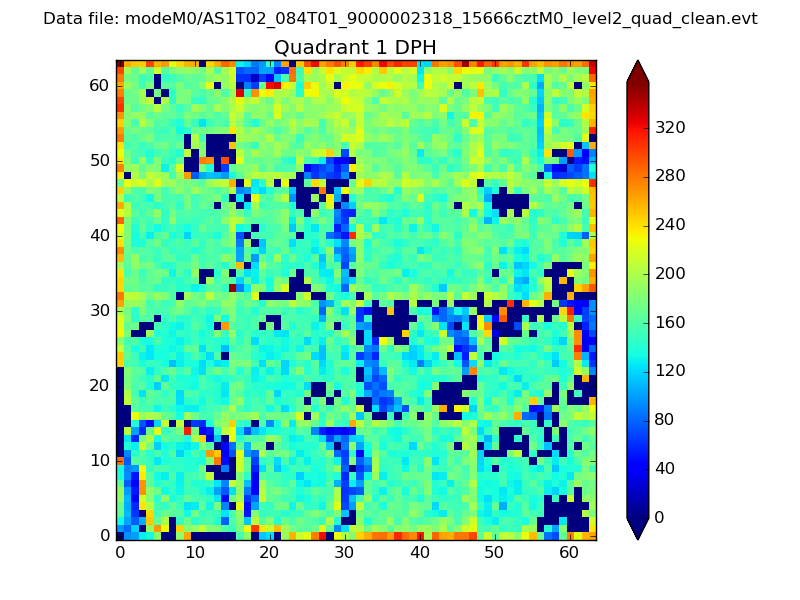 |
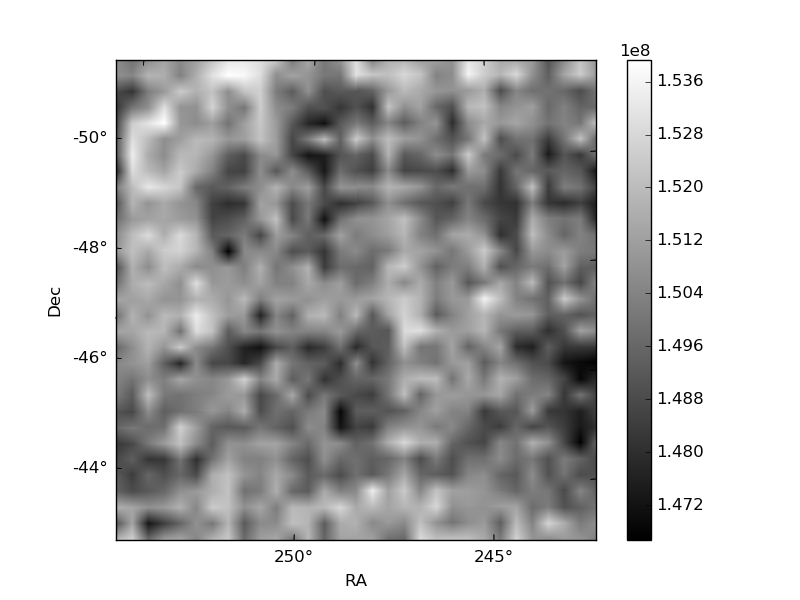
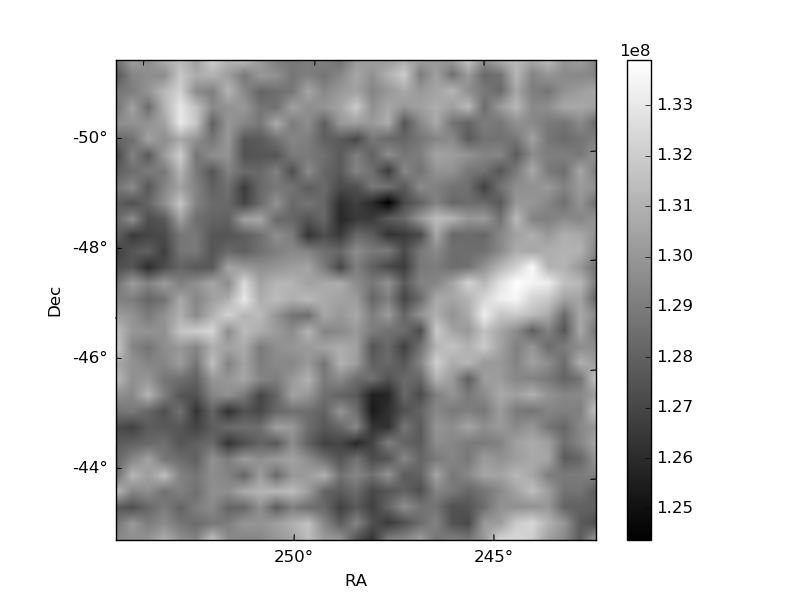
Quadrant B |
|---|---|---|---|
| Quadrant D | 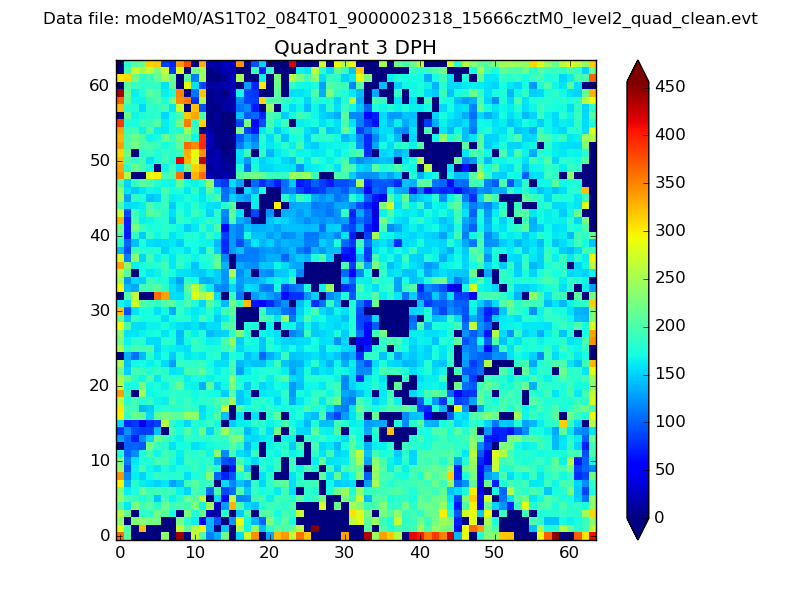 |
 |
Quadrant C |
| Plot type | Count rate plots | Images |
|---|---|---|
| Comparison with Poisson distribution Blue bars denote a histogram of data divided into 1 sec bins. Red curve is a Poisson curve with rate = median count rate of data. |
 |
 |
| Quadrant-wise count rates Data is divided into 100 sec bins |
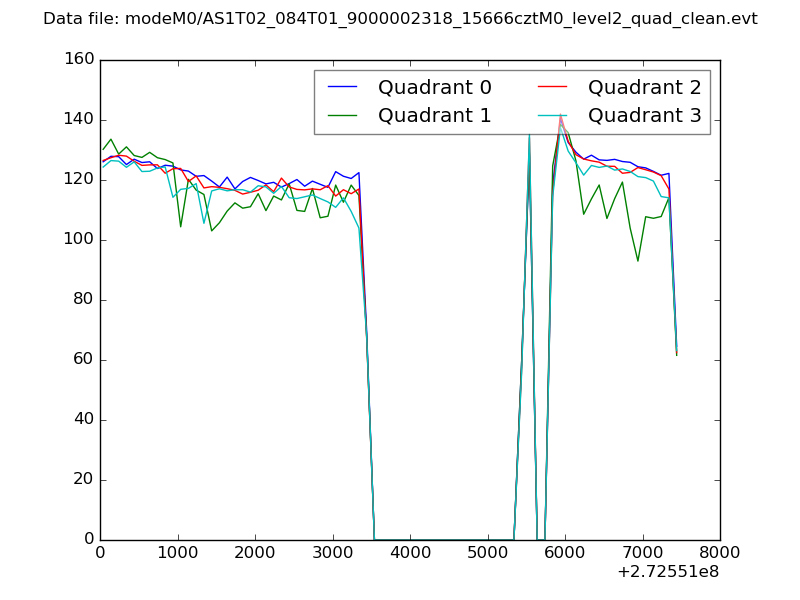 |
|
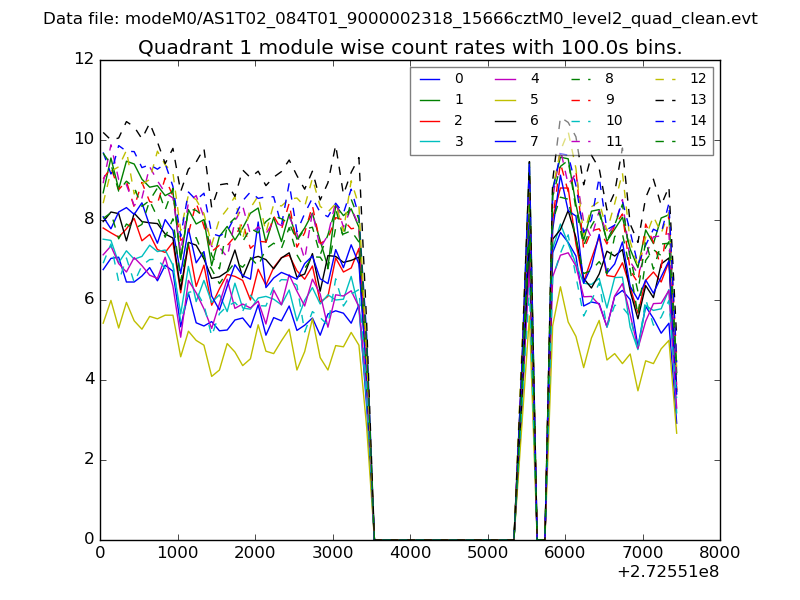
| Module-wise count rates for Quadrant A Data is divided into 100 sec bins |
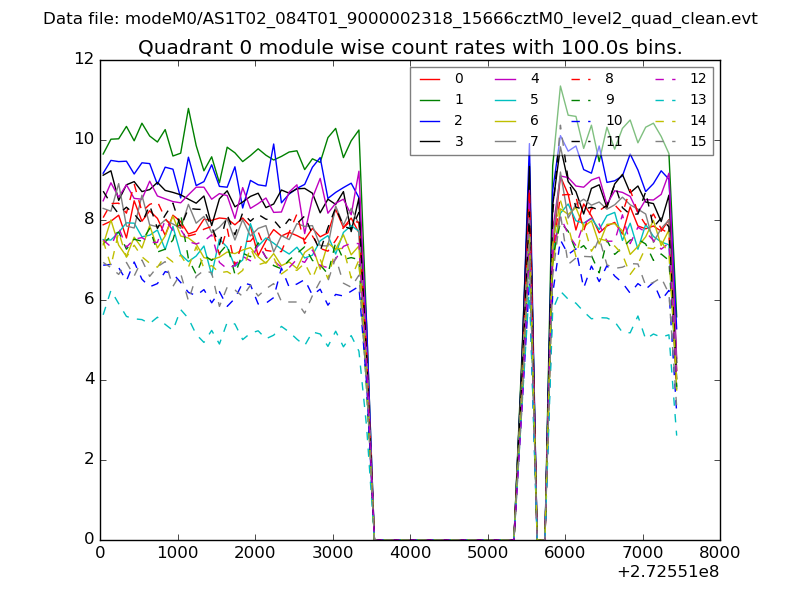 |
 |
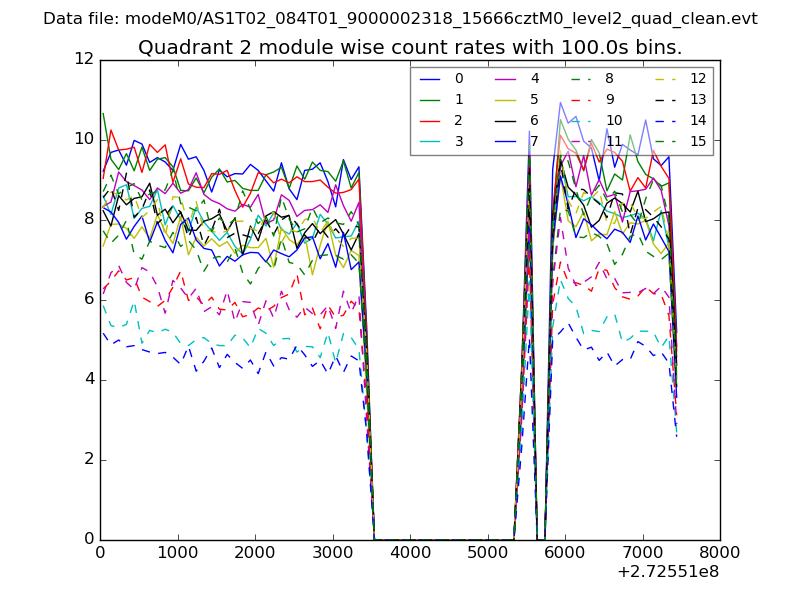
| Module-wise count rates for Quadrant B Data is divided into 100 sec bins |
 |
 |
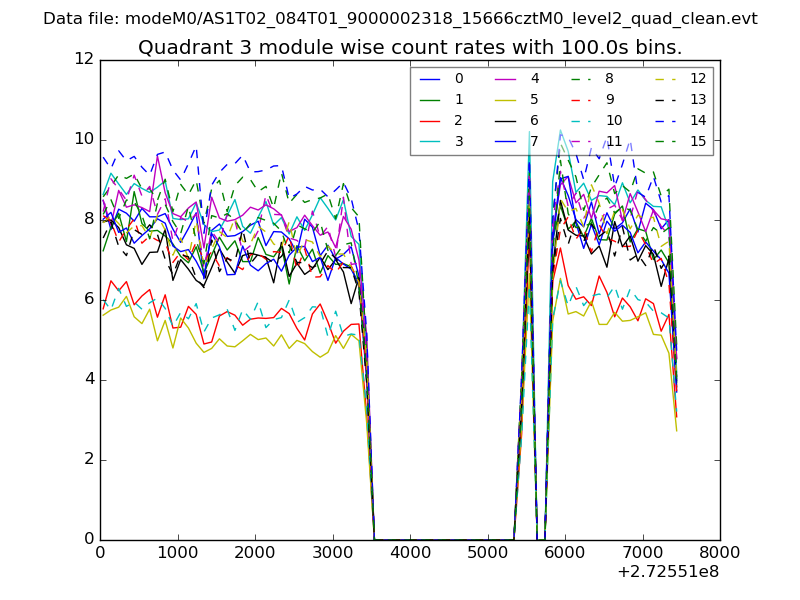
| Module-wise count rates for Quadrant C Data is divided into 100 sec bins |
 |
 |
| Module-wise count rates for Quadrant D Data is divided into 100 sec bins |
 |
 |
| Parameter | Plot |
|---|---|
| CZT HV Monitor | 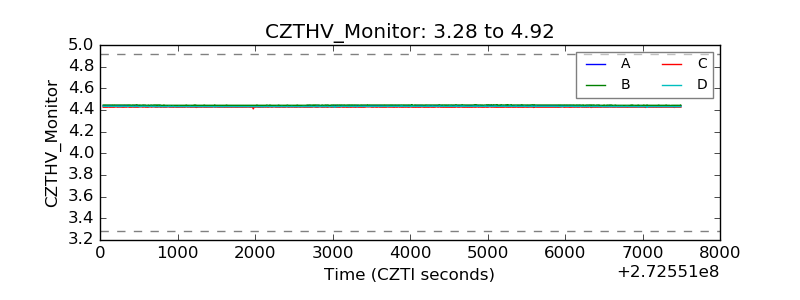 |
| D_VDD | 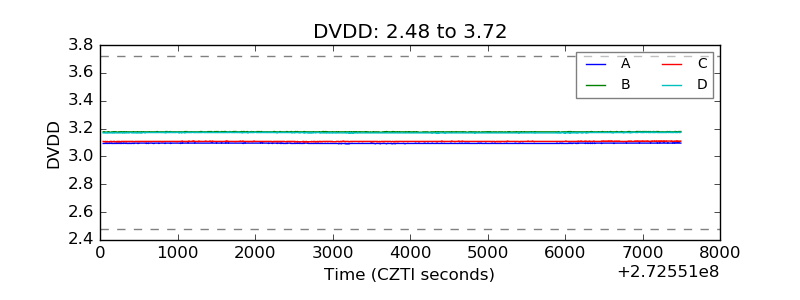 |
| Temperature 1 |  |
| Veto HV Monitor | 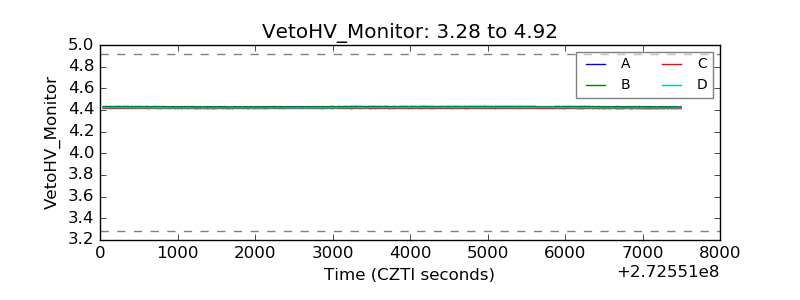 |
| Veto LLD | 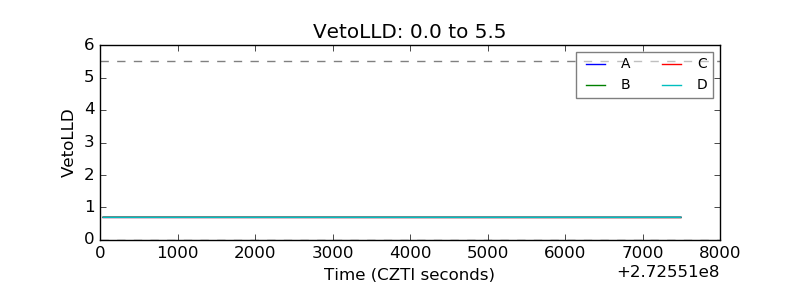 |
| Alpha Counter | 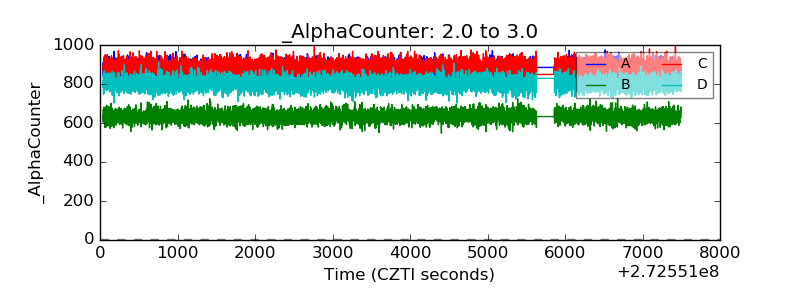 |
| _CPM_Rate | 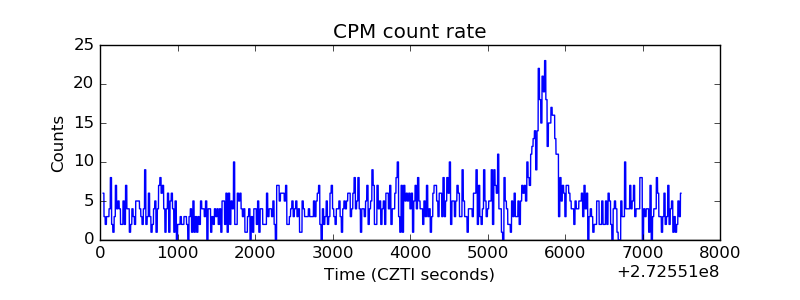 |
| CZT Counter | 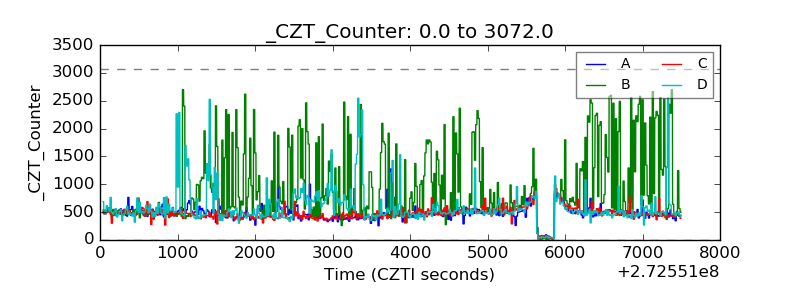 |
| +2.5 Volts monitor |  |
| +5 Volts monitor |  |
| _ROLL_ROT | 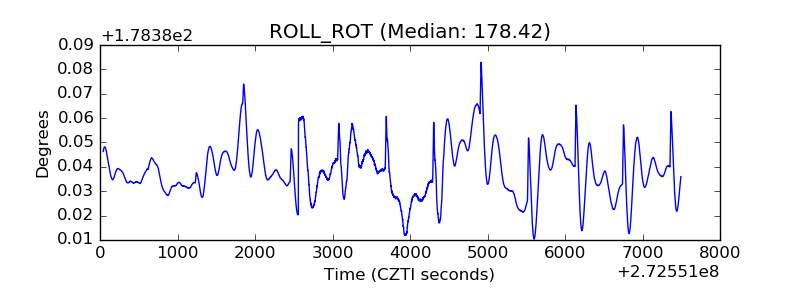 |
| _Roll_DEC | 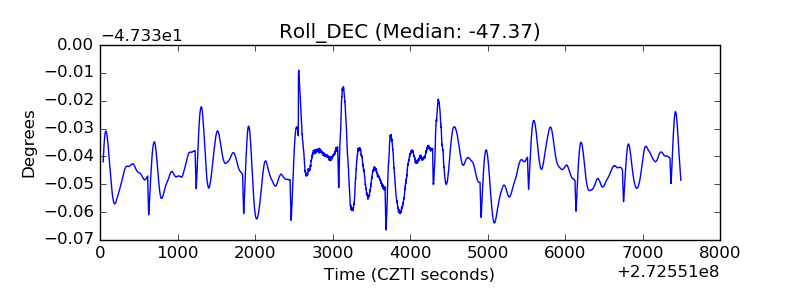 |
| _Roll_RA | 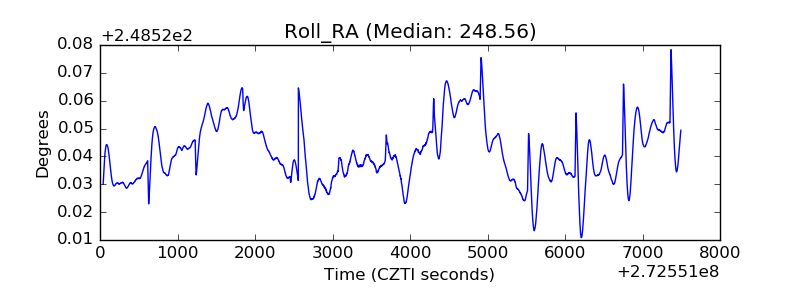 |
| Veto Counter | 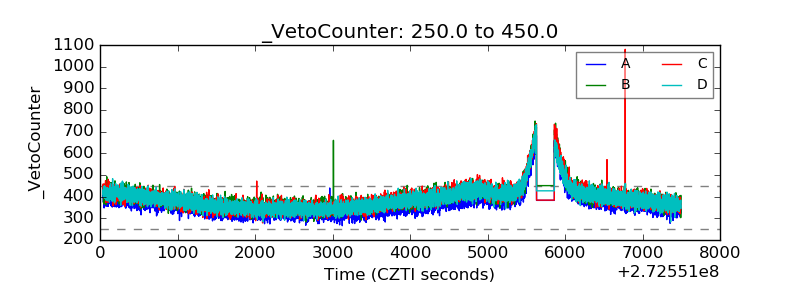 |