| Param | Original file | Final file |
|---|---|---|
| Filename | modeM0/AS1T02_084T01_9000002318_15669cztM0_level2.evt | modeM0/AS1T02_084T01_9000002318_15669cztM0_level2_quad_clean.evt |
| Size (bytes) | 916,819,200 | 170,242,560 |
| Size | 874.3 MB | 162.4 MB |
| Events in quadrant A | 5,820,133 | 1,085,404 |
| Events in quadrant B | 8,443,117 | 1,077,840 |
| Events in quadrant C | 5,984,651 | 1,065,296 |
| Events in quadrant D | 6,655,608 | 1,046,670 |
| Mode M0 | |||
|---|---|---|---|
| Quadrant | BADHDUFLAG | Total packets | Discarded packets |
| A | 0 | 25993 | 4 |
| B | 0 | 33574 | 3 |
| C | 0 | 26203 | 3 |
| D | 0 | 29072 | 3 |
| Mode M9 | |||
|---|---|---|---|
| Quadrant | BADHDUFLAG | Total packets | Discarded packets |
| A | 0 | 14 | 0 |
| B | 0 | 14 | 0 |
| C | 0 | 14 | 0 |
| D | 0 | 14 | 0 |
| Mode SS | |||
|---|---|---|---|
| Quadrant | BADHDUFLAG | Total packets | Discarded packets |
| A | 0 | 258 | 0 |
| B | 0 | 258 | 0 |
| C | 0 | 258 | 0 |
| D | 0 | 258 | 0 |
| Quadrant | Total seconds | Saturated seconds | Saturation percentage |
|---|---|---|---|
| A | 12749 | 53 | 0.415719% |
| B | 12749 | 303 | 2.376657% |
| C | 12749 | 111 | 0.870657% |
| D | 12750 | 41 | 0.321569% |
Noise dominated data is calculated using 1-second bins in cleaned event files. If a bin has >2000 counts, and if more than 50% of those come from <1% of pixels, then it is considered to be noise-dominated and hence unusable.
| Quadrant | # 1 sec bins | Bins with >0 counts | Bins with >2000 counts | High rate bins dominated by noise | Noise dominated (total time) | Noise dominated (detector-on time) | Marked lightcurve |
|---|---|---|---|---|---|---|---|
| A | 14090 | 12752 | 0 | 0 | 0.00% | 0.00% | 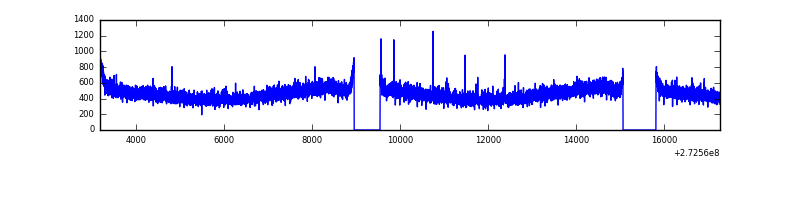 |
| B | 14090 | 12752 | 145 | 145 | 1.03% | 1.14% | 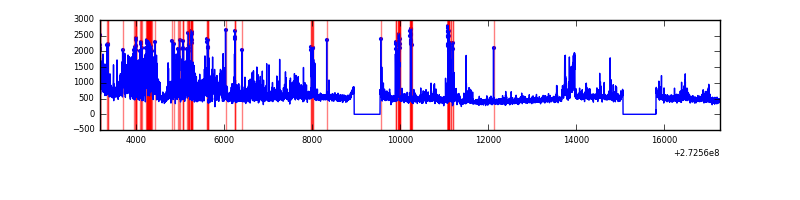 |
| C | 14090 | 12752 | 0 | 0 | 0.00% | 0.00% | 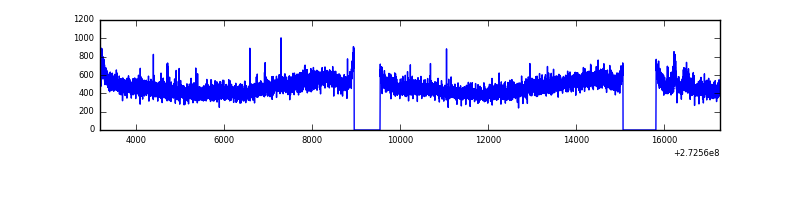 |
| D | 14091 | 12753 | 12 | 12 | 0.09% | 0.09% | 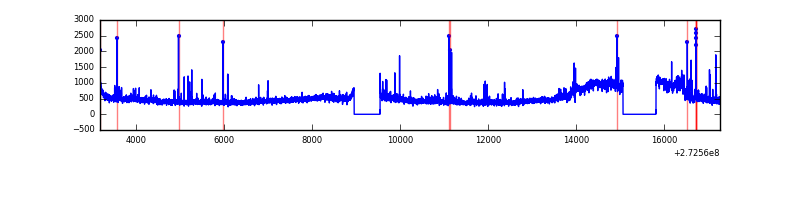 |
Top three noisy pixels from each quadrant. If the there are fewer than three noisy pixels in the level2.evt file, extra rows are filled as -1
| Pixel properties | Quadrant properties | ||||||
|---|---|---|---|---|---|---|---|
| Quadrant | DetID | PixID | Counts | Sigma | Mean | Median | Sigma |
| A | 4 | 2 | 14723 | 44.07 | 1503 | 1474 | 300.6 |
| A | 0 | 226 | 13635 | 40.45 | 1503 | 1474 | 300.6 |
| A | 12 | 194 | 11224 | 32.43 | 1503 | 1474 | 300.6 |
| B | 5 | 65 | 2148268 | 7587.58 | 1492 | 1457 | 282.9 |
| B | 4 | 80 | 182914 | 641.33 | 1492 | 1457 | 282.9 |
| B | 0 | 189 | 67480 | 233.35 | 1492 | 1457 | 282.9 |
| C | 14 | 238 | 223844 | 662.26 | 1435 | 1441 | 335.8 |
| C | 3 | 233 | 122771 | 361.29 | 1435 | 1441 | 335.8 |
| C | 8 | 128 | 12102 | 31.74 | 1435 | 1441 | 335.8 |
| D | 1 | 52 | 1034660 | 2941.16 | 1453 | 1409 | 351.3 |
| D | 2 | 234 | 54757 | 151.86 | 1453 | 1409 | 351.3 |
| D | 10 | 70 | 37503 | 102.74 | 1453 | 1409 | 351.3 |
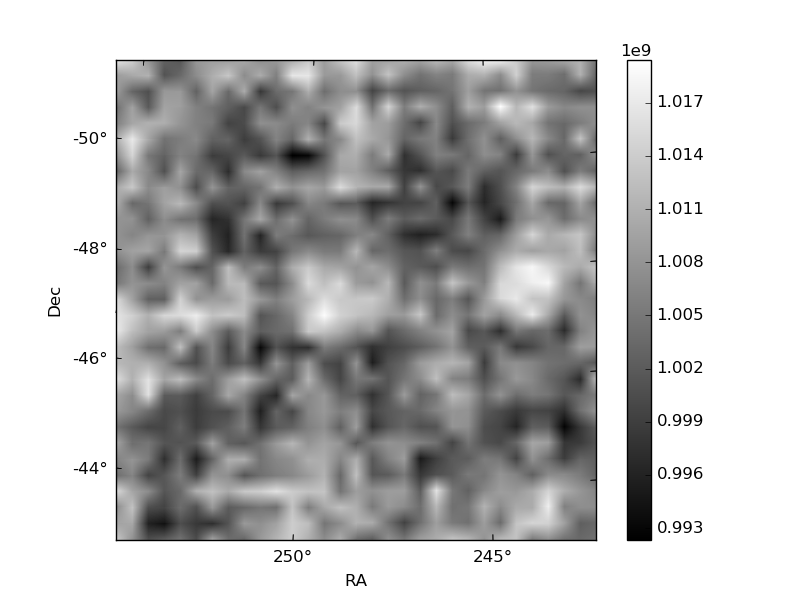
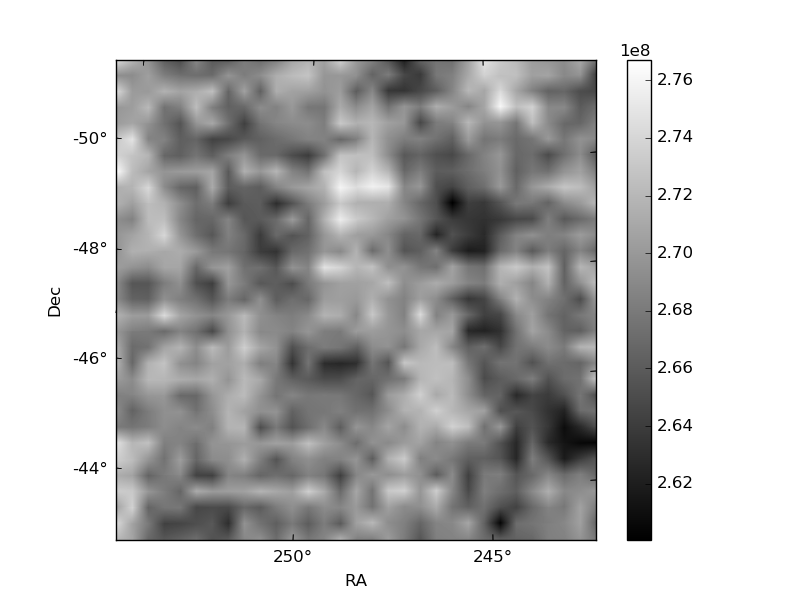
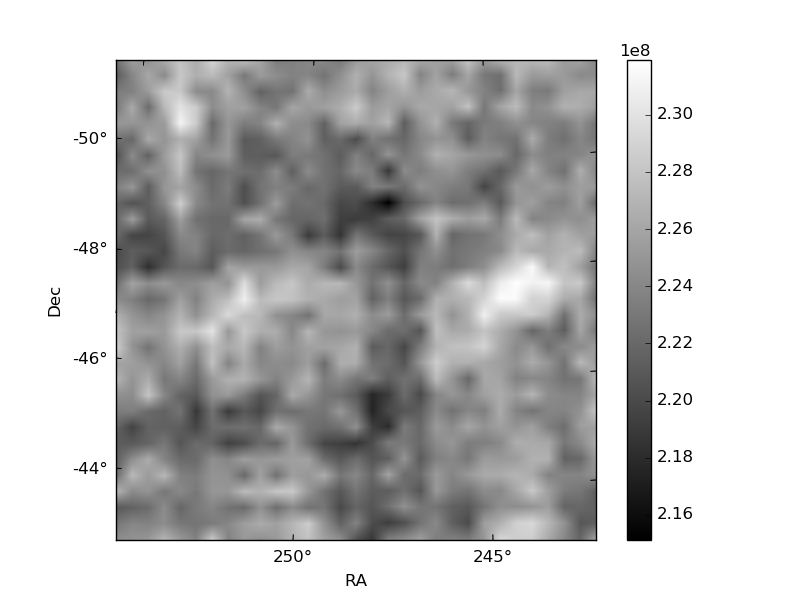
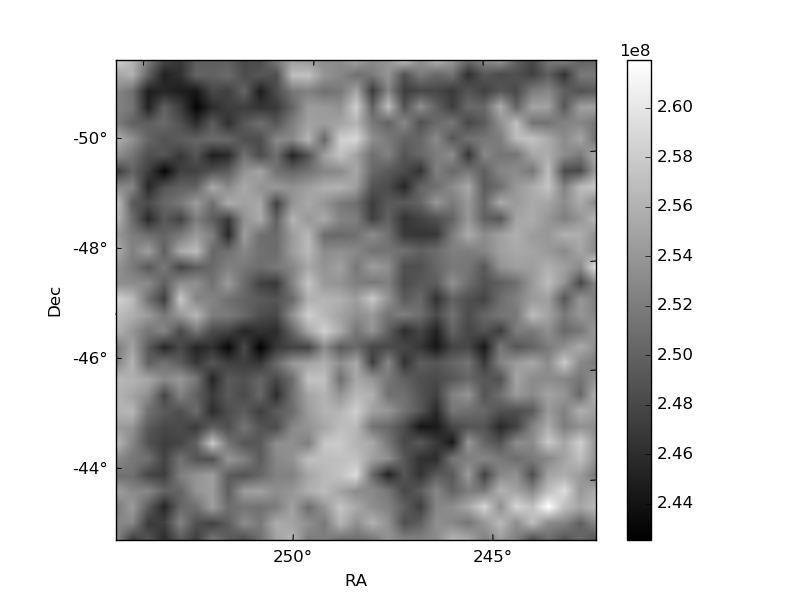
Histogram calculated using DETX and DETY for each event in the final _common_clean file
| Quadrant A | 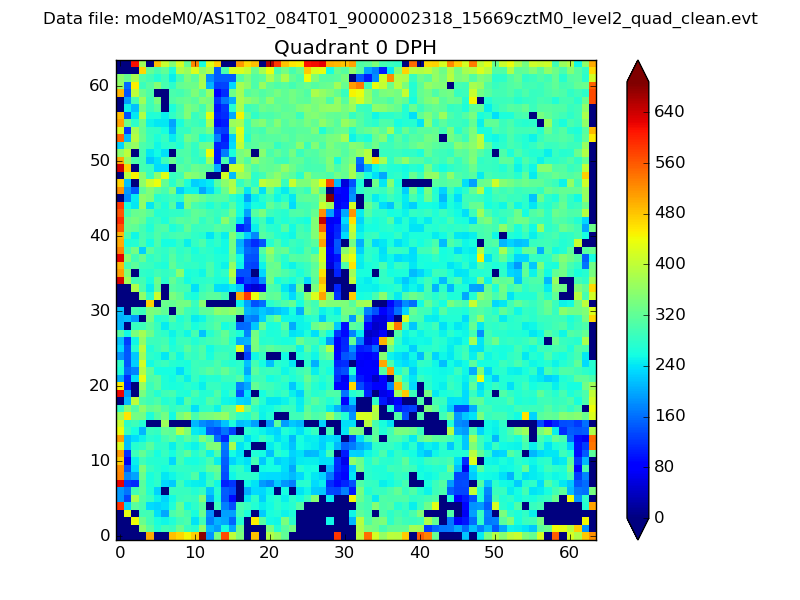 |
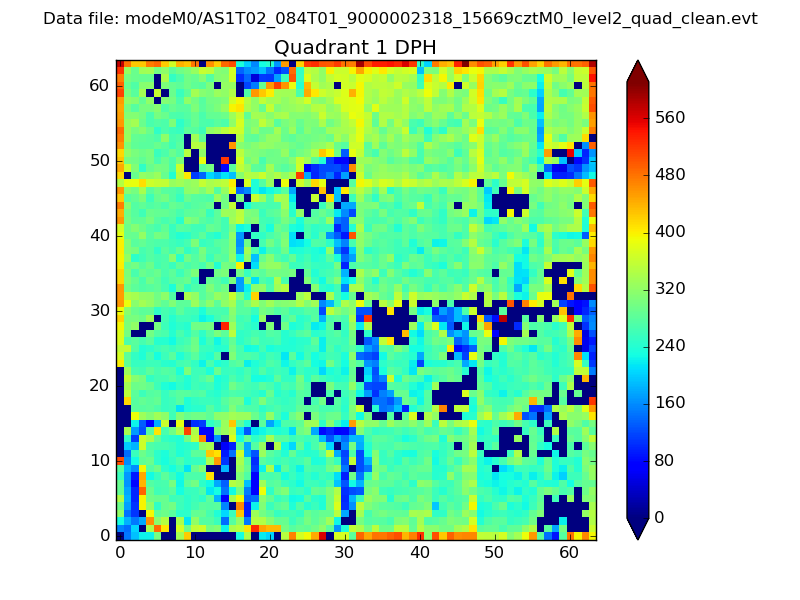 |
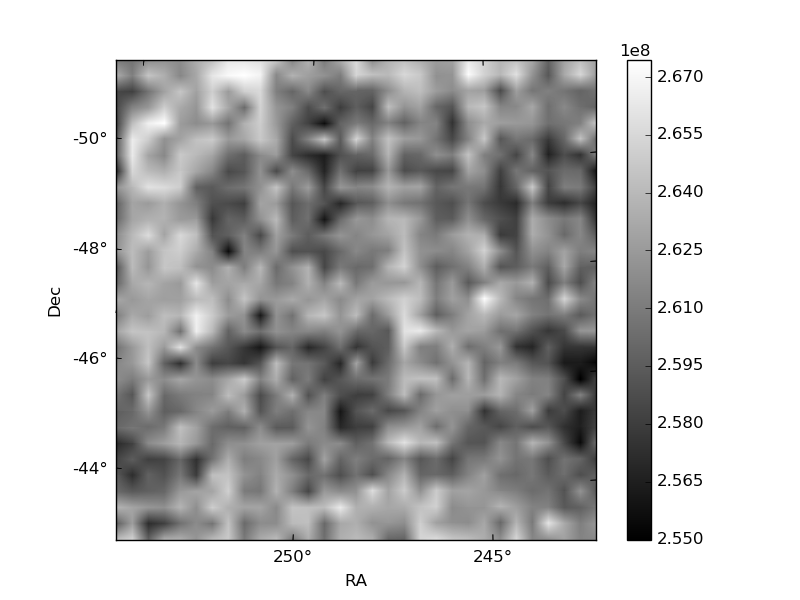
Quadrant B |
|---|---|---|---|
| Quadrant D | 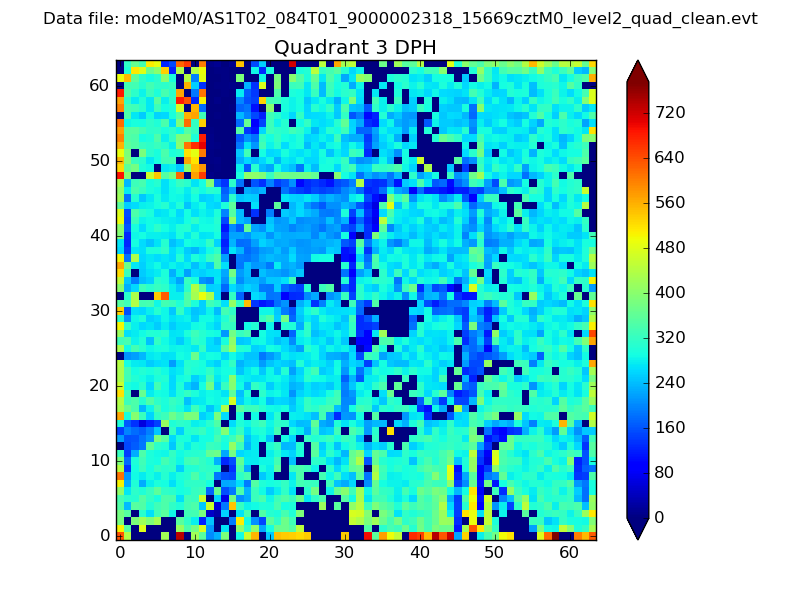 |
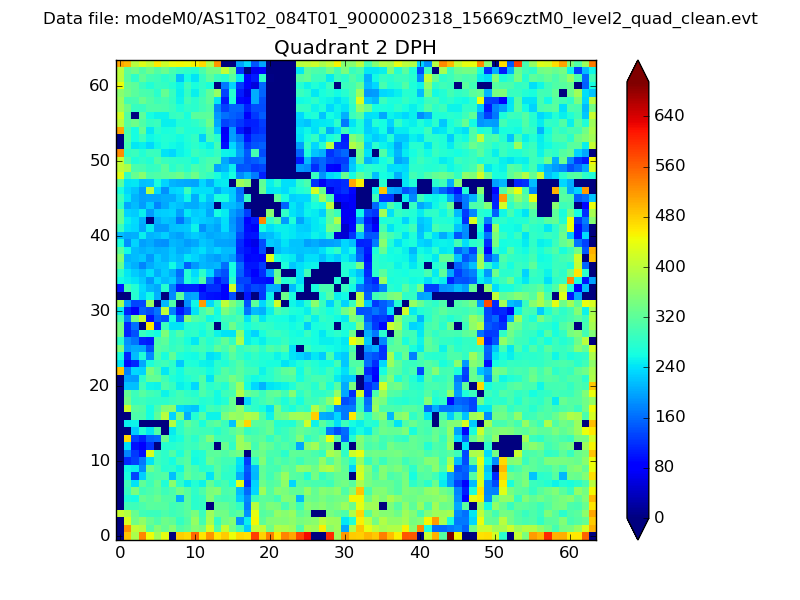 |
Quadrant C |
| Plot type | Count rate plots | Images |
|---|---|---|
| Comparison with Poisson distribution Blue bars denote a histogram of data divided into 1 sec bins. Red curve is a Poisson curve with rate = median count rate of data. |
 |
 |
| Quadrant-wise count rates Data is divided into 100 sec bins |
 |
|
| Module-wise count rates for Quadrant A Data is divided into 100 sec bins |
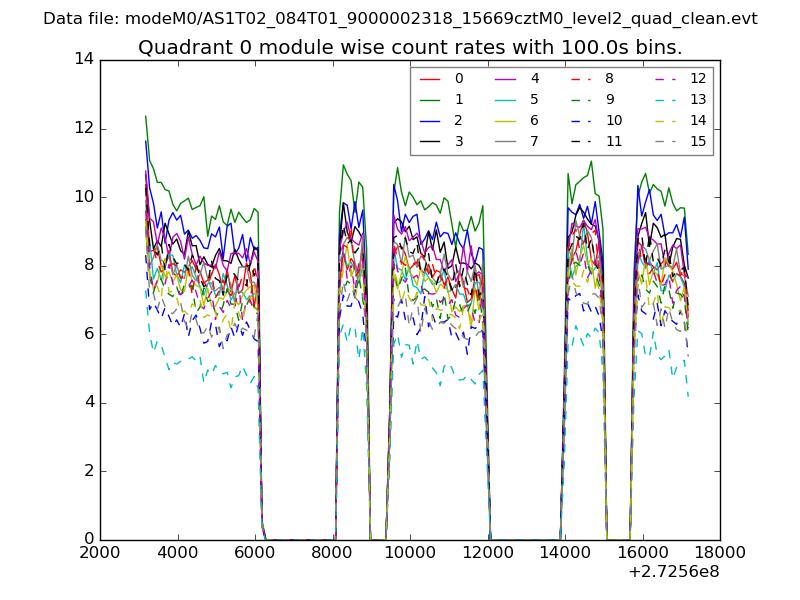 |
 |
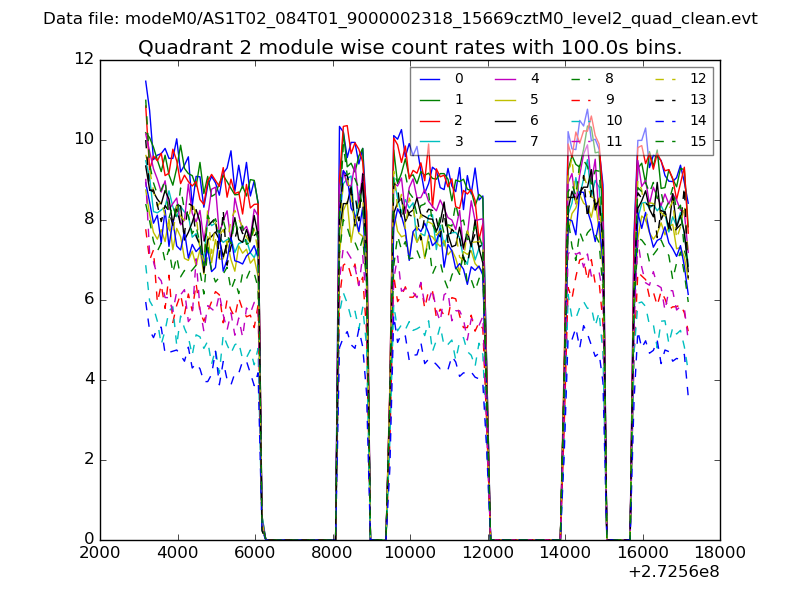
| Module-wise count rates for Quadrant B Data is divided into 100 sec bins |
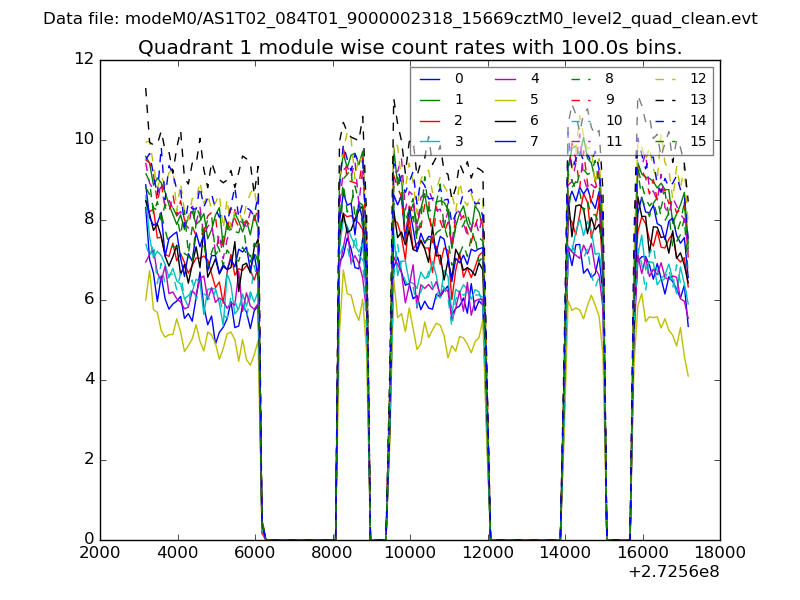 |
 |
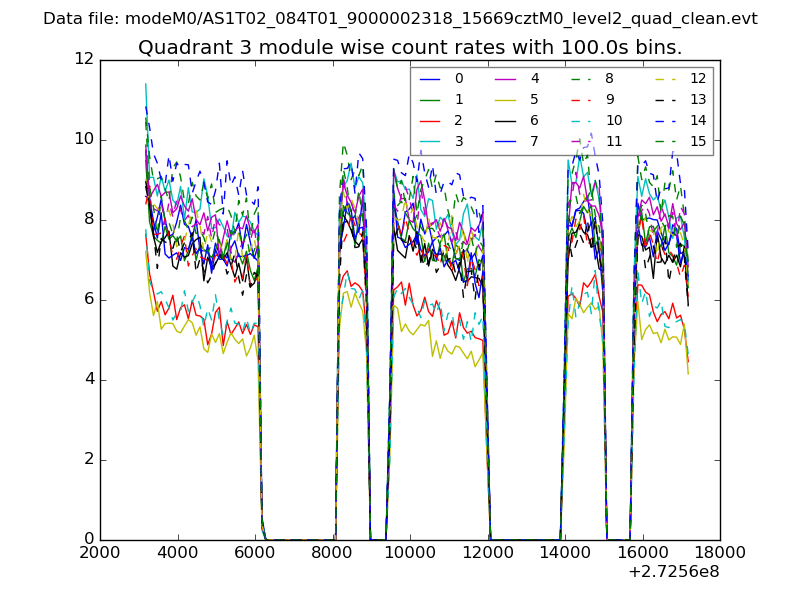
| Module-wise count rates for Quadrant C Data is divided into 100 sec bins |
 |
 |
| Module-wise count rates for Quadrant D Data is divided into 100 sec bins |
 |
 |
| Parameter | Plot |
|---|---|
| CZT HV Monitor | 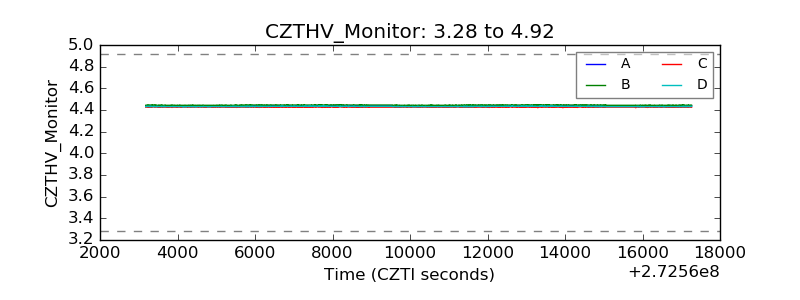 |
| D_VDD | 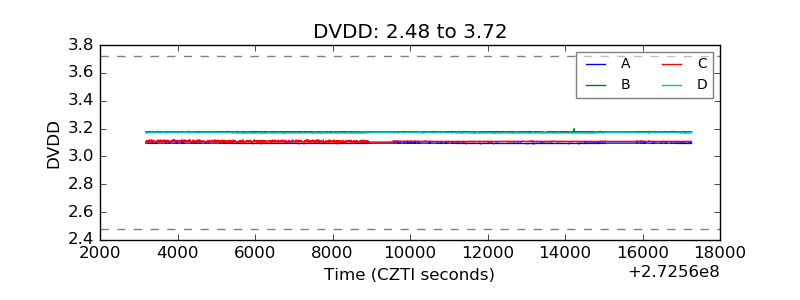 |
| Temperature 1 | 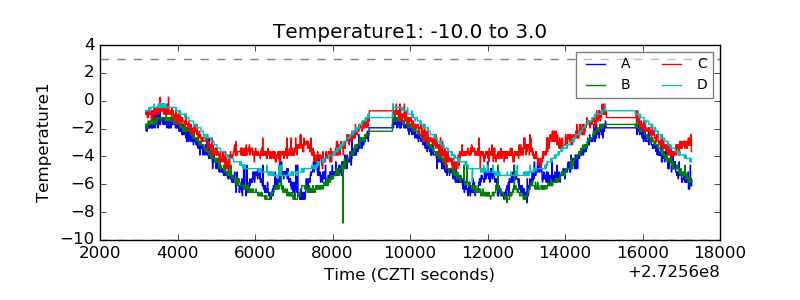 |
| Veto HV Monitor |  |
| Veto LLD | 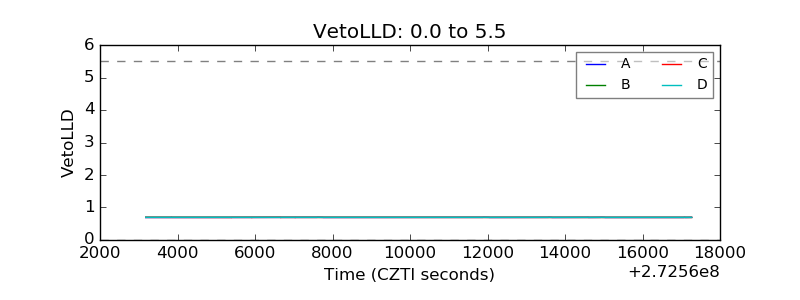 |
| Alpha Counter | 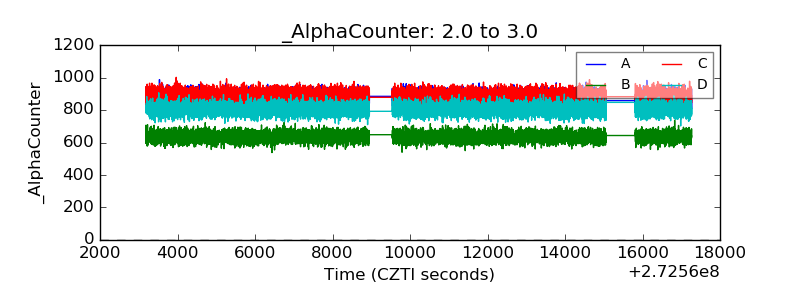 |
| _CPM_Rate |  |
| CZT Counter | 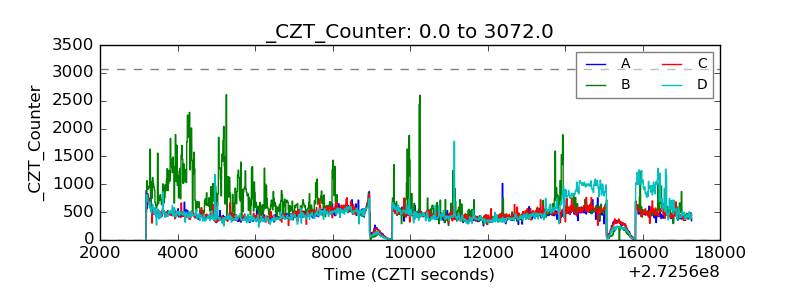 |
| +2.5 Volts monitor |  |
| +5 Volts monitor |  |
| _ROLL_ROT | 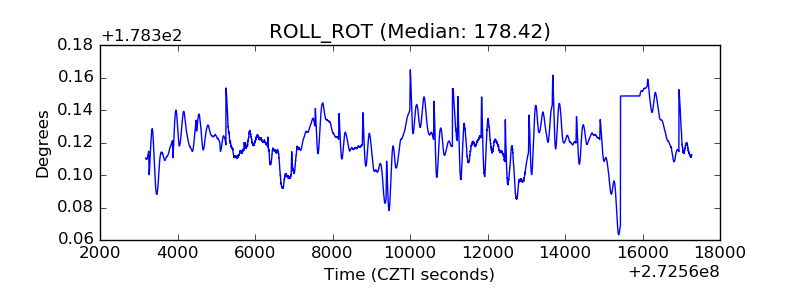 |
| _Roll_DEC | 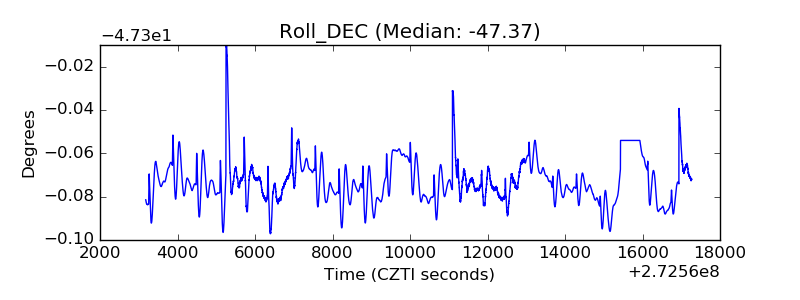 |
| _Roll_RA | 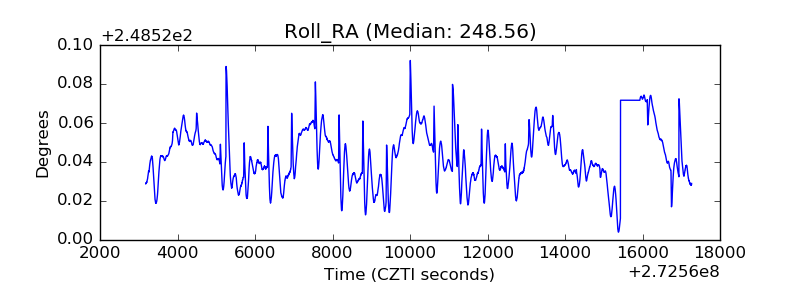 |
| Veto Counter | 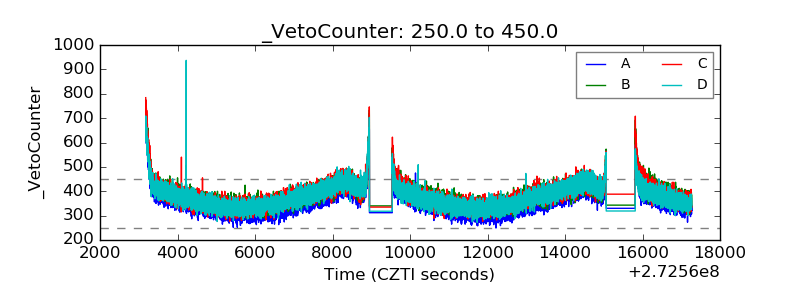 |