| Param | Original file | Final file |
|---|---|---|
| Filename | modeM0/AS1T02_084T01_9000002318_15670cztM0_level2.evt | modeM0/AS1T02_084T01_9000002318_15670cztM0_level2_quad_clean.evt |
| Size (bytes) | 489,493,440 | 94,996,800 |
| Size | 466.8 MB | 90.6 MB |
| Events in quadrant A | 3,077,531 | 608,139 |
| Events in quadrant B | 3,284,292 | 617,105 |
| Events in quadrant C | 3,204,032 | 597,531 |
| Events in quadrant D | 4,796,431 | 580,126 |
| Mode M0 | |||
|---|---|---|---|
| Quadrant | BADHDUFLAG | Total packets | Discarded packets |
| A | 0 | 13775 | 3 |
| B | 0 | 14164 | 2 |
| C | 0 | 13929 | 2 |
| D | 0 | 19009 | 2 |
| Mode M9 | |||
|---|---|---|---|
| Quadrant | BADHDUFLAG | Total packets | Discarded packets |
| A | 0 | 11 | 0 |
| B | 0 | 11 | 0 |
| C | 0 | 11 | 0 |
| D | 0 | 12 | 0 |
| Mode SS | |||
|---|---|---|---|
| Quadrant | BADHDUFLAG | Total packets | Discarded packets |
| A | 0 | 138 | 0 |
| B | 0 | 138 | 0 |
| C | 0 | 138 | 0 |
| D | 0 | 138 | 0 |
| Quadrant | Total seconds | Saturated seconds | Saturation percentage |
|---|---|---|---|
| A | 6802 | 9 | 0.132314% |
| B | 6802 | 15 | 0.220523% |
| C | 6802 | 36 | 0.529256% |
| D | 6802 | 444 | 6.527492% |
Noise dominated data is calculated using 1-second bins in cleaned event files. If a bin has >2000 counts, and if more than 50% of those come from <1% of pixels, then it is considered to be noise-dominated and hence unusable.
| Quadrant | # 1 sec bins | Bins with >0 counts | Bins with >2000 counts | High rate bins dominated by noise | Noise dominated (total time) | Noise dominated (detector-on time) | Marked lightcurve |
|---|---|---|---|---|---|---|---|
| A | 7728 | 6804 | 0 | 0 | 0.00% | 0.00% | 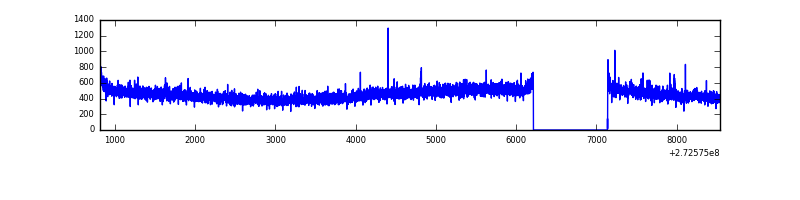 |
| B | 7728 | 6804 | 1 | 1 | 0.01% | 0.01% | 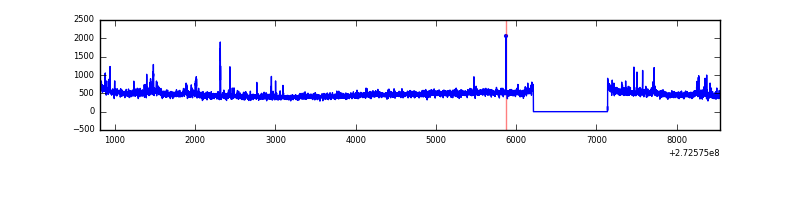 |
| C | 7728 | 6804 | 0 | 0 | 0.00% | 0.00% | 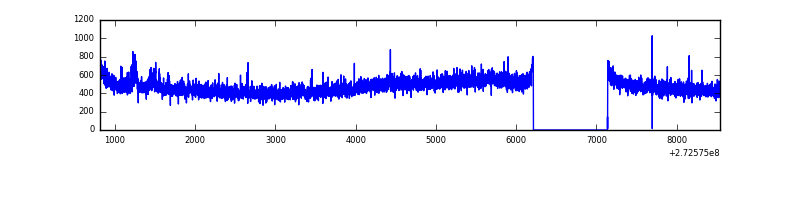 |
| D | 7728 | 6804 | 444 | 444 | 5.75% | 6.53% | 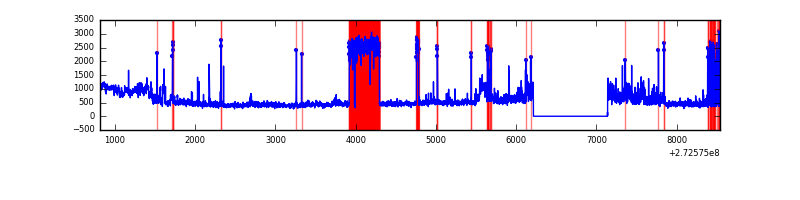 |
Top three noisy pixels from each quadrant. If the there are fewer than three noisy pixels in the level2.evt file, extra rows are filled as -1
| Pixel properties | Quadrant properties | ||||||
|---|---|---|---|---|---|---|---|
| Quadrant | DetID | PixID | Counts | Sigma | Mean | Median | Sigma |
| A | 0 | 226 | 7082 | 39.21 | 796 | 780 | 160.7 |
| A | 12 | 194 | 5810 | 31.29 | 796 | 780 | 160.7 |
| A | 3 | 137 | 5384 | 28.64 | 796 | 780 | 160.7 |
| B | 0 | 189 | 49988 | 320.72 | 799 | 781 | 153.4 |
| B | 4 | 216 | 24059 | 151.72 | 799 | 781 | 153.4 |
| B | 0 | 219 | 21667 | 136.13 | 799 | 781 | 153.4 |
| C | 14 | 238 | 118479 | 658.67 | 761 | 766 | 178.7 |
| C | 3 | 233 | 107009 | 594.49 | 761 | 766 | 178.7 |
| C | 13 | 61 | 5389 | 25.87 | 761 | 766 | 178.7 |
| D | 1 | 52 | 1891332 | 10407.88 | 745 | 723 | 181.7 |
| D | 10 | 70 | 38971 | 210.56 | 745 | 723 | 181.7 |
| D | 2 | 234 | 28180 | 151.15 | 745 | 723 | 181.7 |
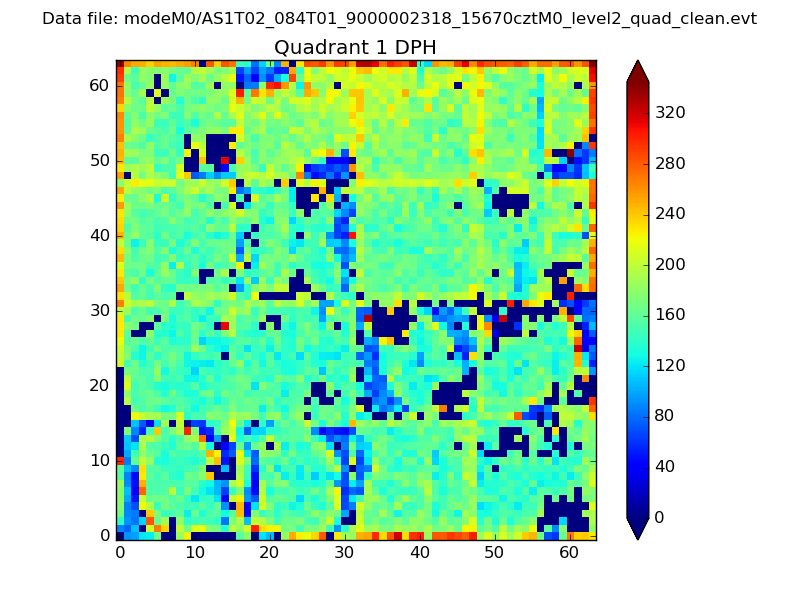
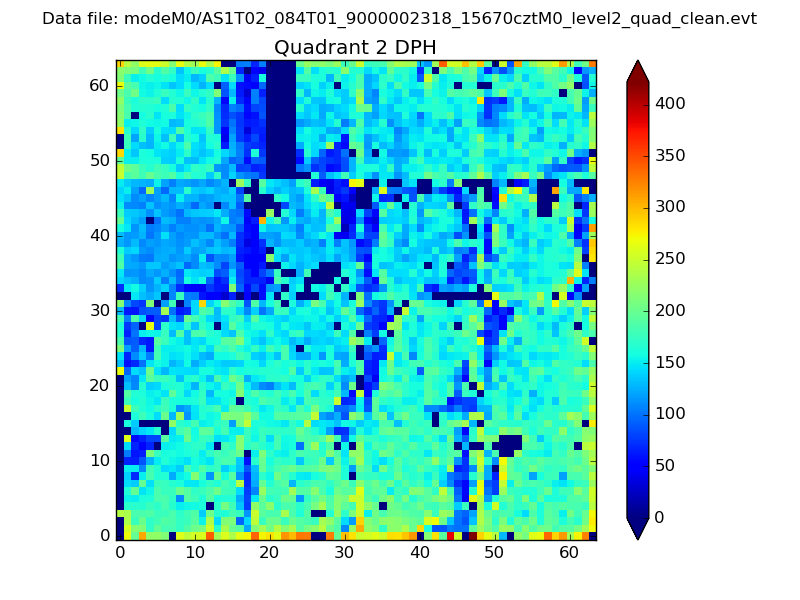
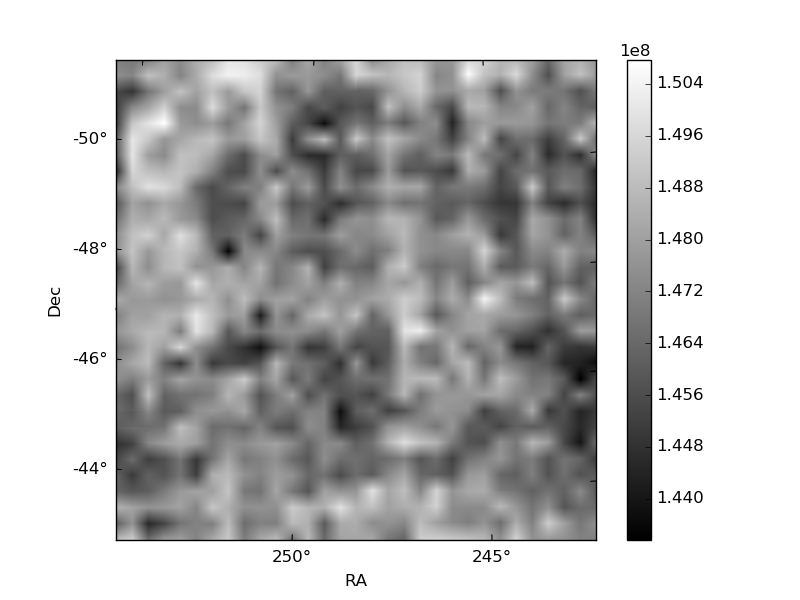
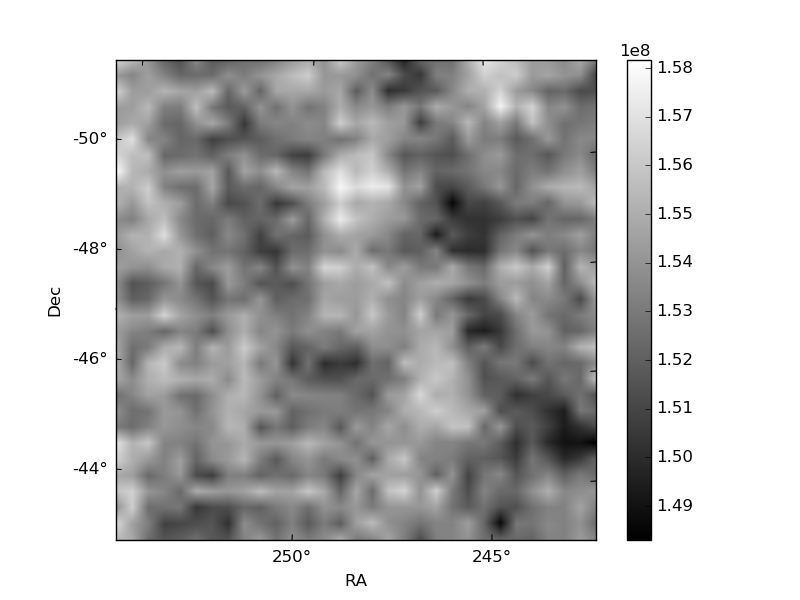
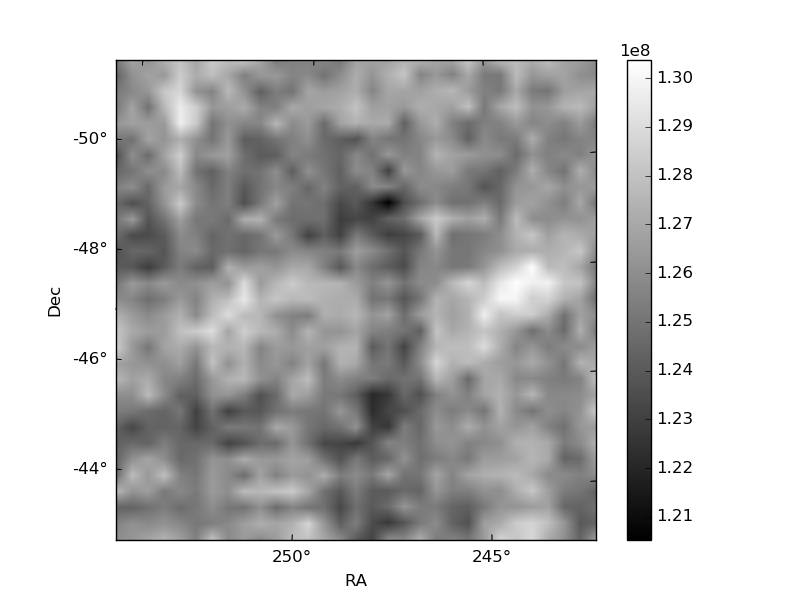
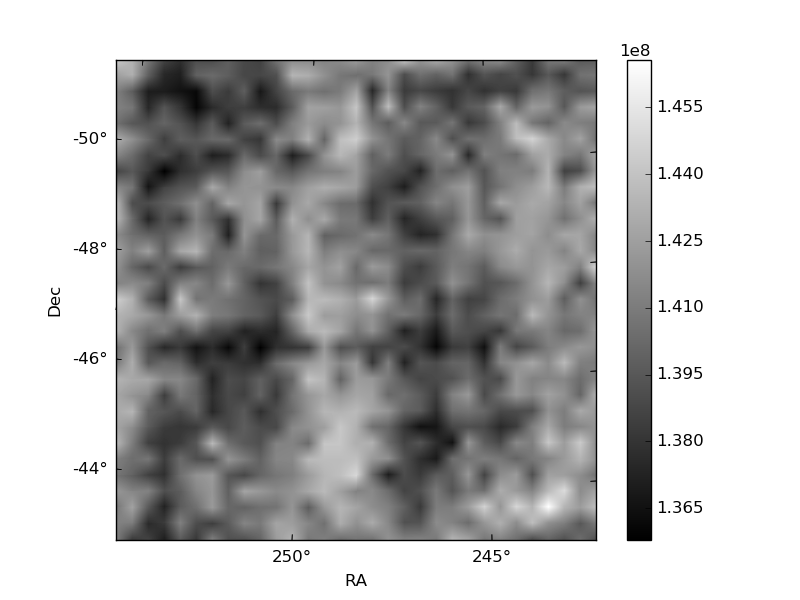
Histogram calculated using DETX and DETY for each event in the final _common_clean file
| Quadrant A | 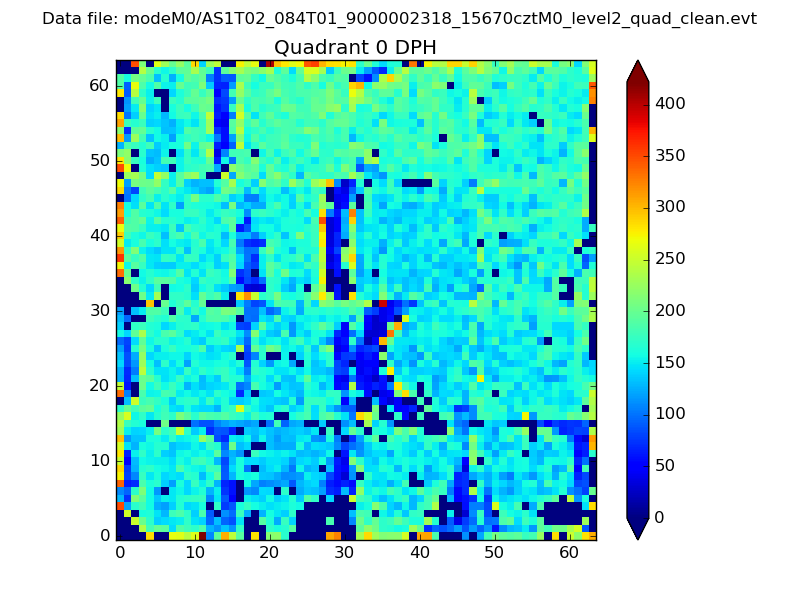 |
 |
Quadrant B |
|---|---|---|---|
| Quadrant D | 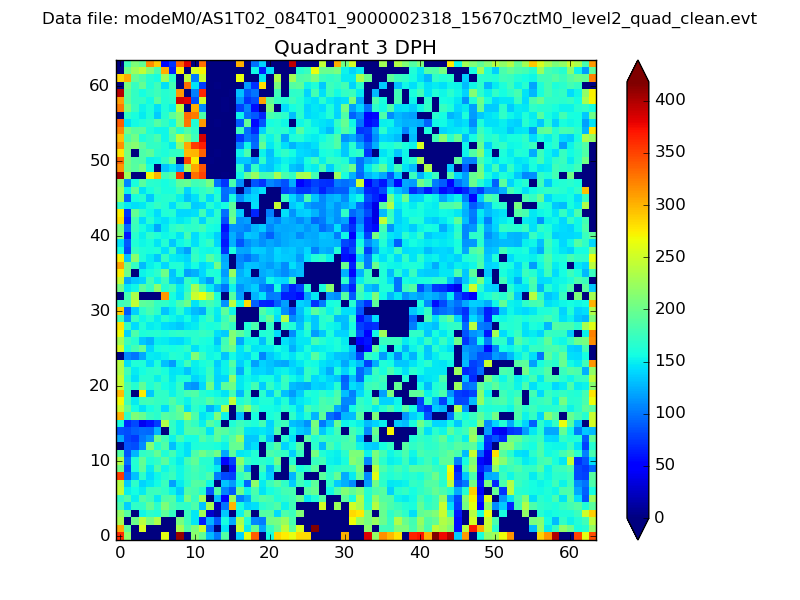 |
 |
Quadrant C |
| Plot type | Count rate plots | Images |
|---|---|---|
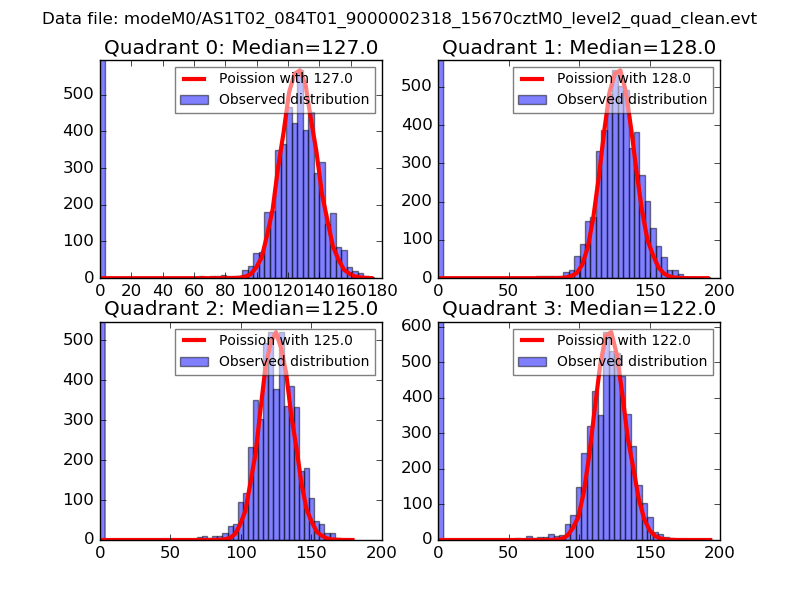
| Comparison with Poisson distribution Blue bars denote a histogram of data divided into 1 sec bins. Red curve is a Poisson curve with rate = median count rate of data. |
 |
 |
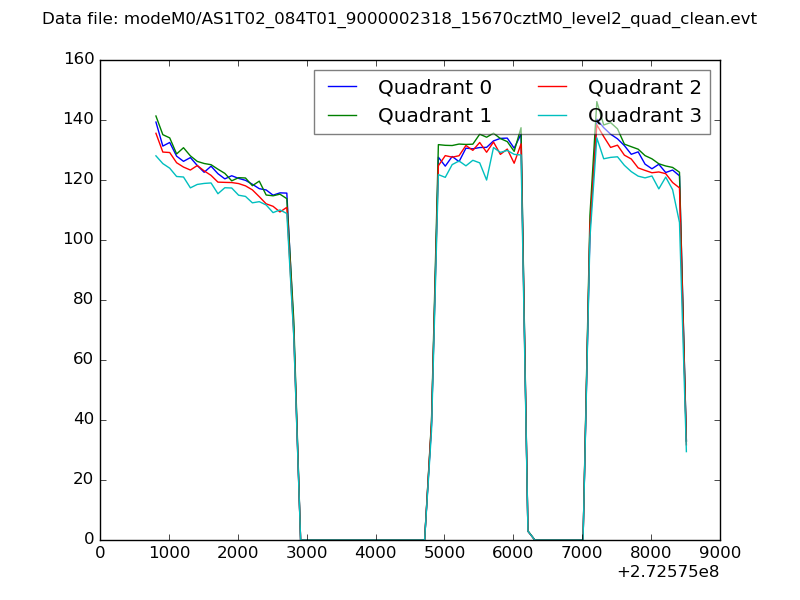
| Quadrant-wise count rates Data is divided into 100 sec bins |
 |
|
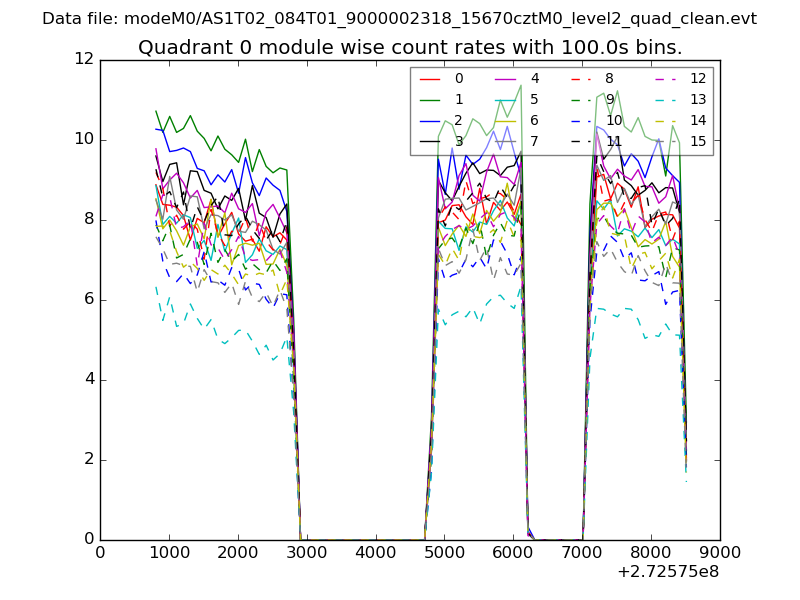
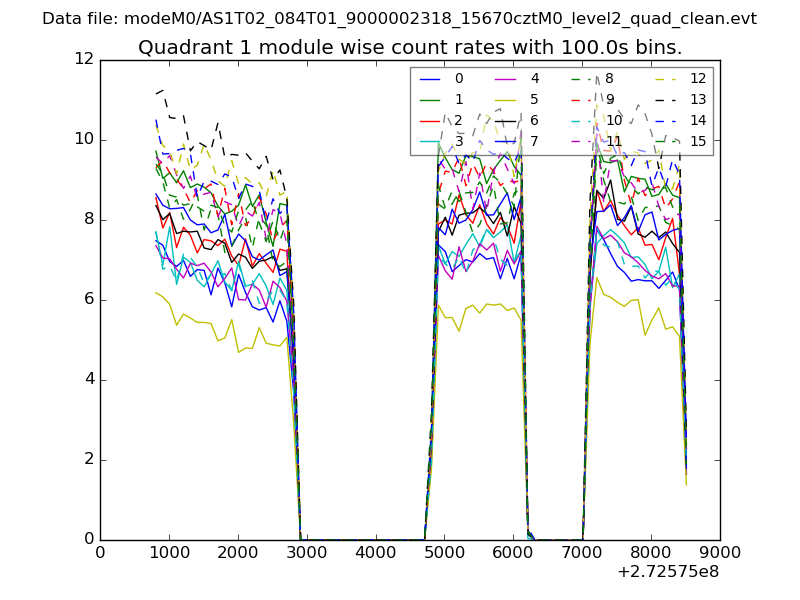
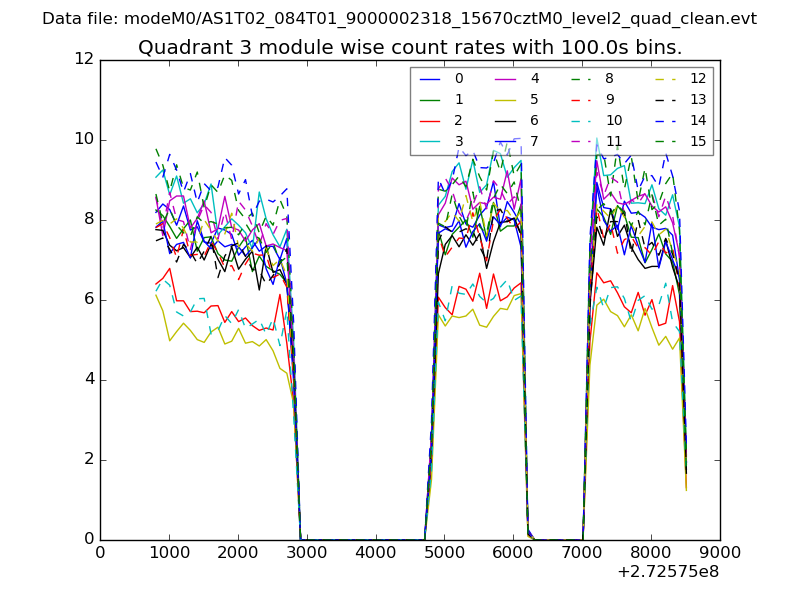
| Module-wise count rates for Quadrant A Data is divided into 100 sec bins |
 |
 |
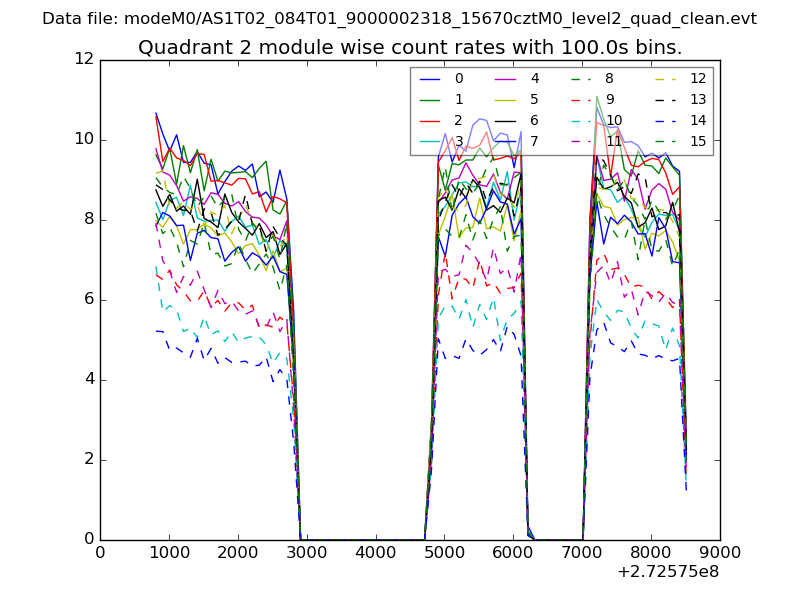
| Module-wise count rates for Quadrant B Data is divided into 100 sec bins |
 |
 |
| Module-wise count rates for Quadrant C Data is divided into 100 sec bins |
 |
 |
| Module-wise count rates for Quadrant D Data is divided into 100 sec bins |
 |
 |
| Parameter | Plot |
|---|---|
| CZT HV Monitor | 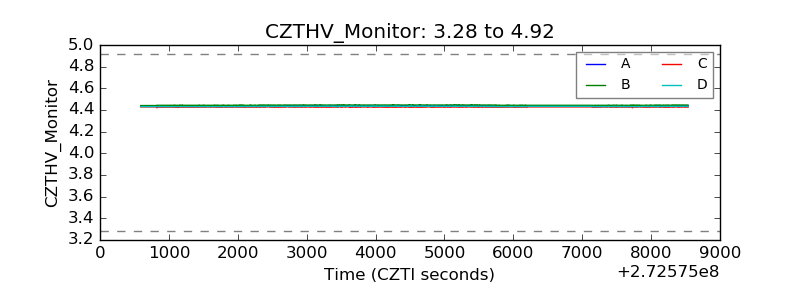 |
| D_VDD | 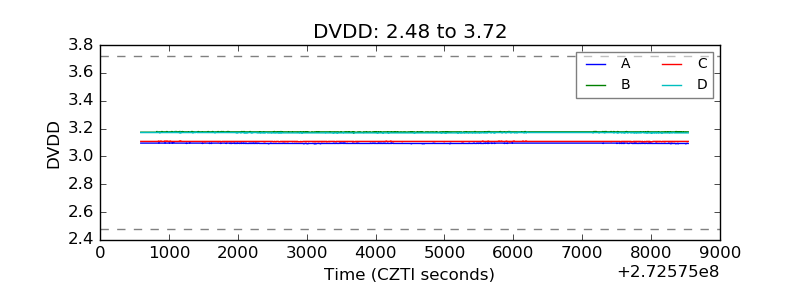 |
| Temperature 1 |  |
| Veto HV Monitor | 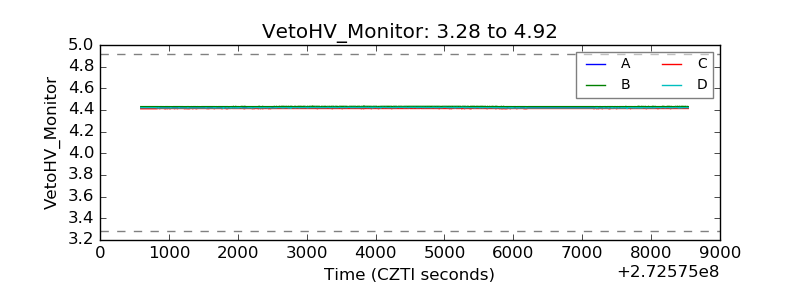 |
| Veto LLD | 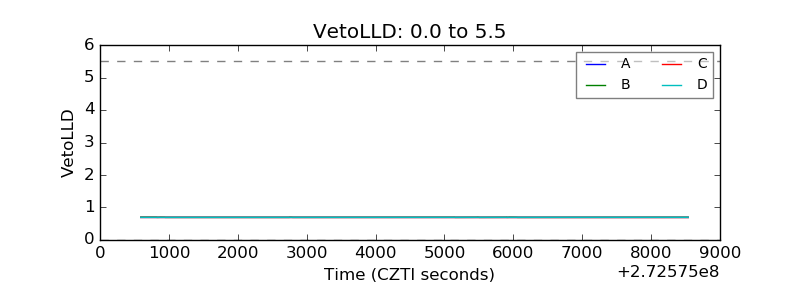 |
| Alpha Counter | 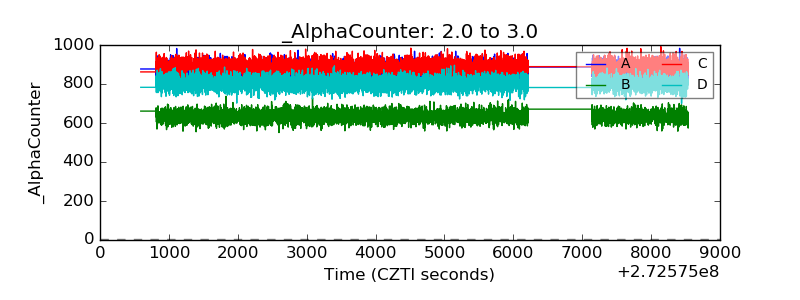 |
| _CPM_Rate | 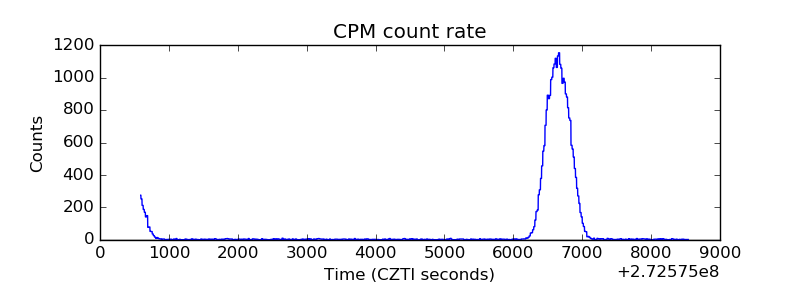 |
| CZT Counter | 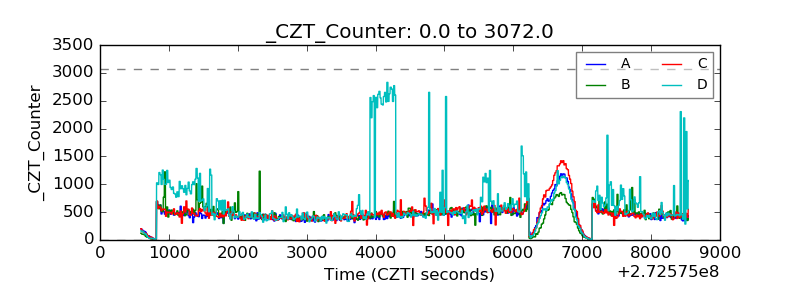 |
| +2.5 Volts monitor |  |
| +5 Volts monitor |  |
| _ROLL_ROT | 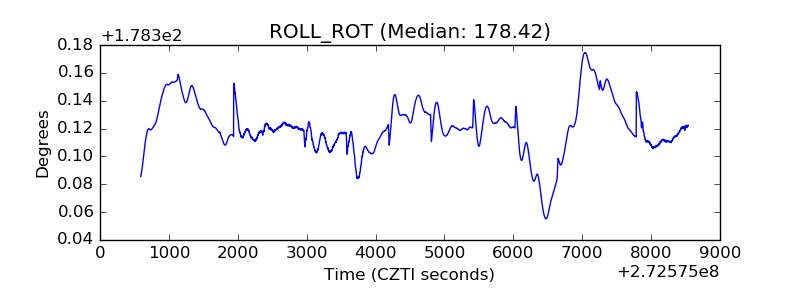 |
| _Roll_DEC |  |
| _Roll_RA | 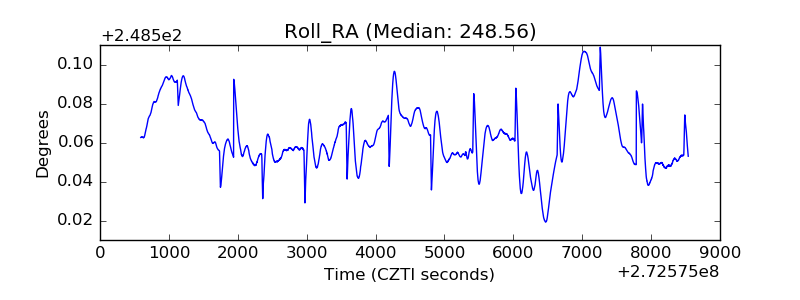 |
| Veto Counter | 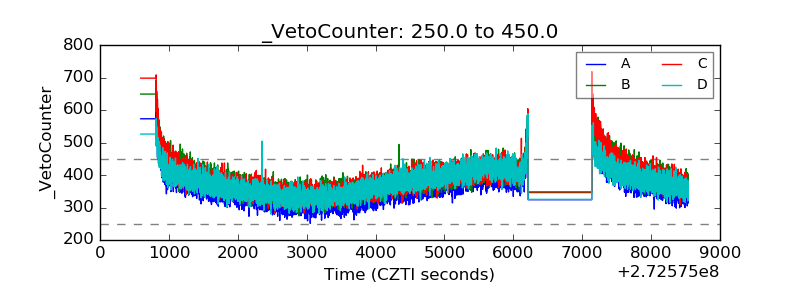 |