| Param | Original file | Final file |
|---|---|---|
| Filename | modeM0/AS1T02_084T01_9000002318_15671cztM0_level2.evt | modeM0/AS1T02_084T01_9000002318_15671cztM0_level2_quad_clean.evt |
| Size (bytes) | 438,736,320 | 90,120,960 |
| Size | 418.4 MB | 85.9 MB |
| Events in quadrant A | 3,025,962 | 576,723 |
| Events in quadrant B | 3,226,848 | 586,336 |
| Events in quadrant C | 3,060,207 | 566,883 |
| Events in quadrant D | 3,537,231 | 550,947 |
| Mode M0 | |||
|---|---|---|---|
| Quadrant | BADHDUFLAG | Total packets | Discarded packets |
| A | 0 | 13303 | 3 |
| B | 0 | 13720 | 2 |
| C | 0 | 13180 | 2 |
| D | 0 | 14881 | 2 |
| Mode M9 | |||
|---|---|---|---|
| Quadrant | BADHDUFLAG | Total packets | Discarded packets |
| A | 0 | 19 | 0 |
| B | 0 | 19 | 0 |
| C | 0 | 19 | 0 |
| D | 0 | 19 | 0 |
| Mode SS | |||
|---|---|---|---|
| Quadrant | BADHDUFLAG | Total packets | Discarded packets |
| A | 0 | 130 | 0 |
| B | 0 | 130 | 0 |
| C | 0 | 130 | 0 |
| D | 0 | 130 | 0 |
| Quadrant | Total seconds | Saturated seconds | Saturation percentage |
|---|---|---|---|
| A | 6428 | 48 | 0.746733% |
| B | 6428 | 28 | 0.435594% |
| C | 6428 | 48 | 0.746733% |
| D | 6428 | 121 | 1.882390% |
Noise dominated data is calculated using 1-second bins in cleaned event files. If a bin has >2000 counts, and if more than 50% of those come from <1% of pixels, then it is considered to be noise-dominated and hence unusable.
| Quadrant | # 1 sec bins | Bins with >0 counts | Bins with >2000 counts | High rate bins dominated by noise | Noise dominated (total time) | Noise dominated (detector-on time) | Marked lightcurve |
|---|---|---|---|---|---|---|---|
| A | 7489 | 6430 | 17 | 17 | 0.23% | 0.26% | 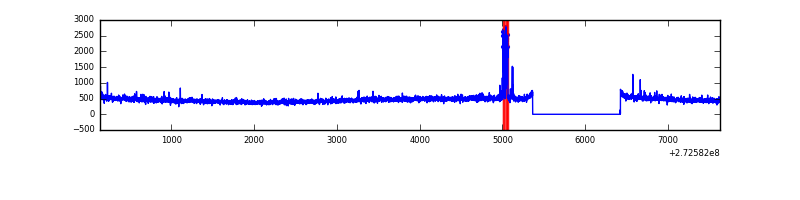 |
| B | 7489 | 6430 | 2 | 2 | 0.03% | 0.03% | 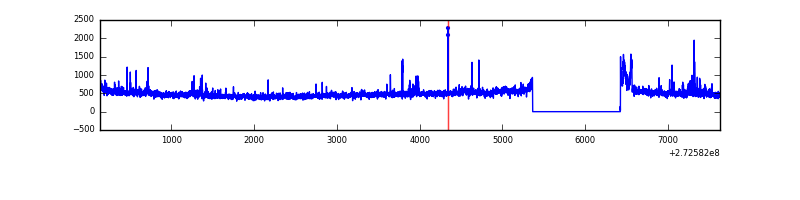 |
| C | 7489 | 6430 | 0 | 0 | 0.00% | 0.00% | 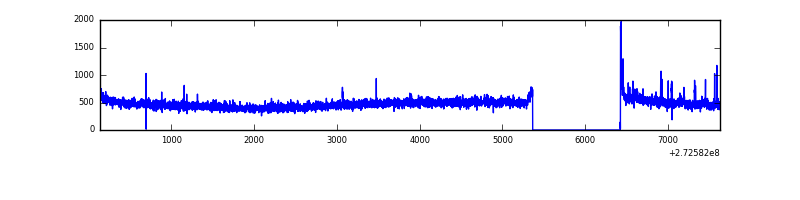 |
| D | 7489 | 6430 | 139 | 139 | 1.86% | 2.16% | 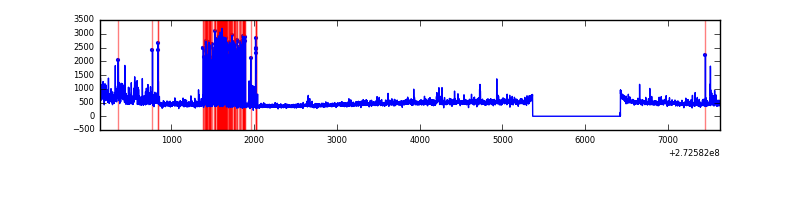 |
Top three noisy pixels from each quadrant. If the there are fewer than three noisy pixels in the level2.evt file, extra rows are filled as -1
| Pixel properties | Quadrant properties | ||||||
|---|---|---|---|---|---|---|---|
| Quadrant | DetID | PixID | Counts | Sigma | Mean | Median | Sigma |
| A | 13 | 248 | 88369 | 572.43 | 760 | 746 | 153.1 |
| A | 13 | 210 | 9655 | 58.2 | 760 | 746 | 153.1 |
| A | 0 | 226 | 6727 | 39.07 | 760 | 746 | 153.1 |
| B | 0 | 189 | 74556 | 506.25 | 766 | 746 | 145.8 |
| B | 4 | 173 | 47746 | 322.36 | 766 | 746 | 145.8 |
| B | 4 | 80 | 44707 | 301.52 | 766 | 746 | 145.8 |
| C | 14 | 238 | 114155 | 667.82 | 731 | 736 | 169.8 |
| C | 3 | 233 | 84151 | 491.15 | 731 | 736 | 169.8 |
| C | 0 | 207 | 7101 | 37.47 | 731 | 736 | 169.8 |
| D | 1 | 52 | 688994 | 3851.52 | 731 | 710 | 178.7 |
| D | 2 | 234 | 27208 | 148.28 | 731 | 710 | 178.7 |
| D | 2 | 120 | 24814 | 134.88 | 731 | 710 | 178.7 |
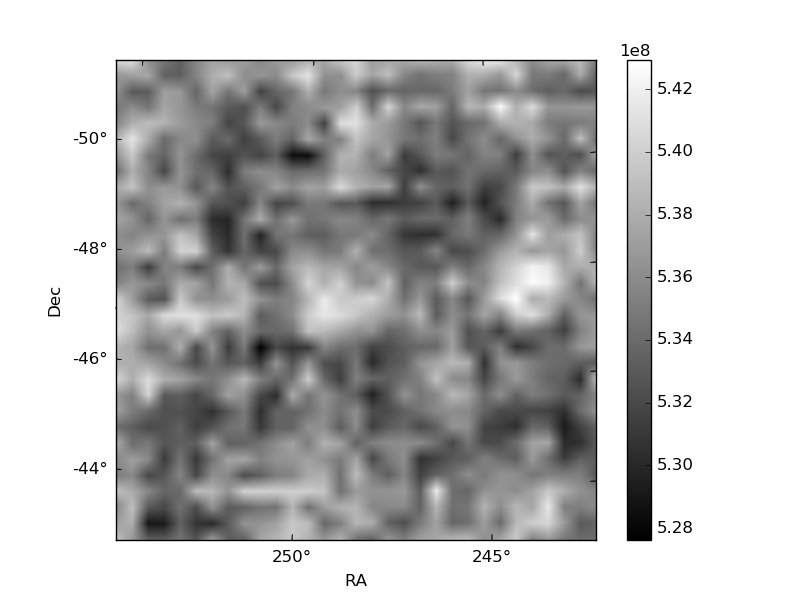
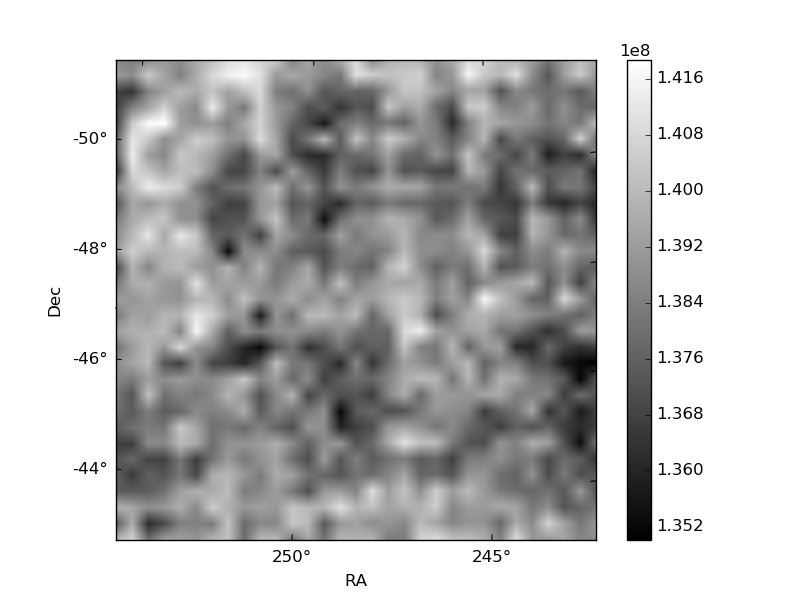
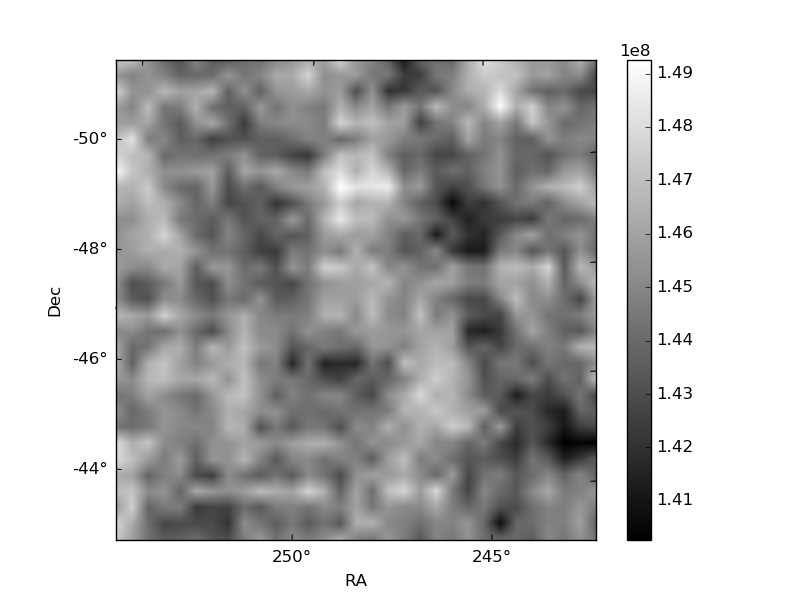
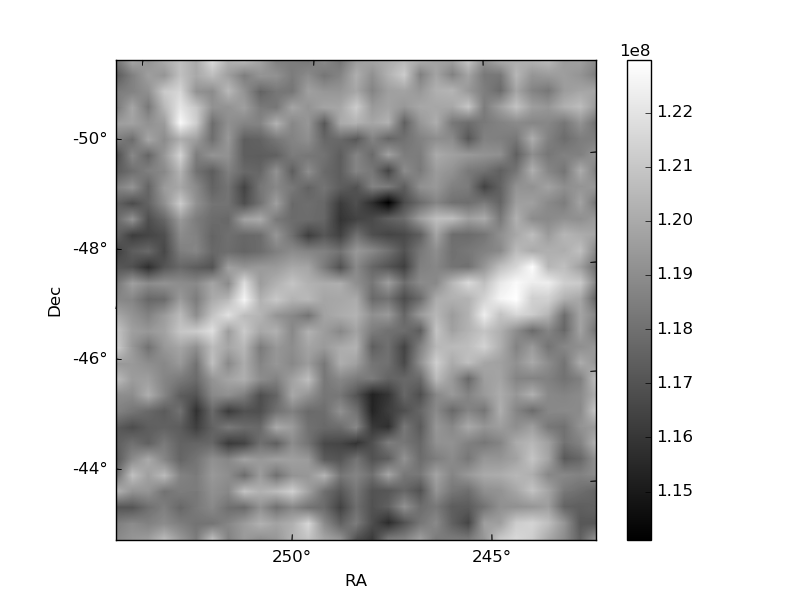
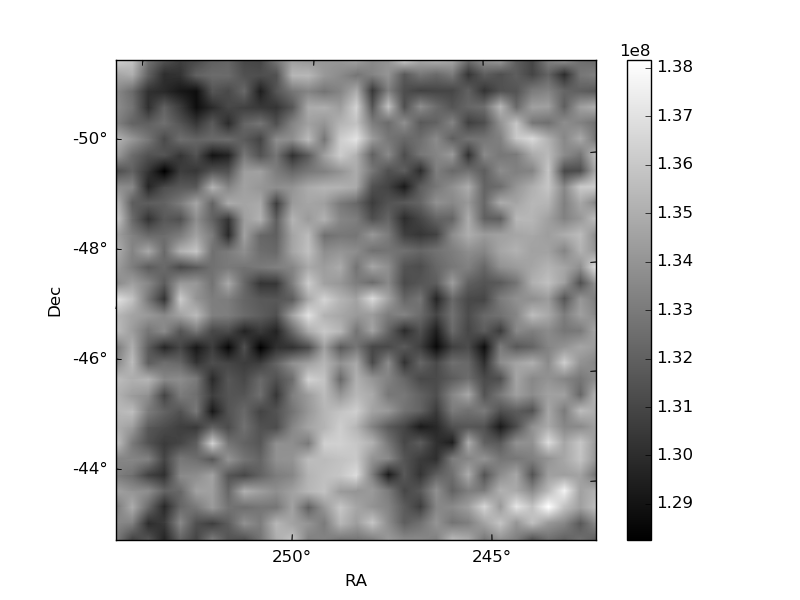
Histogram calculated using DETX and DETY for each event in the final _common_clean file
| Quadrant A | 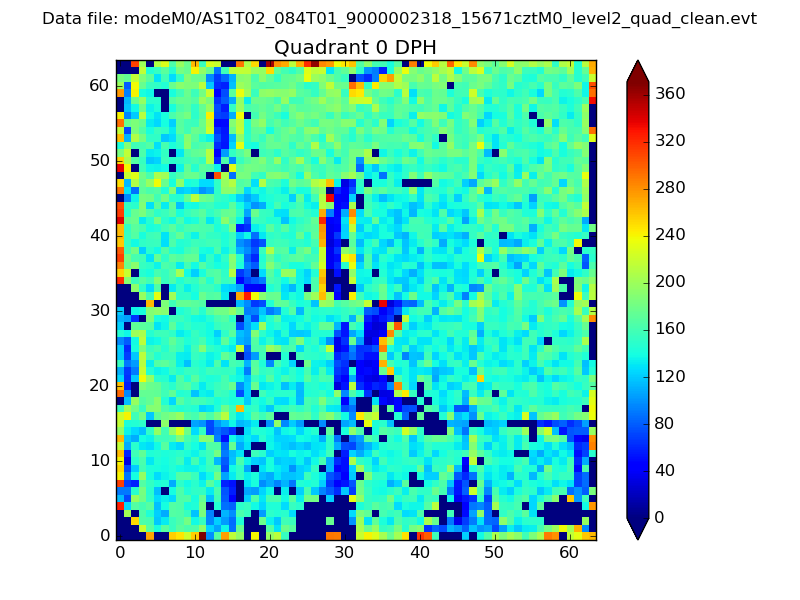 |
 |
Quadrant B |
|---|---|---|---|
| Quadrant D | 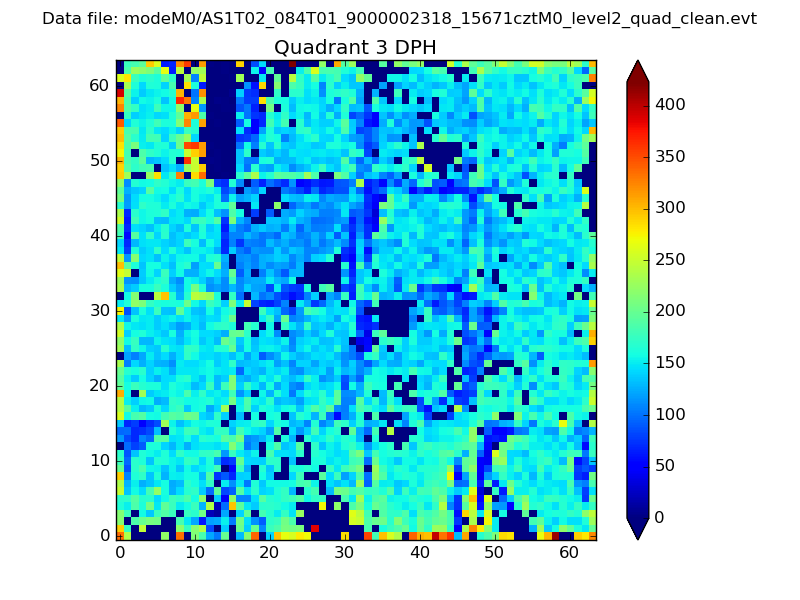 |
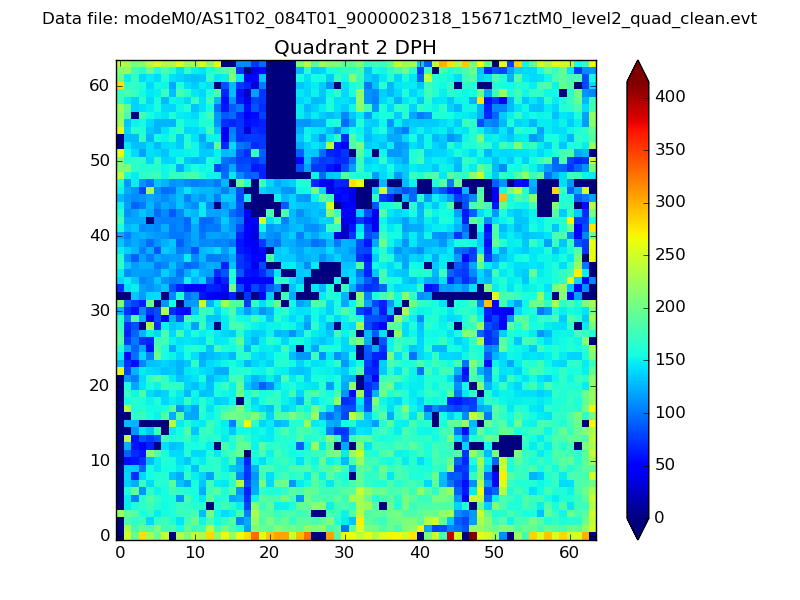 |
Quadrant C |
| Plot type | Count rate plots | Images |
|---|---|---|
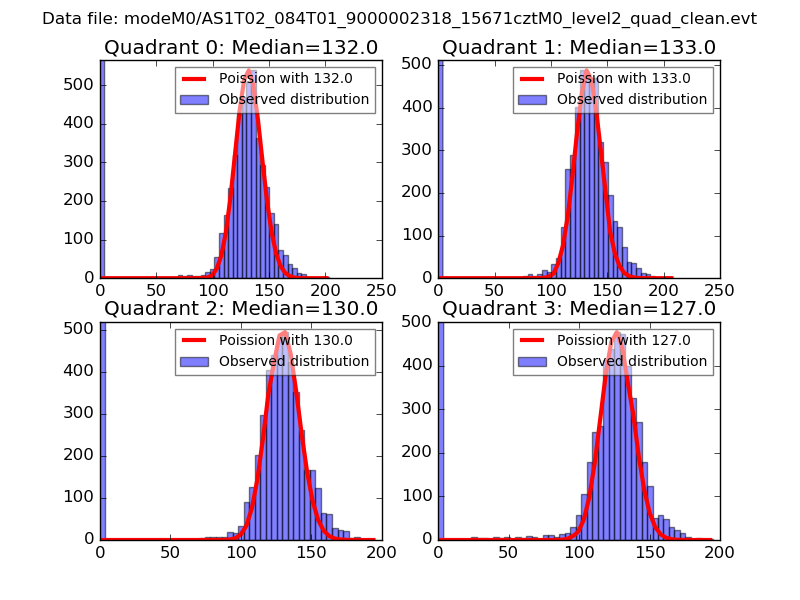
| Comparison with Poisson distribution Blue bars denote a histogram of data divided into 1 sec bins. Red curve is a Poisson curve with rate = median count rate of data. |
 |
 |
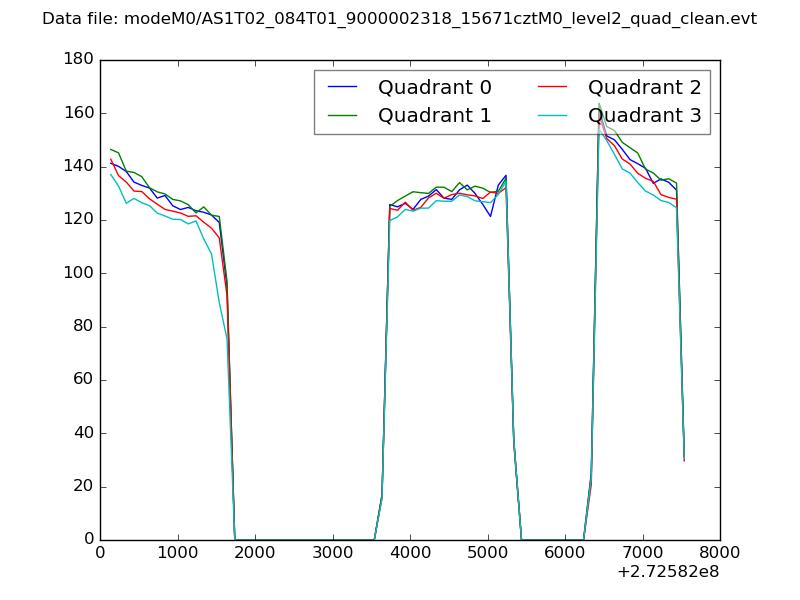
| Quadrant-wise count rates Data is divided into 100 sec bins |
 |
|
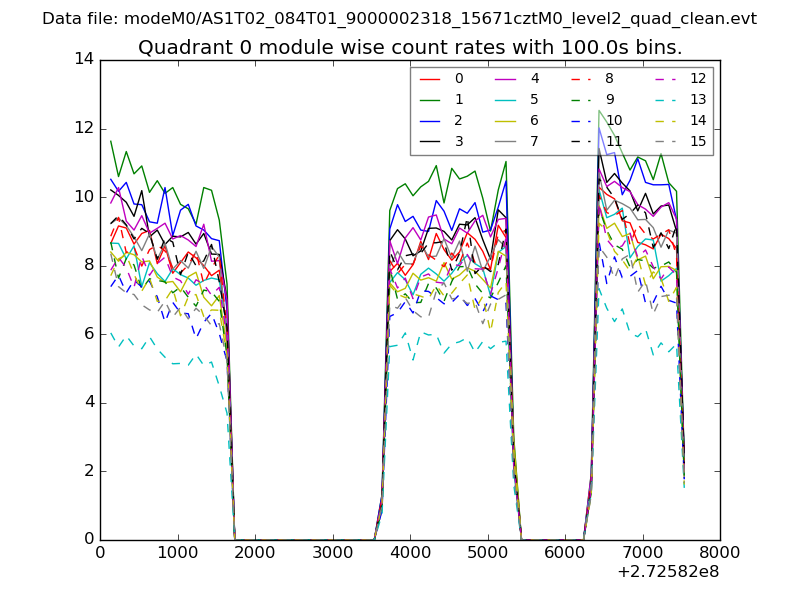
| Module-wise count rates for Quadrant A Data is divided into 100 sec bins |
 |
 |
| Module-wise count rates for Quadrant B Data is divided into 100 sec bins |
 |
 |
| Module-wise count rates for Quadrant C Data is divided into 100 sec bins |
 |
 |
| Module-wise count rates for Quadrant D Data is divided into 100 sec bins |
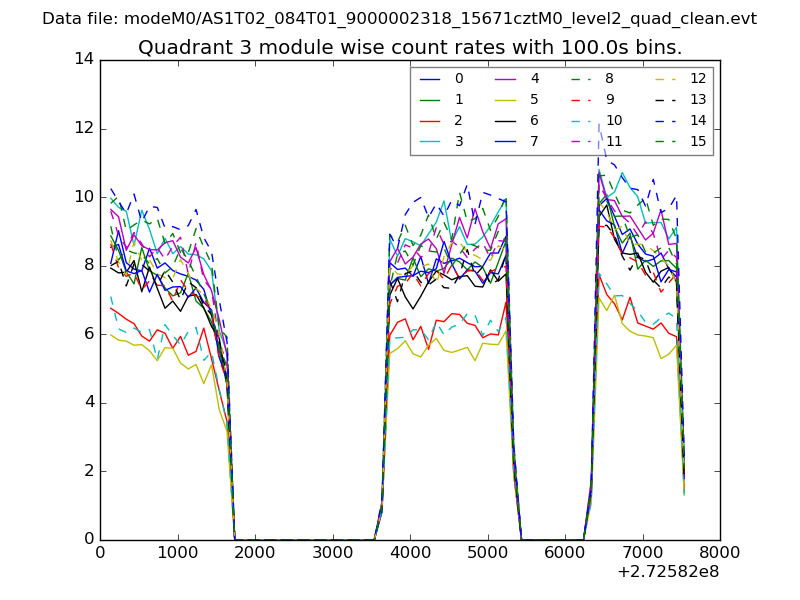 |
 |
| Parameter | Plot |
|---|---|
| CZT HV Monitor | 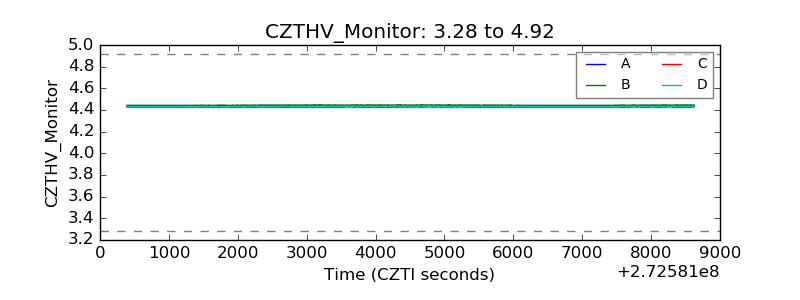 |
| D_VDD | 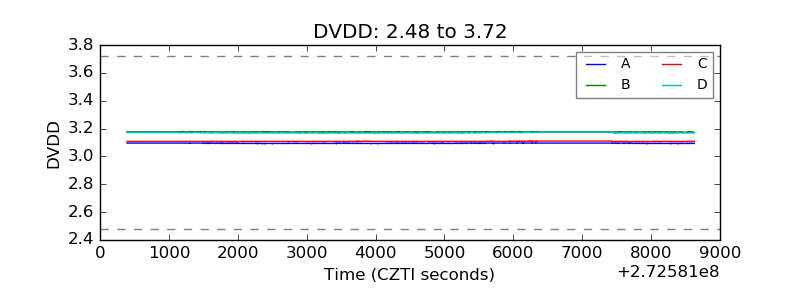 |
| Temperature 1 |  |
| Veto HV Monitor | 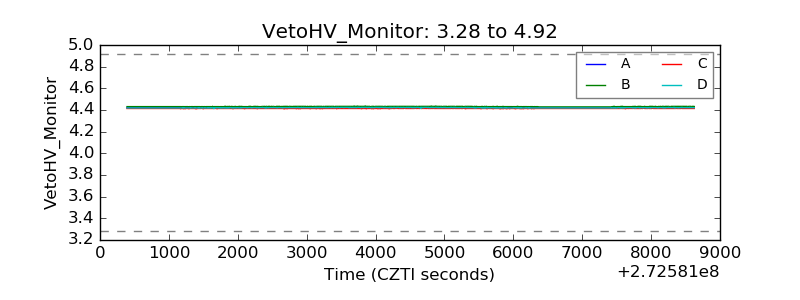 |
| Veto LLD | 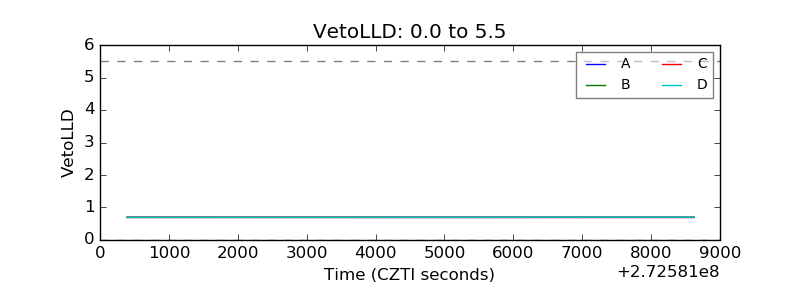 |
| Alpha Counter | 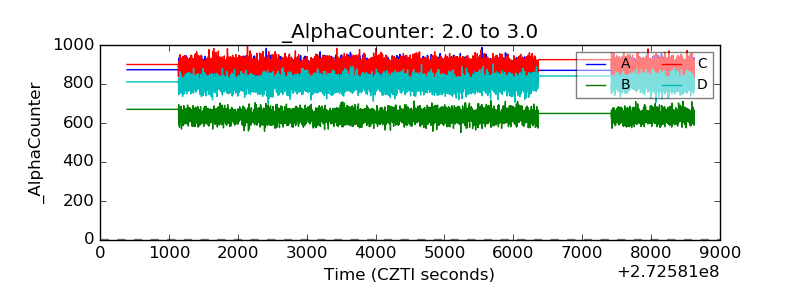 |
| _CPM_Rate | 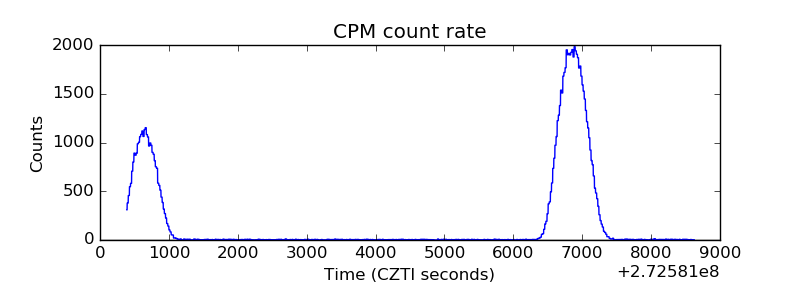 |
| CZT Counter |  |
| +2.5 Volts monitor |  |
| +5 Volts monitor | 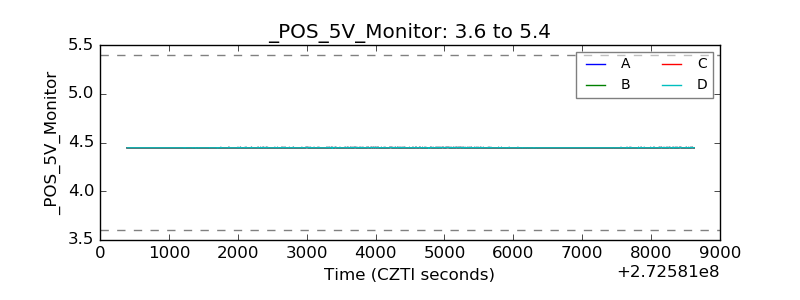 |
| _ROLL_ROT | 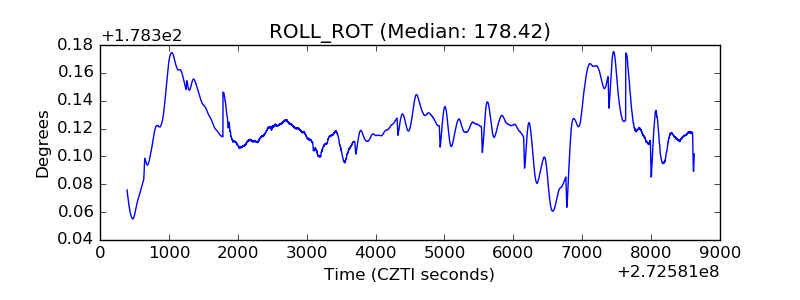 |
| _Roll_DEC | 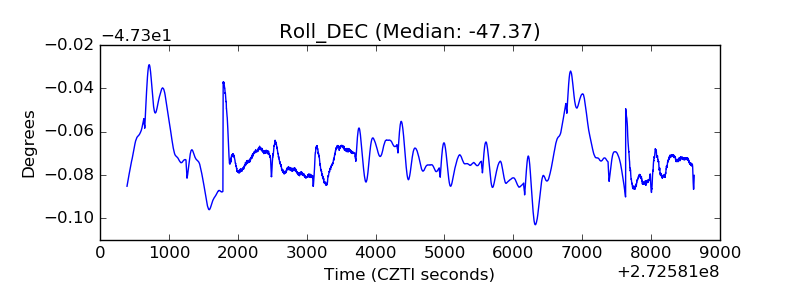 |
| _Roll_RA |  |
| Veto Counter | 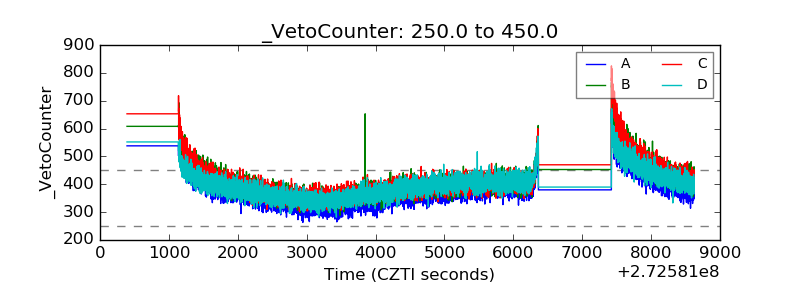 |