| Param | Original file | Final file |
|---|---|---|
| Filename | modeM0/AS1T02_084T01_9000002318_15673cztM0_level2.evt | modeM0/AS1T02_084T01_9000002318_15673cztM0_level2_quad_clean.evt |
| Size (bytes) | 465,831,360 | 88,332,480 |
| Size | 444.3 MB | 84.2 MB |
| Events in quadrant A | 3,214,646 | 554,072 |
| Events in quadrant B | 3,433,436 | 565,139 |
| Events in quadrant C | 3,459,872 | 547,262 |
| Events in quadrant D | 3,538,763 | 535,677 |
| Mode M0 | |||
|---|---|---|---|
| Quadrant | BADHDUFLAG | Total packets | Discarded packets |
| A | 0 | 13937 | 3 |
| B | 0 | 14494 | 2 |
| C | 0 | 14442 | 2 |
| D | 0 | 14874 | 2 |
| Mode M9 | |||
|---|---|---|---|
| Quadrant | BADHDUFLAG | Total packets | Discarded packets |
| A | 0 | 23 | 0 |
| B | 0 | 23 | 0 |
| C | 0 | 23 | 0 |
| D | 0 | 23 | 0 |
| Mode SS | |||
|---|---|---|---|
| Quadrant | BADHDUFLAG | Total packets | Discarded packets |
| A | 0 | 140 | 0 |
| B | 0 | 140 | 0 |
| C | 0 | 140 | 0 |
| D | 0 | 140 | 0 |
| Quadrant | Total seconds | Saturated seconds | Saturation percentage |
|---|---|---|---|
| A | 6784 | 29 | 0.427476% |
| B | 6784 | 43 | 0.633844% |
| C | 6784 | 85 | 1.252948% |
| D | 6784 | 76 | 1.120283% |
Noise dominated data is calculated using 1-second bins in cleaned event files. If a bin has >2000 counts, and if more than 50% of those come from <1% of pixels, then it is considered to be noise-dominated and hence unusable.
| Quadrant | # 1 sec bins | Bins with >0 counts | Bins with >2000 counts | High rate bins dominated by noise | Noise dominated (total time) | Noise dominated (detector-on time) | Marked lightcurve |
|---|---|---|---|---|---|---|---|
| A | 9035 | 6787 | 3 | 3 | 0.03% | 0.04% | 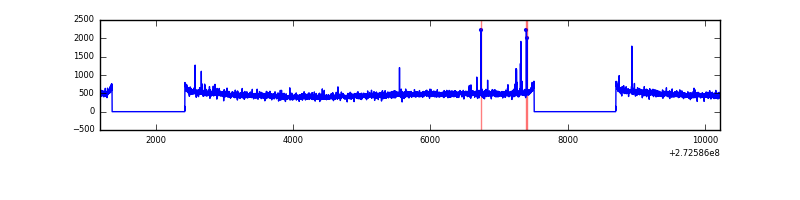 |
| B | 9035 | 6787 | 0 | 0 | 0.00% | 0.00% | 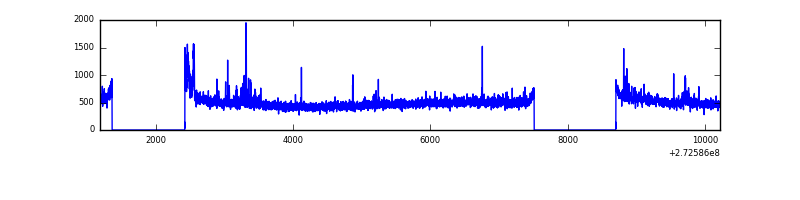 |
| C | 9035 | 6787 | 20 | 20 | 0.22% | 0.29% | 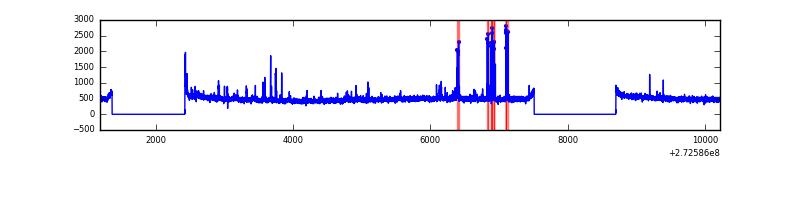 |
| D | 9035 | 6787 | 59 | 59 | 0.65% | 0.87% | 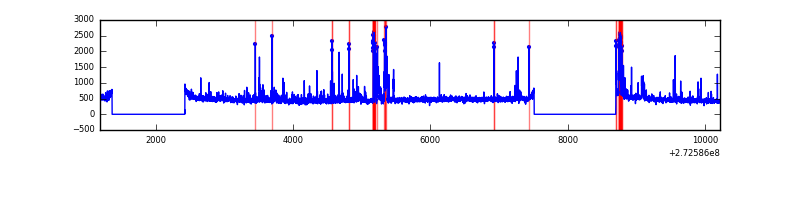 |
Top three noisy pixels from each quadrant. If the there are fewer than three noisy pixels in the level2.evt file, extra rows are filled as -1
| Pixel properties | Quadrant properties | ||||||
|---|---|---|---|---|---|---|---|
| Quadrant | DetID | PixID | Counts | Sigma | Mean | Median | Sigma |
| A | 13 | 248 | 20385 | 117.34 | 828 | 811 | 166.8 |
| A | 9 | 143 | 8695 | 47.26 | 828 | 811 | 166.8 |
| A | 0 | 226 | 7302 | 38.91 | 828 | 811 | 166.8 |
| B | 0 | 189 | 57395 | 360.66 | 835 | 814 | 156.9 |
| B | 4 | 80 | 44354 | 277.53 | 835 | 814 | 156.9 |
| B | 4 | 216 | 26642 | 164.63 | 835 | 814 | 156.9 |
| C | 14 | 238 | 125897 | 678.06 | 800 | 807 | 184.5 |
| C | 0 | 207 | 115999 | 624.4 | 800 | 807 | 184.5 |
| C | 3 | 233 | 98140 | 527.6 | 800 | 807 | 184.5 |
| D | 1 | 52 | 390134 | 1832.3 | 796 | 781 | 212.5 |
| D | 10 | 70 | 49399 | 228.8 | 796 | 781 | 212.5 |
| D | 2 | 120 | 25799 | 117.73 | 796 | 781 | 212.5 |
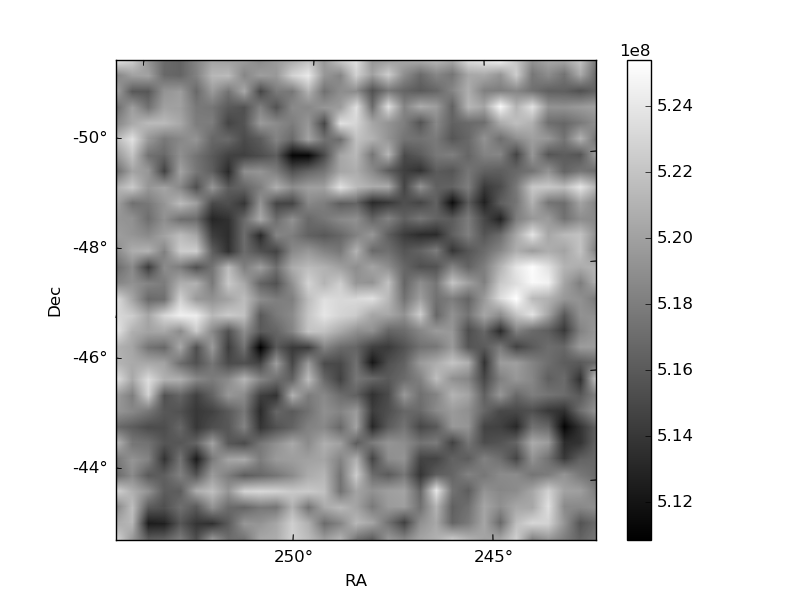
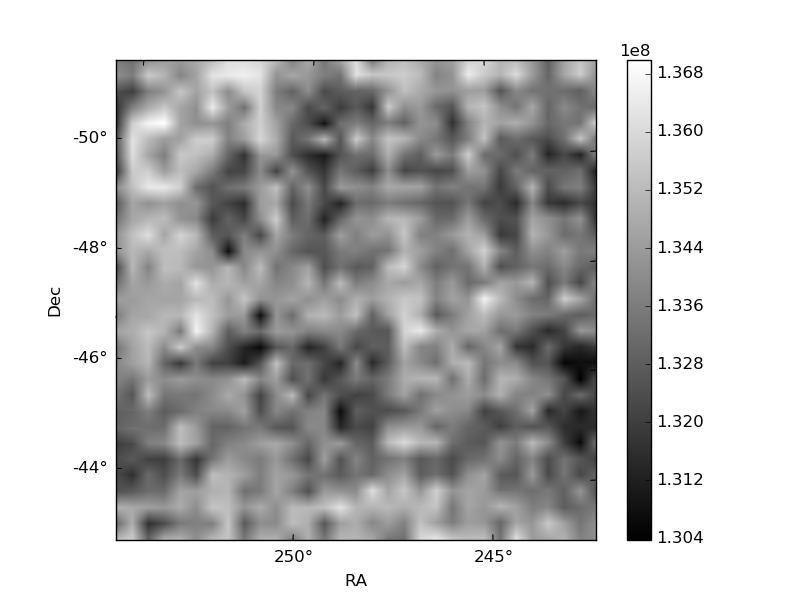
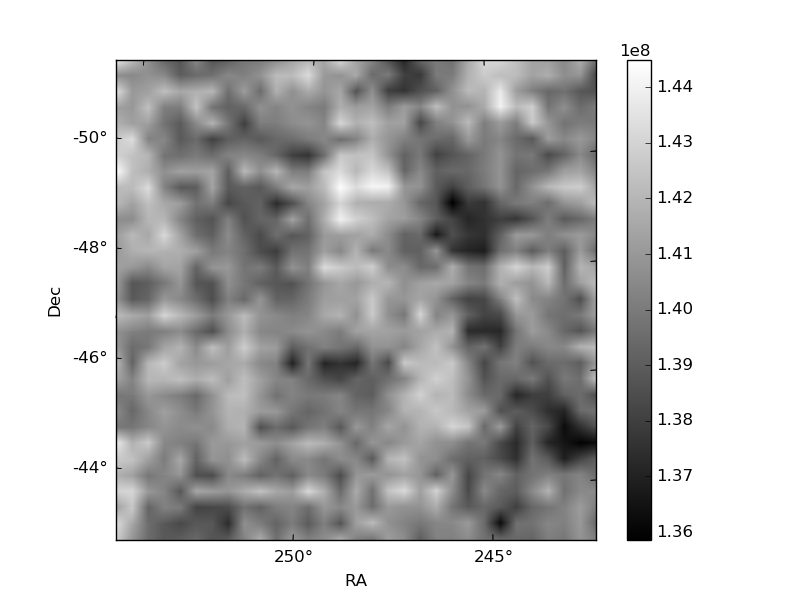
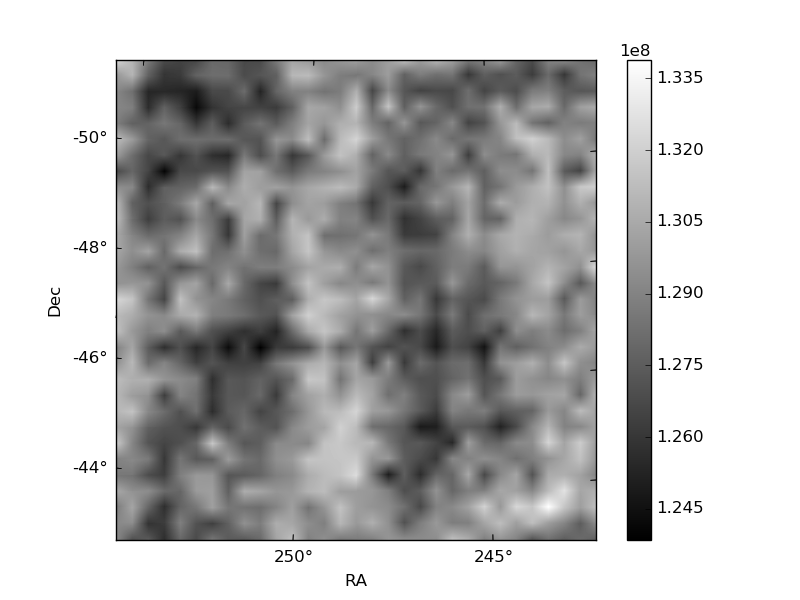
Histogram calculated using DETX and DETY for each event in the final _common_clean file
| Quadrant A | 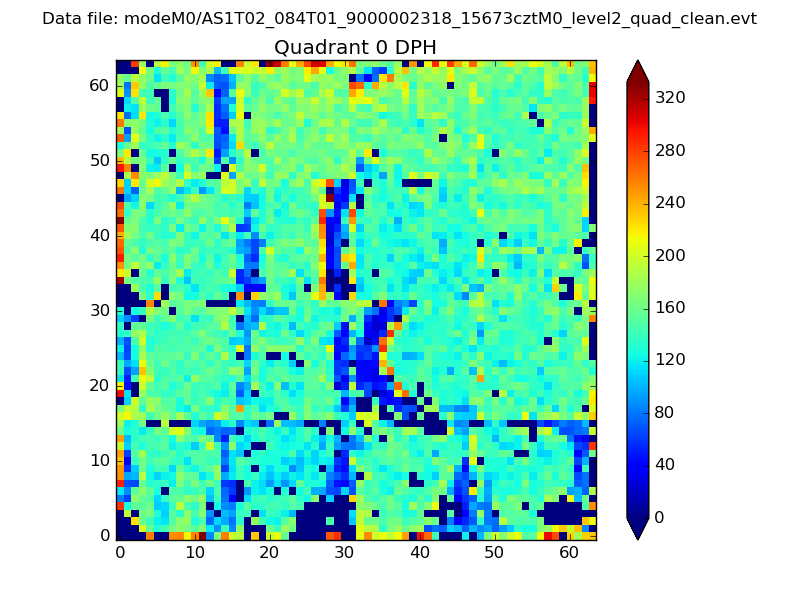 |
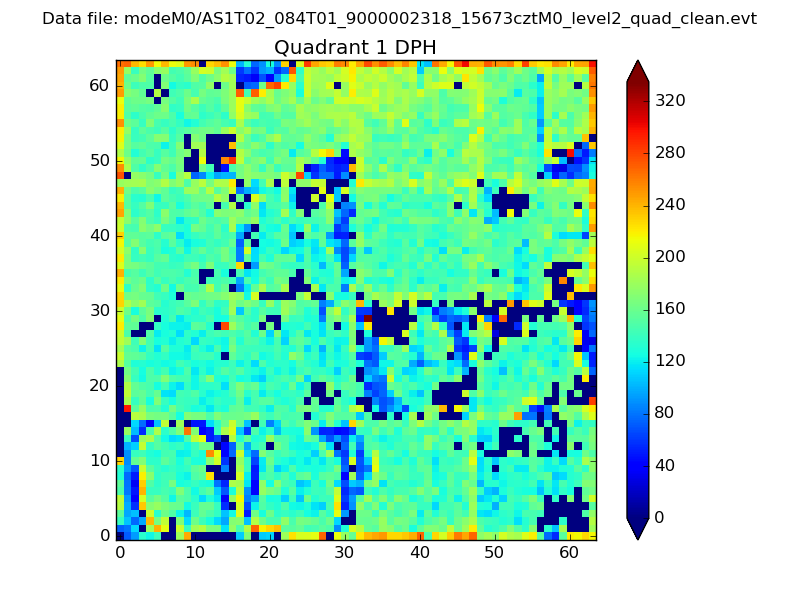 |
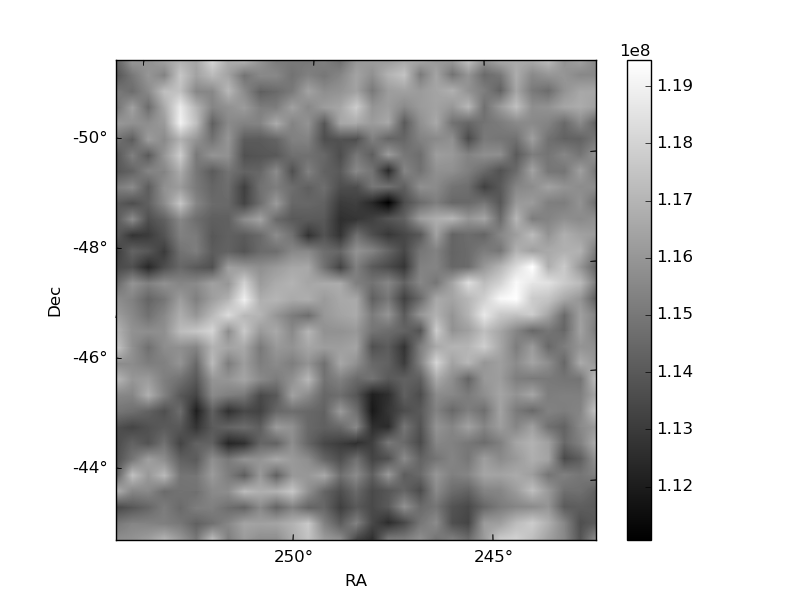
Quadrant B |
|---|---|---|---|
| Quadrant D | 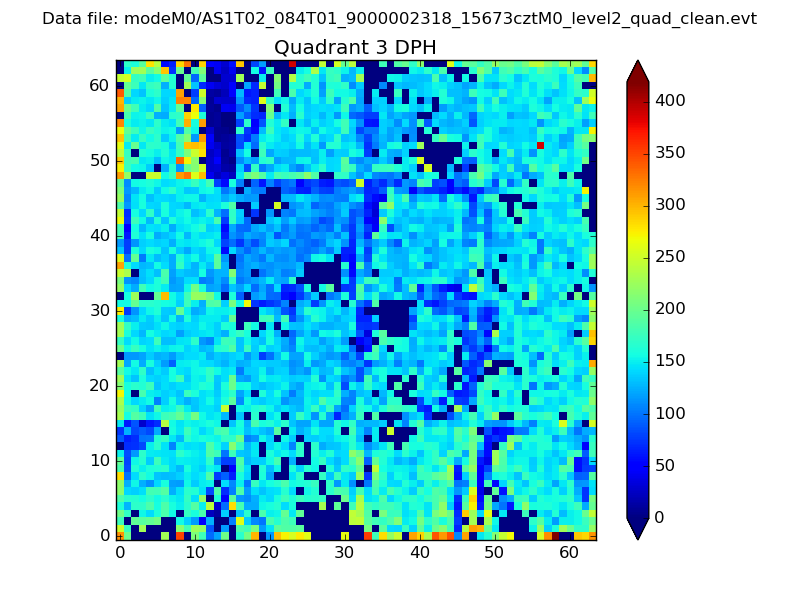 |
 |
Quadrant C |
| Plot type | Count rate plots | Images |
|---|---|---|
| Comparison with Poisson distribution Blue bars denote a histogram of data divided into 1 sec bins. Red curve is a Poisson curve with rate = median count rate of data. |
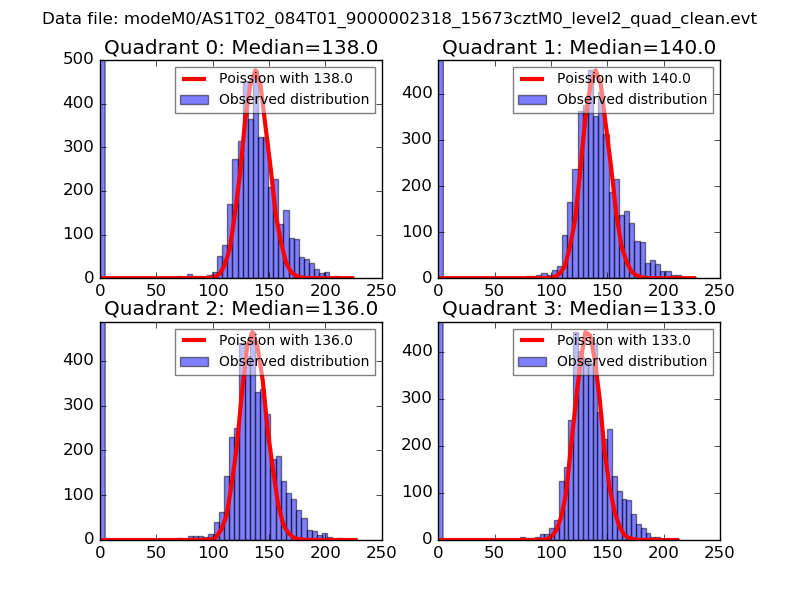 |
 |
| Quadrant-wise count rates Data is divided into 100 sec bins |
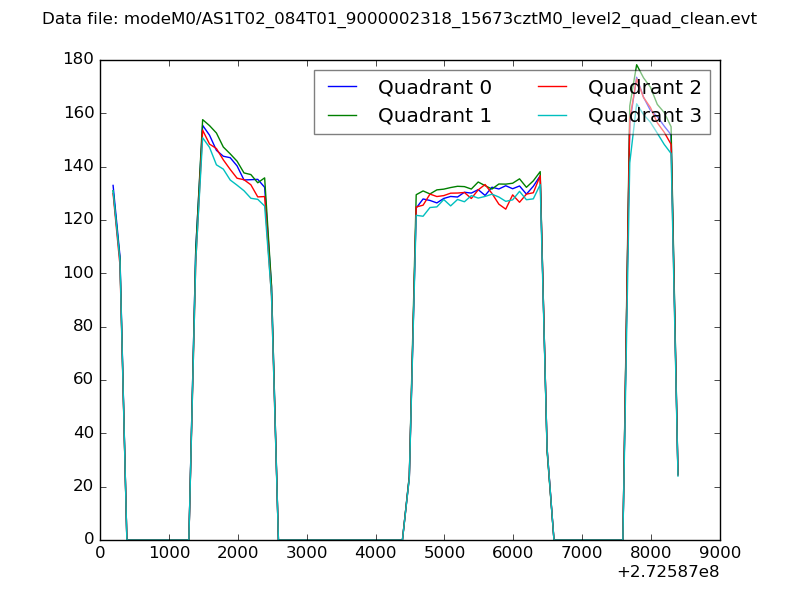 |
|
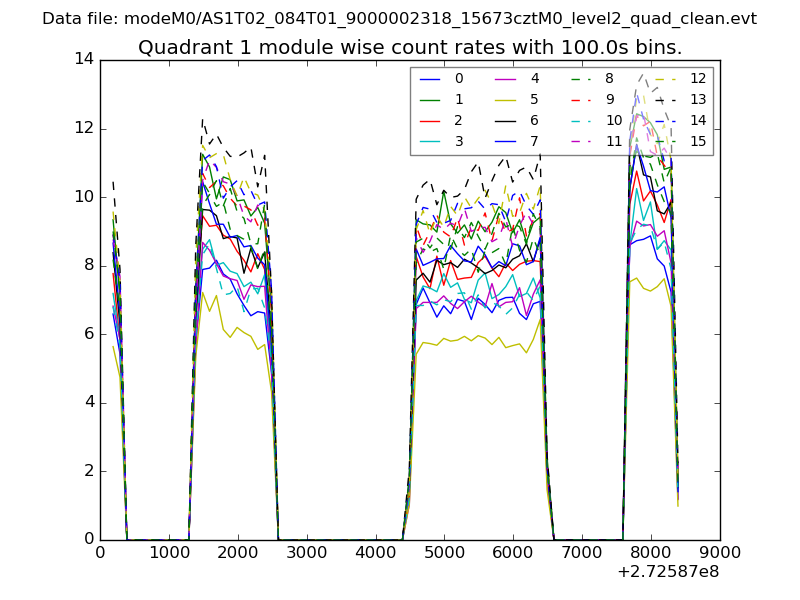
| Module-wise count rates for Quadrant A Data is divided into 100 sec bins |
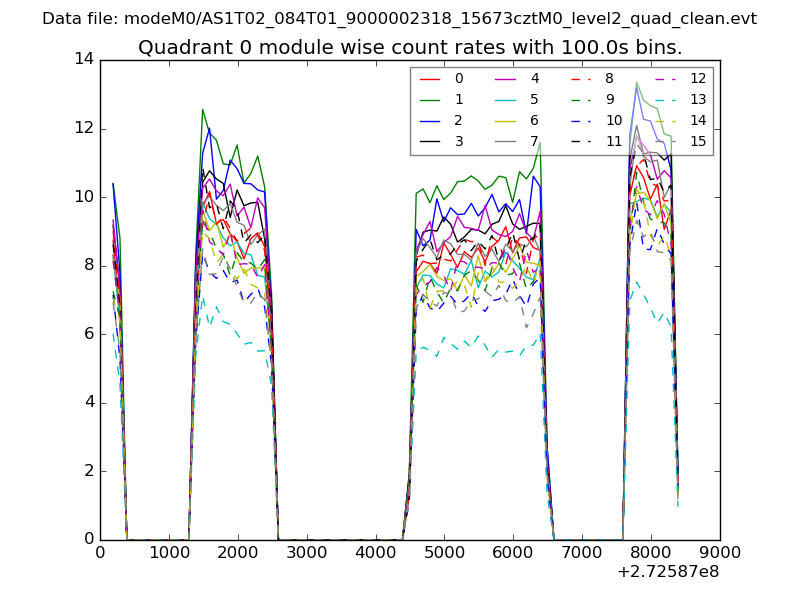 |
 |
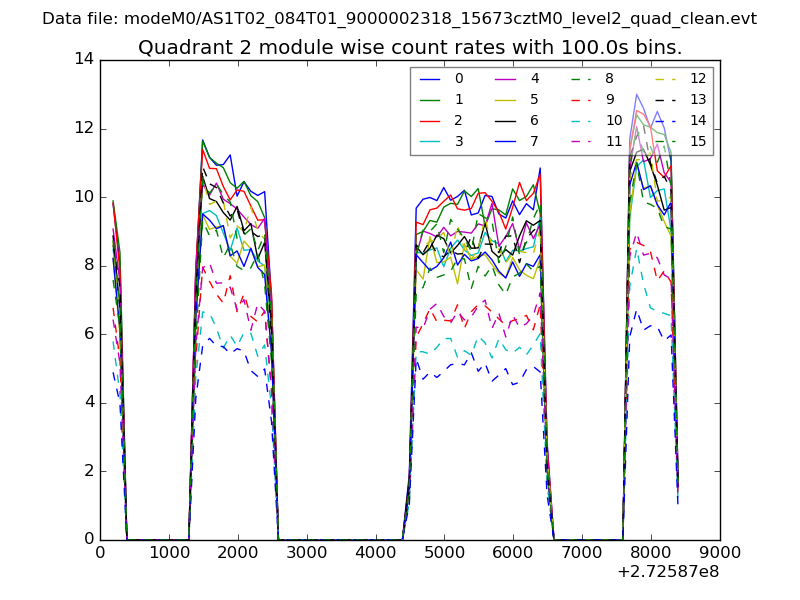
| Module-wise count rates for Quadrant B Data is divided into 100 sec bins |
 |
 |
| Module-wise count rates for Quadrant C Data is divided into 100 sec bins |
 |
 |
| Module-wise count rates for Quadrant D Data is divided into 100 sec bins |
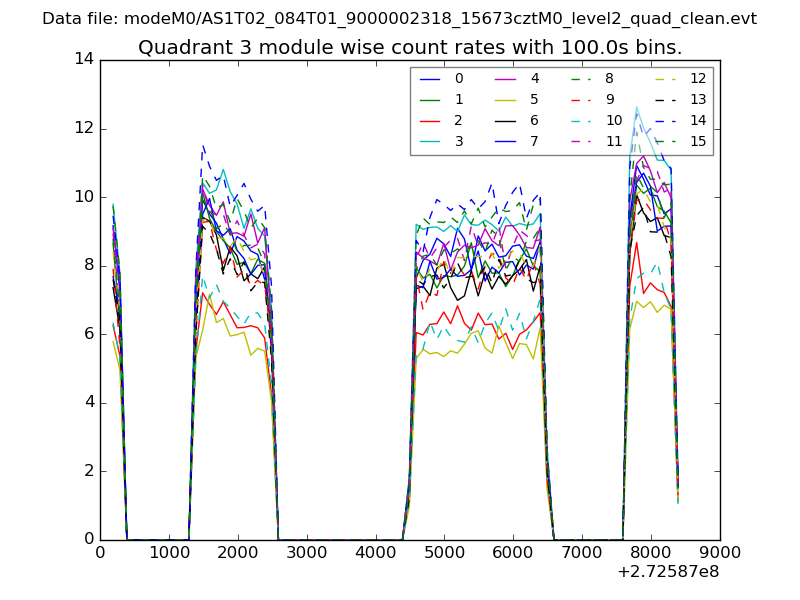 |
 |
| Parameter | Plot |
|---|---|
| CZT HV Monitor | 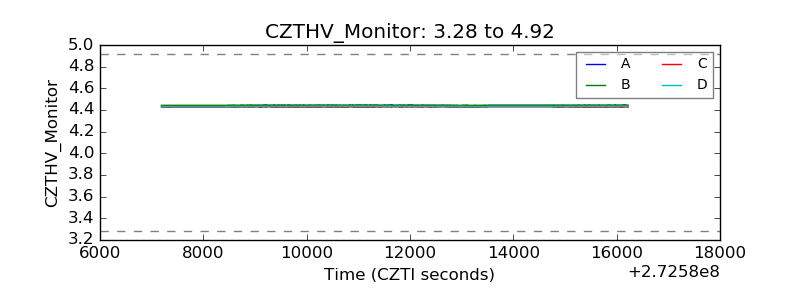 |
| D_VDD | 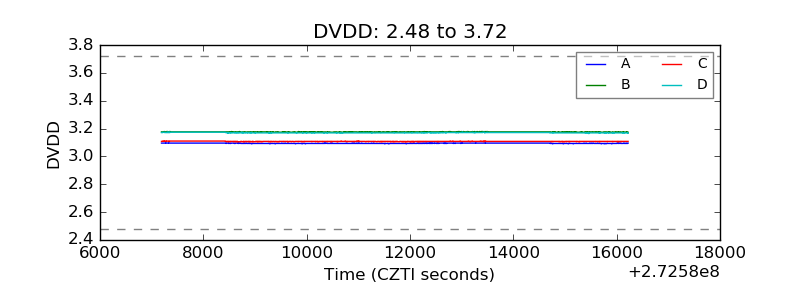 |
| Temperature 1 |  |
| Veto HV Monitor | 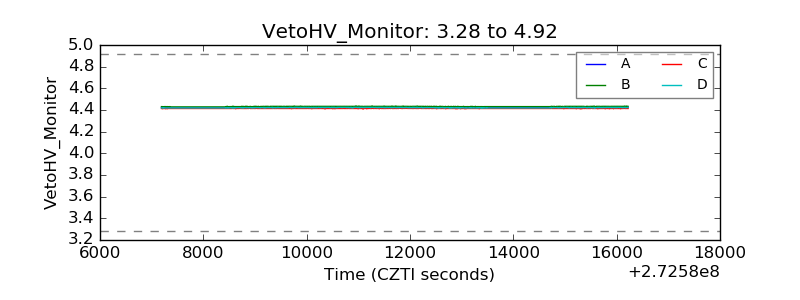 |
| Veto LLD | 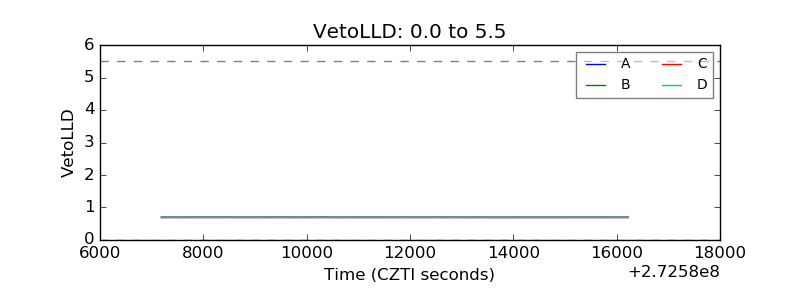 |
| Alpha Counter | 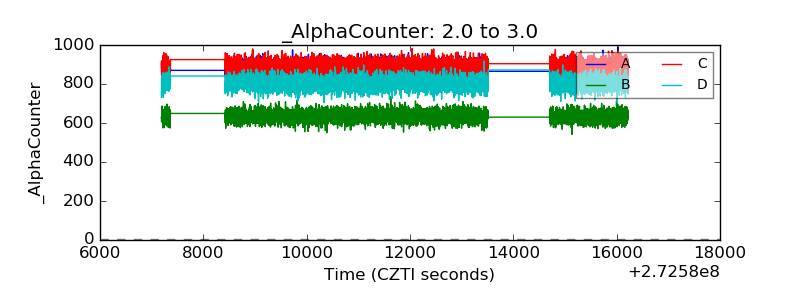 |
| _CPM_Rate | 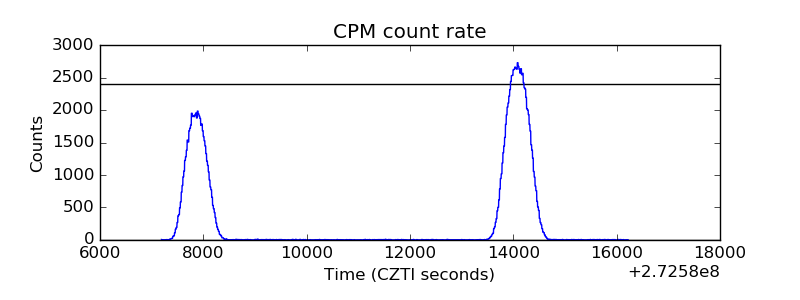 |
| CZT Counter | 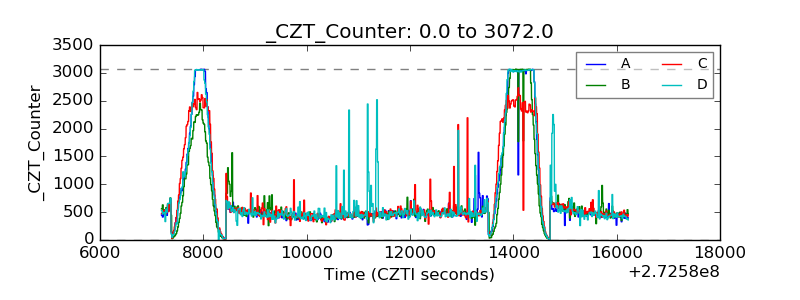 |
| +2.5 Volts monitor |  |
| +5 Volts monitor |  |
| _ROLL_ROT | 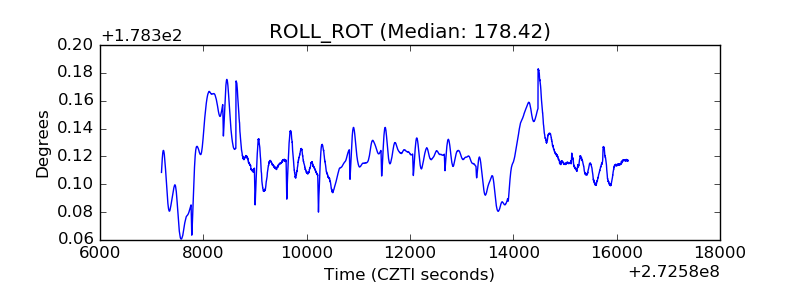 |
| _Roll_DEC | 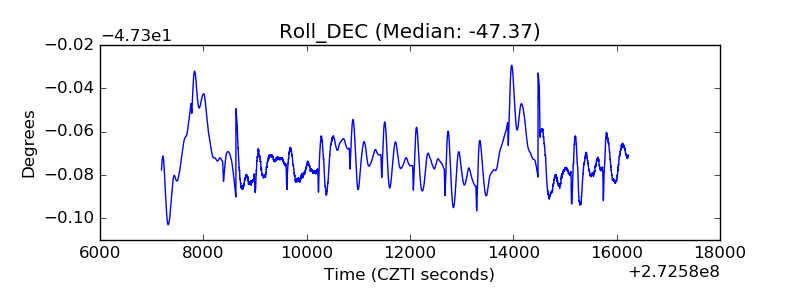 |
| _Roll_RA | 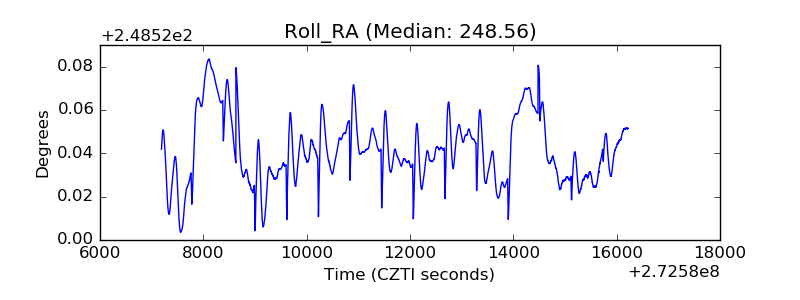 |
| Veto Counter | 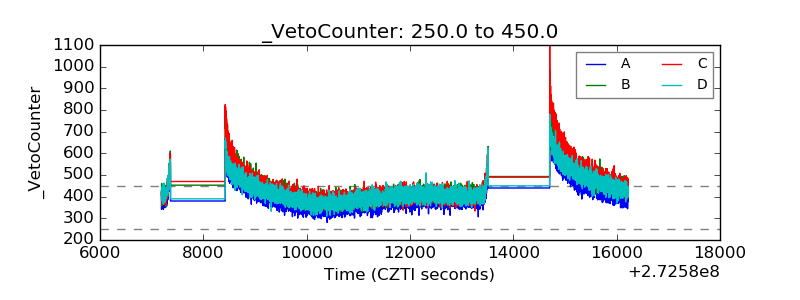 |