| Param | Original file | Final file |
|---|---|---|
| Filename | modeM0/AS1T02_084T01_9000002318_15675cztM0_level2.evt | modeM0/AS1T02_084T01_9000002318_15675cztM0_level2_quad_clean.evt |
| Size (bytes) | 460,805,760 | 68,837,760 |
| Size | 439.5 MB | 65.6 MB |
| Events in quadrant A | 3,178,099 | 414,734 |
| Events in quadrant B | 3,337,602 | 423,205 |
| Events in quadrant C | 3,310,628 | 413,653 |
| Events in quadrant D | 3,704,453 | 396,168 |
| Mode M0 | |||
|---|---|---|---|
| Quadrant | BADHDUFLAG | Total packets | Discarded packets |
| A | 0 | 13087 | 3 |
| B | 0 | 13530 | 2 |
| C | 0 | 13428 | 2 |
| D | 0 | 14742 | 2 |
| Mode M9 | |||
|---|---|---|---|
| Quadrant | BADHDUFLAG | Total packets | Discarded packets |
| A | 0 | 22 | 0 |
| B | 0 | 22 | 0 |
| C | 0 | 22 | 0 |
| D | 0 | 23 | 0 |
| Mode SS | |||
|---|---|---|---|
| Quadrant | BADHDUFLAG | Total packets | Discarded packets |
| A | 0 | 128 | 0 |
| B | 0 | 128 | 0 |
| C | 0 | 128 | 0 |
| D | 0 | 128 | 0 |
| Quadrant | Total seconds | Saturated seconds | Saturation percentage |
|---|---|---|---|
| A | 6249 | 31 | 0.496079% |
| B | 6249 | 71 | 1.136182% |
| C | 6249 | 83 | 1.328213% |
| D | 6249 | 232 | 3.712594% |
Noise dominated data is calculated using 1-second bins in cleaned event files. If a bin has >2000 counts, and if more than 50% of those come from <1% of pixels, then it is considered to be noise-dominated and hence unusable.
| Quadrant | # 1 sec bins | Bins with >0 counts | Bins with >2000 counts | High rate bins dominated by noise | Noise dominated (total time) | Noise dominated (detector-on time) | Marked lightcurve |
|---|---|---|---|---|---|---|---|
| A | 7585 | 6251 | 0 | 0 | 0.00% | 0.00% | 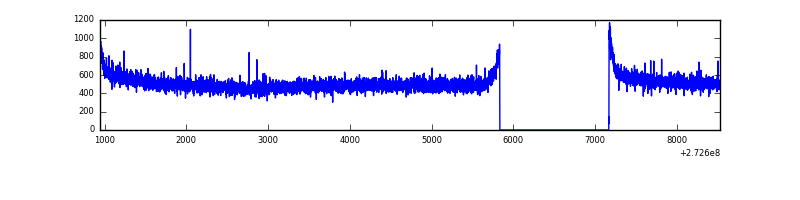 |
| B | 7585 | 6251 | 18 | 18 | 0.24% | 0.29% | 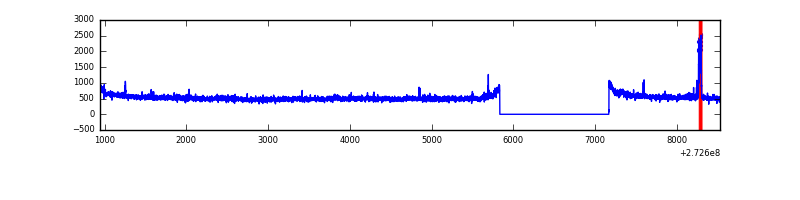 |
| C | 7585 | 6251 | 0 | 0 | 0.00% | 0.00% | 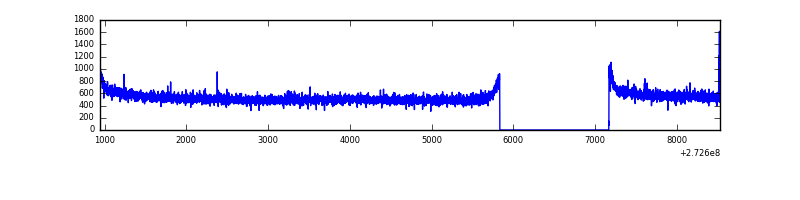 |
| D | 7585 | 6251 | 170 | 170 | 2.24% | 2.72% | 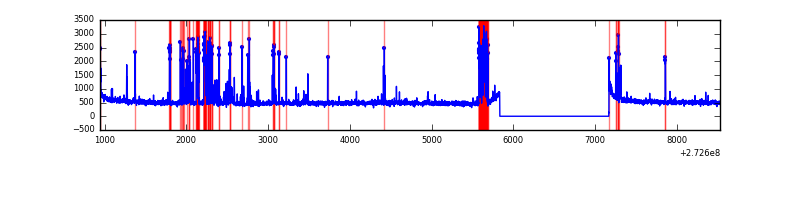 |
Top three noisy pixels from each quadrant. If the there are fewer than three noisy pixels in the level2.evt file, extra rows are filled as -1
| Pixel properties | Quadrant properties | ||||||
|---|---|---|---|---|---|---|---|
| Quadrant | DetID | PixID | Counts | Sigma | Mean | Median | Sigma |
| A | 0 | 226 | 7268 | 39.4 | 826 | 811 | 163.9 |
| A | 12 | 194 | 6200 | 32.88 | 826 | 811 | 163.9 |
| A | 3 | 137 | 5162 | 26.55 | 826 | 811 | 163.9 |
| B | 4 | 173 | 63493 | 411.55 | 830 | 813 | 152.3 |
| B | 12 | 111 | 17214 | 107.69 | 830 | 813 | 152.3 |
| B | 0 | 214 | 16594 | 103.62 | 830 | 813 | 152.3 |
| C | 14 | 238 | 126700 | 685.26 | 808 | 815 | 183.7 |
| C | 3 | 233 | 19649 | 102.52 | 808 | 815 | 183.7 |
| C | 0 | 207 | 8519 | 41.94 | 808 | 815 | 183.7 |
| D | 1 | 52 | 313020 | 1489.73 | 798 | 781 | 209.6 |
| D | 10 | 70 | 298095 | 1418.52 | 798 | 781 | 209.6 |
| D | 6 | 112 | 28800 | 133.68 | 798 | 781 | 209.6 |
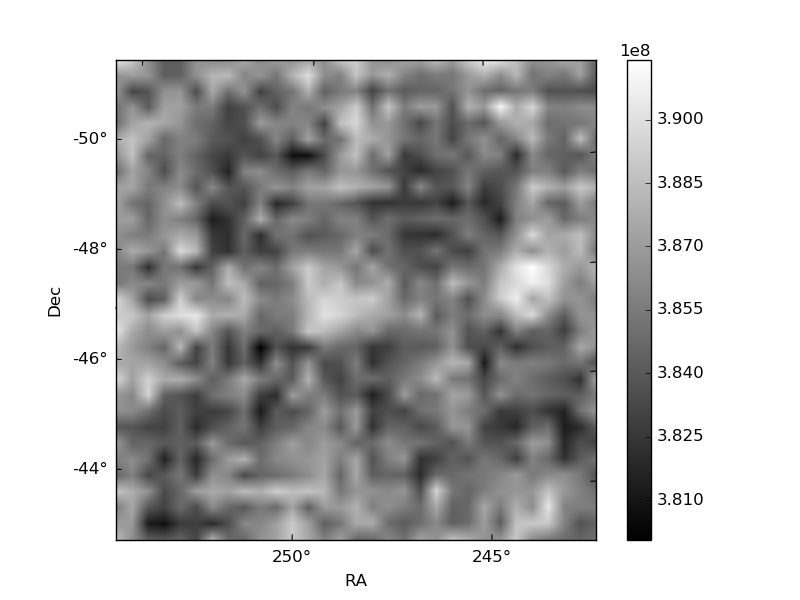
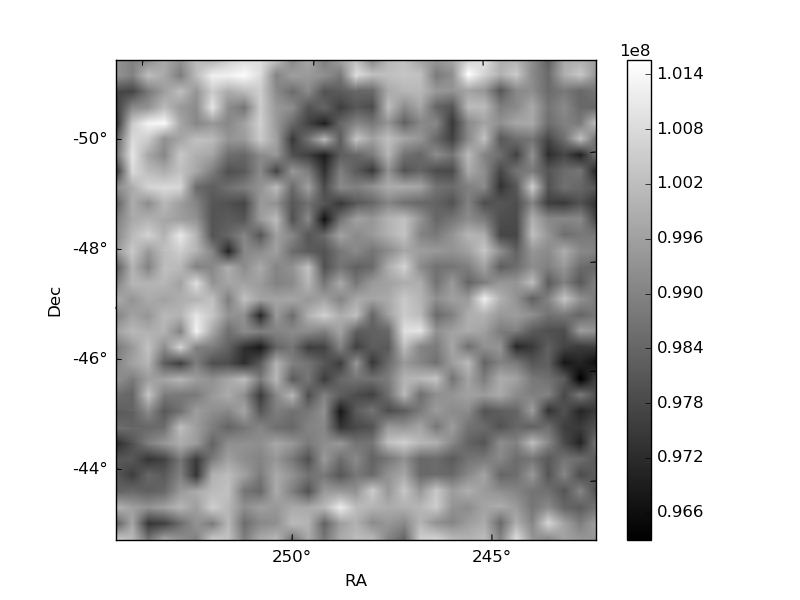
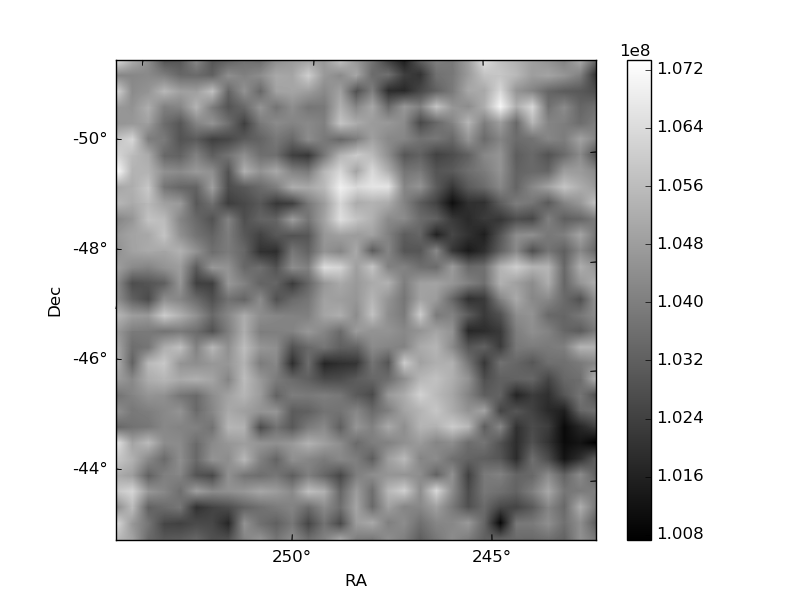
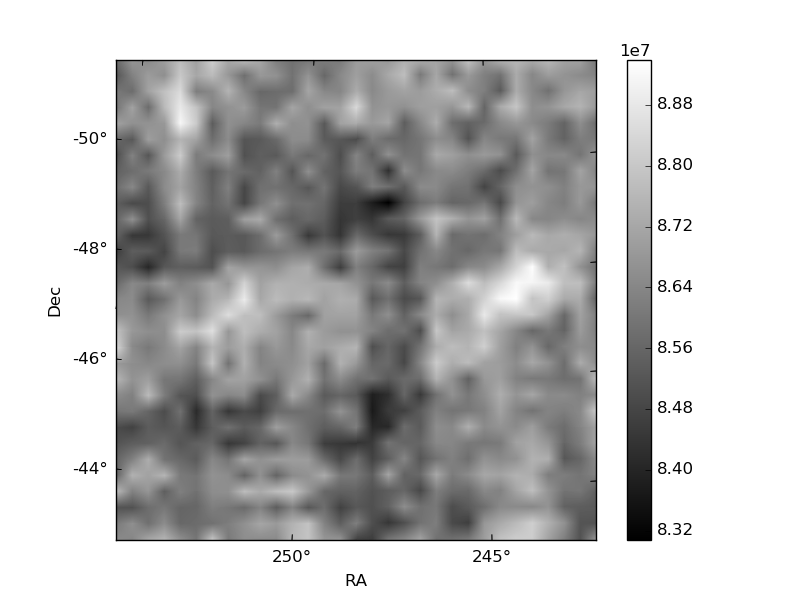
Histogram calculated using DETX and DETY for each event in the final _common_clean file
| Quadrant A | 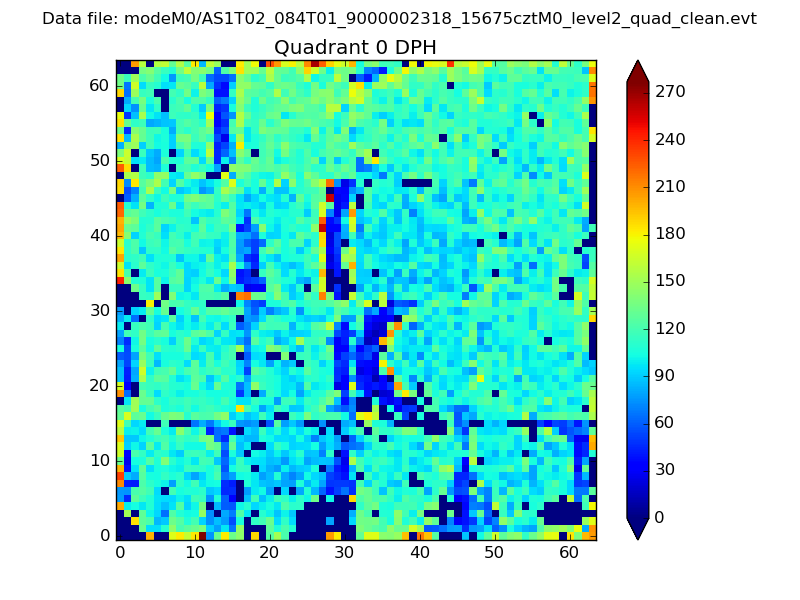 |
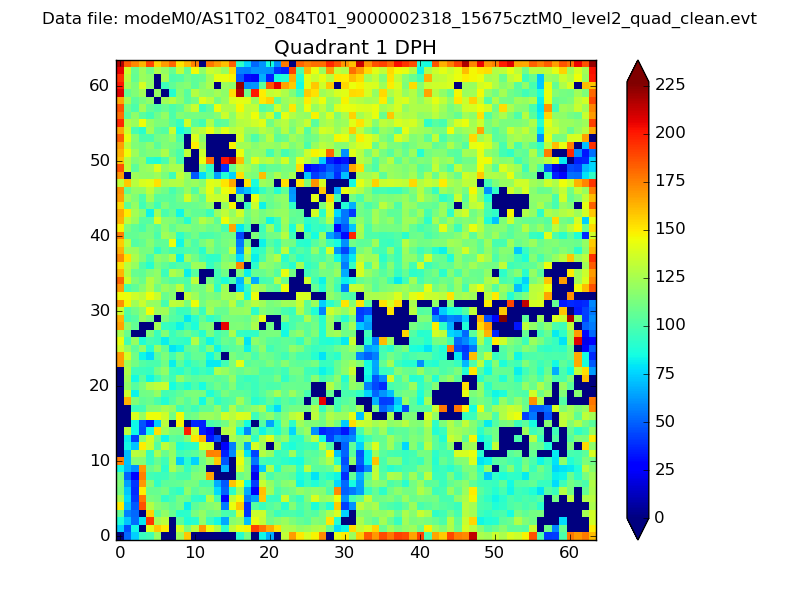 |
Quadrant B |
|---|---|---|---|
| Quadrant D |  |
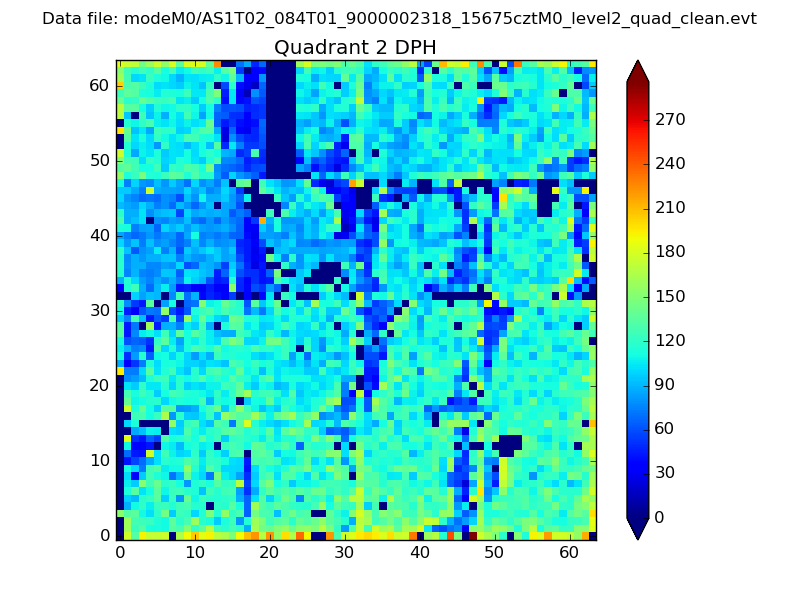 |
Quadrant C |
| Plot type | Count rate plots | Images |
|---|---|---|
| Comparison with Poisson distribution Blue bars denote a histogram of data divided into 1 sec bins. Red curve is a Poisson curve with rate = median count rate of data. |
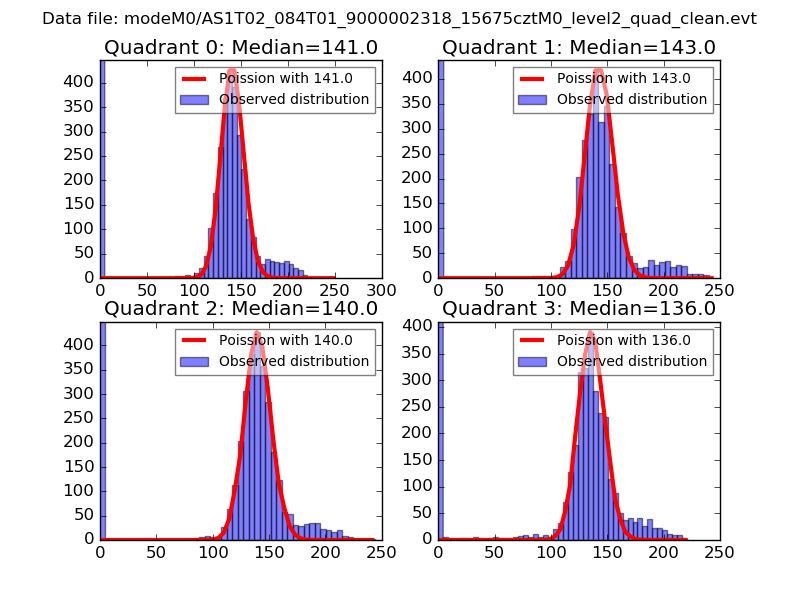 |
 |
| Quadrant-wise count rates Data is divided into 100 sec bins |
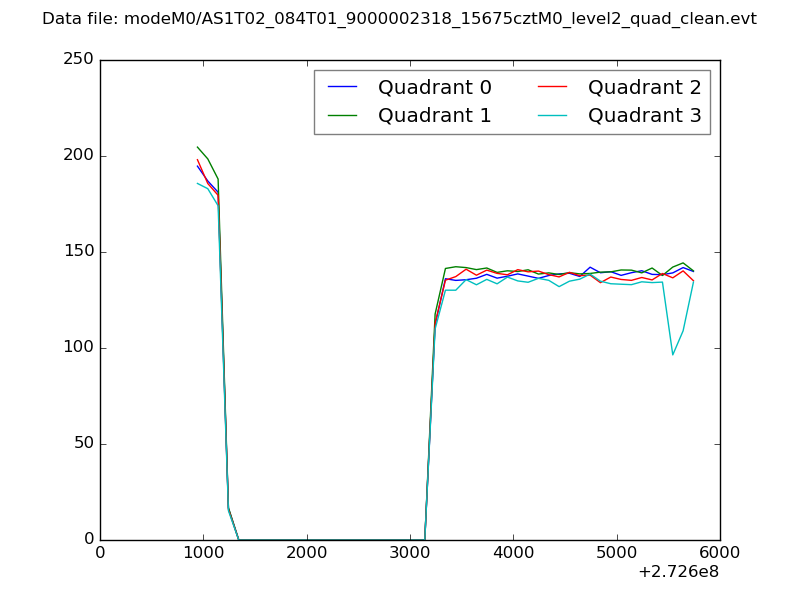 |
|
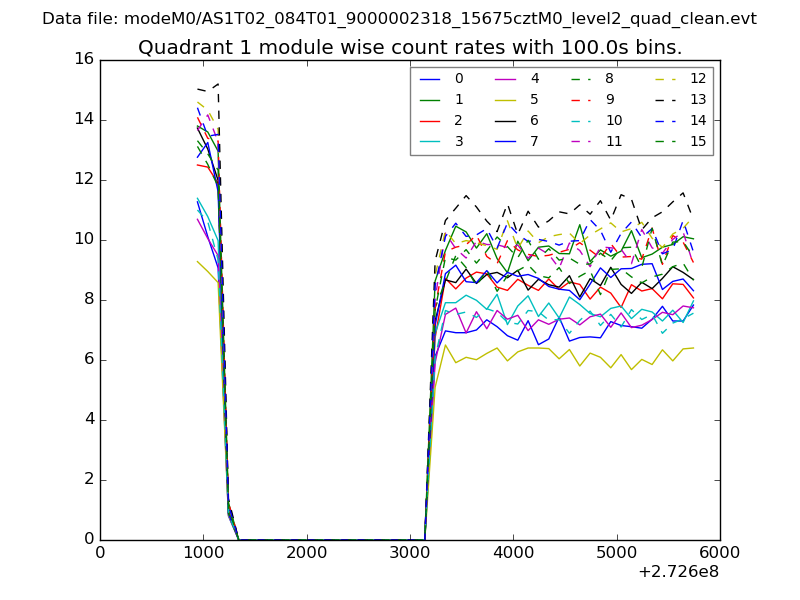
| Module-wise count rates for Quadrant A Data is divided into 100 sec bins |
 |
 |
| Module-wise count rates for Quadrant B Data is divided into 100 sec bins |
 |
 |
| Module-wise count rates for Quadrant C Data is divided into 100 sec bins |
 |
 |
| Module-wise count rates for Quadrant D Data is divided into 100 sec bins |
 |
 |
| Parameter | Plot |
|---|---|
| CZT HV Monitor | 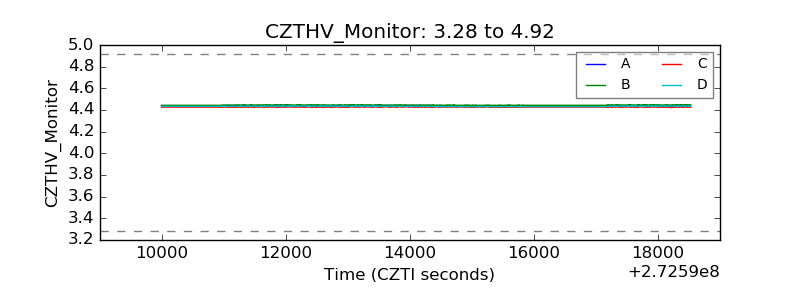 |
| D_VDD | 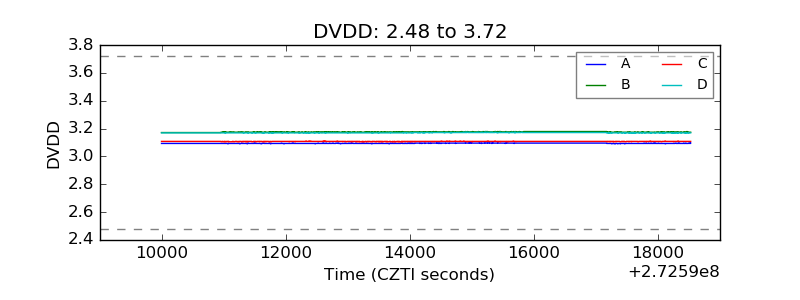 |
| Temperature 1 | 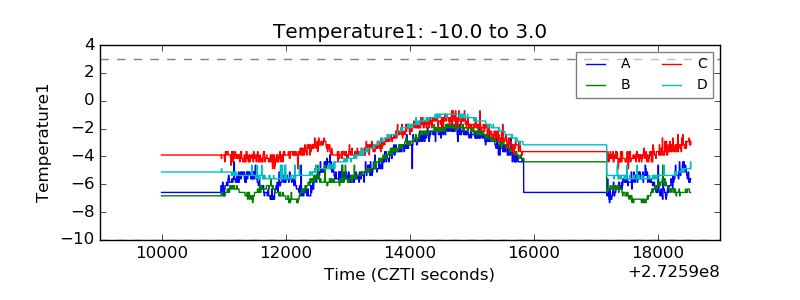 |
| Veto HV Monitor | 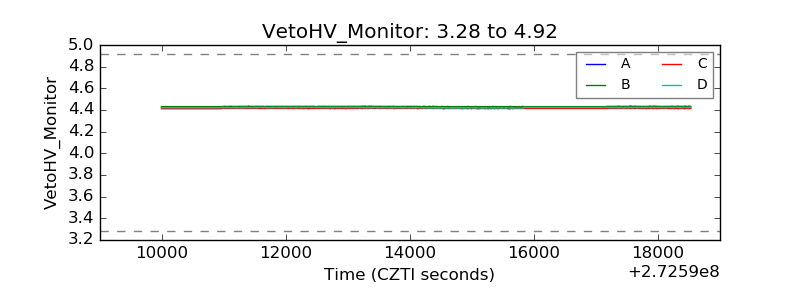 |
| Veto LLD | 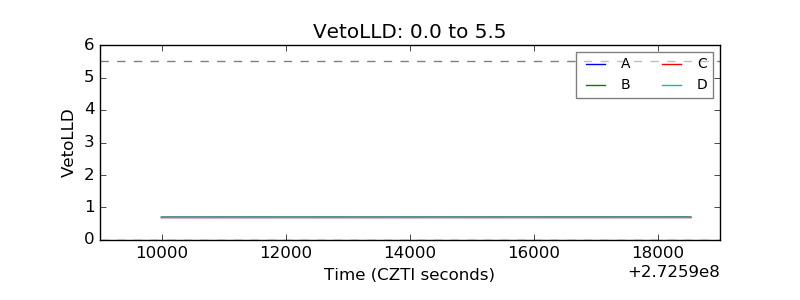 |
| Alpha Counter | 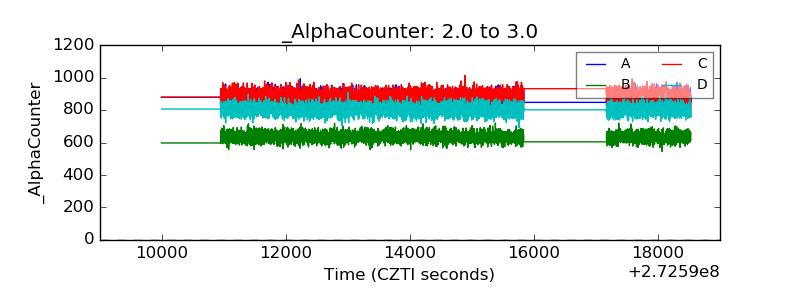 |
| _CPM_Rate | 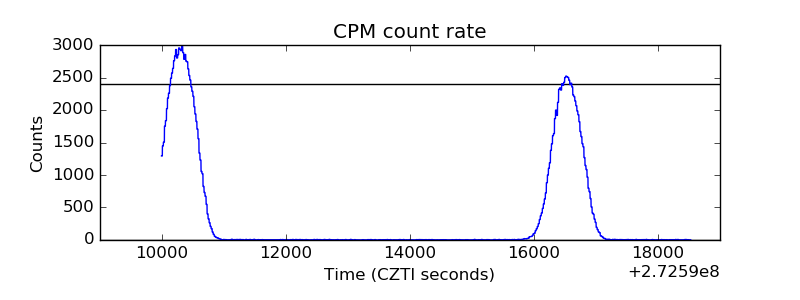 |
| CZT Counter | 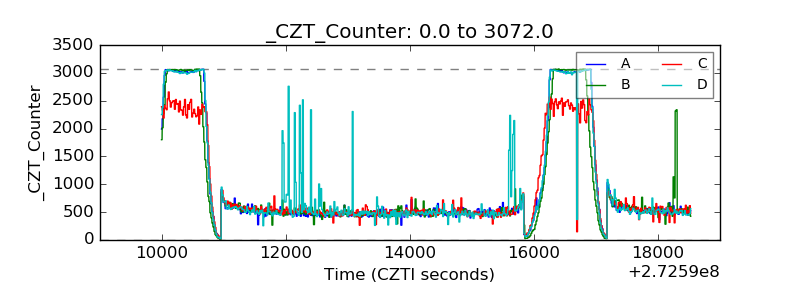 |
| +2.5 Volts monitor |  |
| +5 Volts monitor |  |
| _ROLL_ROT | 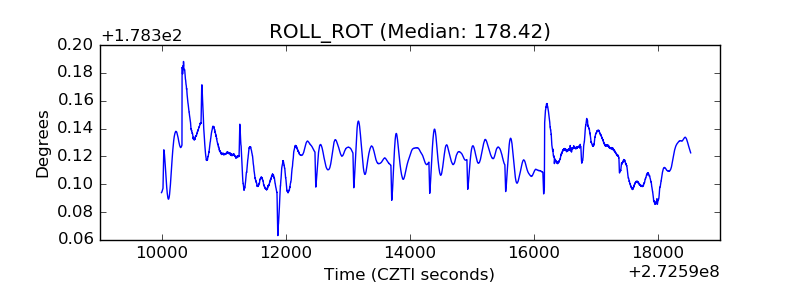 |
| _Roll_DEC | 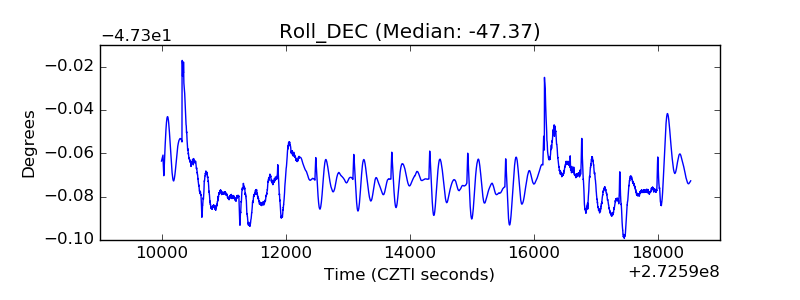 |
| _Roll_RA | 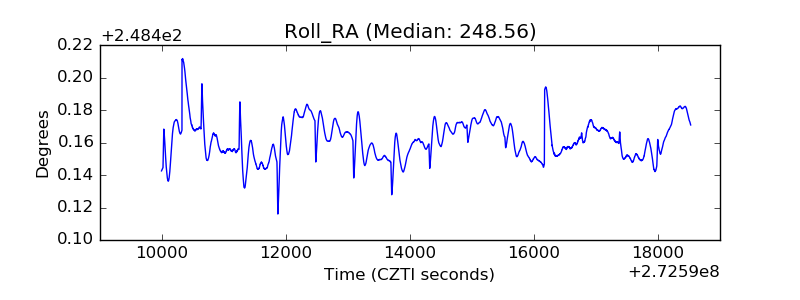 |
| Veto Counter | 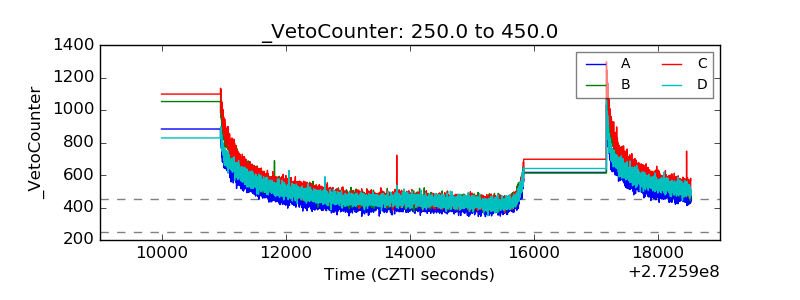 |