| Param | Original file | Final file |
|---|---|---|
| Filename | modeM0/AS1T02_084T01_9000002318_15676cztM0_level2.evt | modeM0/AS1T02_084T01_9000002318_15676cztM0_level2_quad_clean.evt |
| Size (bytes) | 475,156,800 | 69,091,200 |
| Size | 453.1 MB | 65.9 MB |
| Events in quadrant A | 3,265,973 | 417,750 |
| Events in quadrant B | 3,391,764 | 422,815 |
| Events in quadrant C | 3,347,059 | 413,038 |
| Events in quadrant D | 3,961,682 | 403,074 |
| Mode M0 | |||
|---|---|---|---|
| Quadrant | BADHDUFLAG | Total packets | Discarded packets |
| A | 0 | 13282 | 3 |
| B | 0 | 13683 | 2 |
| C | 0 | 13564 | 2 |
| D | 0 | 15479 | 2 |
| Mode M9 | |||
|---|---|---|---|
| Quadrant | BADHDUFLAG | Total packets | Discarded packets |
| A | 0 | 17 | 0 |
| B | 0 | 17 | 0 |
| C | 0 | 17 | 0 |
| D | 0 | 18 | 0 |
| Mode SS | |||
|---|---|---|---|
| Quadrant | BADHDUFLAG | Total packets | Discarded packets |
| A | 0 | 126 | 0 |
| B | 0 | 126 | 0 |
| C | 0 | 126 | 0 |
| D | 0 | 126 | 0 |
| Quadrant | Total seconds | Saturated seconds | Saturation percentage |
|---|---|---|---|
| A | 6240 | 64 | 1.025641% |
| B | 6240 | 119 | 1.907051% |
| C | 6240 | 167 | 2.676282% |
| D | 6240 | 425 | 6.810897% |
Noise dominated data is calculated using 1-second bins in cleaned event files. If a bin has >2000 counts, and if more than 50% of those come from <1% of pixels, then it is considered to be noise-dominated and hence unusable.
| Quadrant | # 1 sec bins | Bins with >0 counts | Bins with >2000 counts | High rate bins dominated by noise | Noise dominated (total time) | Noise dominated (detector-on time) | Marked lightcurve |
|---|---|---|---|---|---|---|---|
| A | 7591 | 6242 | 8 | 8 | 0.11% | 0.13% | 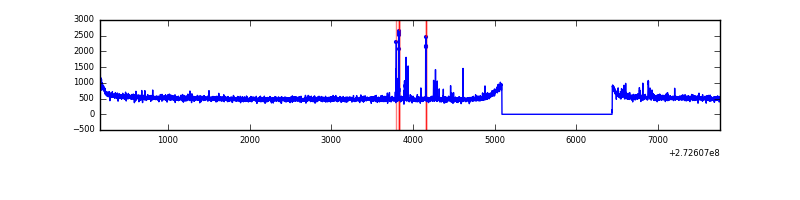 |
| B | 7591 | 6242 | 18 | 18 | 0.24% | 0.29% | 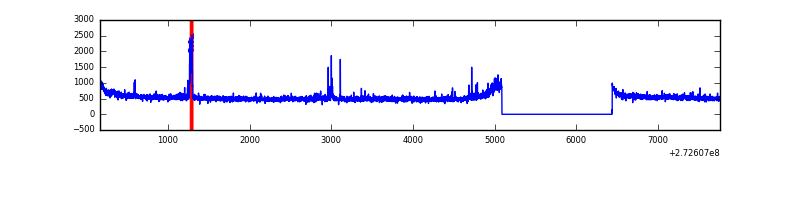 |
| C | 7591 | 6242 | 0 | 0 | 0.00% | 0.00% | 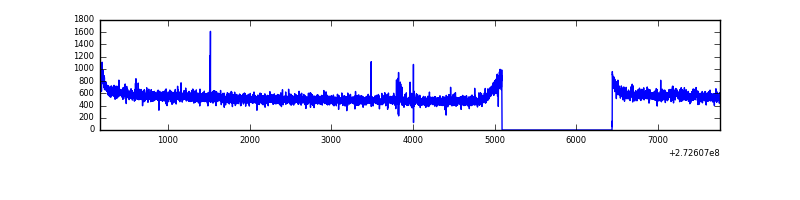 |
| D | 7591 | 6242 | 267 | 267 | 3.52% | 4.28% | 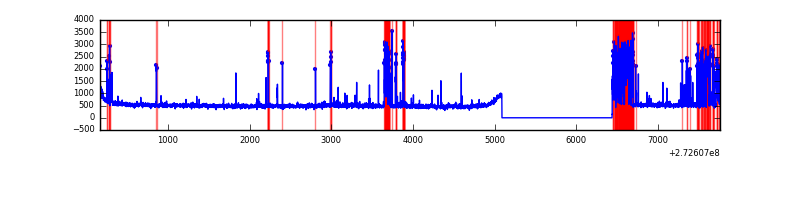 |
Top three noisy pixels from each quadrant. If the there are fewer than three noisy pixels in the level2.evt file, extra rows are filled as -1
| Pixel properties | Quadrant properties | ||||||
|---|---|---|---|---|---|---|---|
| Quadrant | DetID | PixID | Counts | Sigma | Mean | Median | Sigma |
| A | 13 | 248 | 47147 | 277.79 | 833 | 816 | 166.8 |
| A | 15 | 69 | 13810 | 77.91 | 833 | 816 | 166.8 |
| A | 0 | 226 | 7512 | 40.15 | 833 | 816 | 166.8 |
| B | 4 | 173 | 75359 | 487.27 | 829 | 811 | 153.0 |
| B | 0 | 189 | 32127 | 204.69 | 829 | 811 | 153.0 |
| B | 0 | 214 | 19252 | 120.54 | 829 | 811 | 153.0 |
| C | 14 | 238 | 139626 | 752.45 | 808 | 814 | 184.5 |
| C | 3 | 233 | 39950 | 212.14 | 808 | 814 | 184.5 |
| C | 14 | 234 | 7771 | 37.71 | 808 | 814 | 184.5 |
| D | 1 | 52 | 887643 | 4713.6 | 784 | 764 | 188.2 |
| D | 10 | 70 | 58659 | 307.7 | 784 | 764 | 188.2 |
| D | 2 | 234 | 21065 | 107.9 | 784 | 764 | 188.2 |
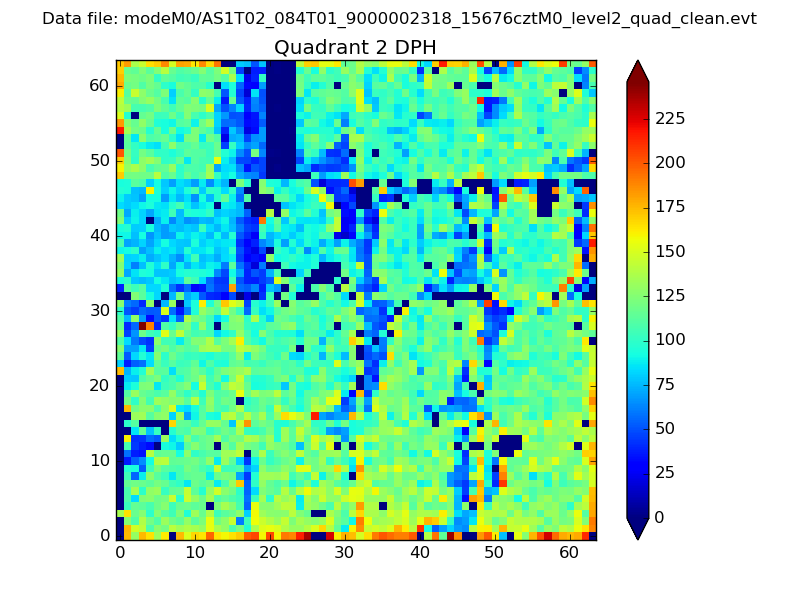
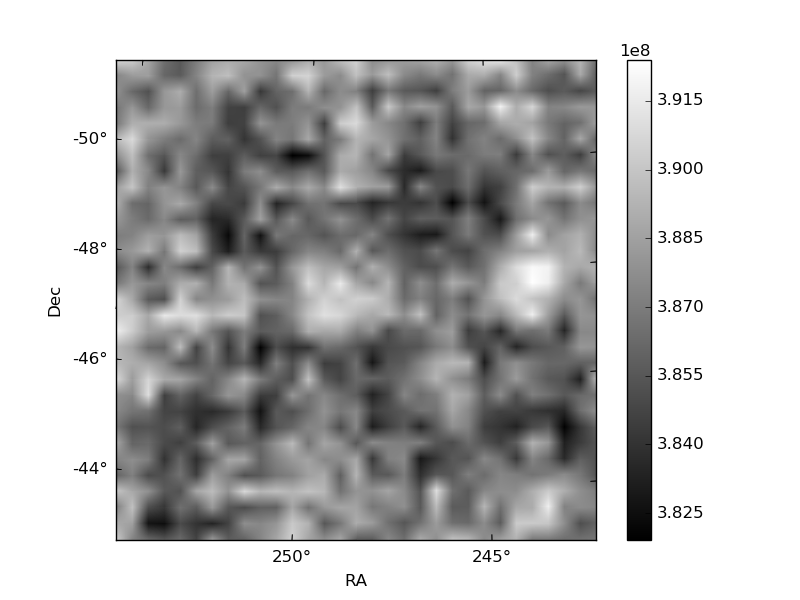
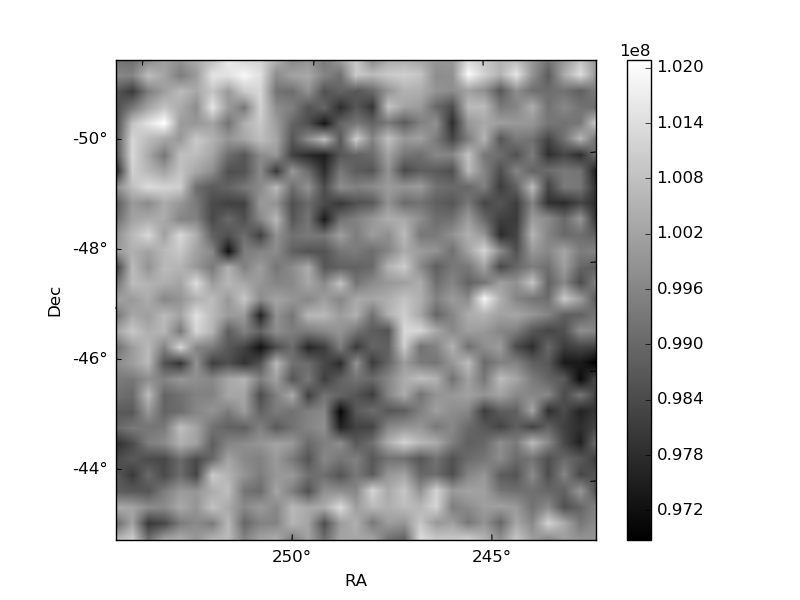
Histogram calculated using DETX and DETY for each event in the final _common_clean file
| Quadrant A | 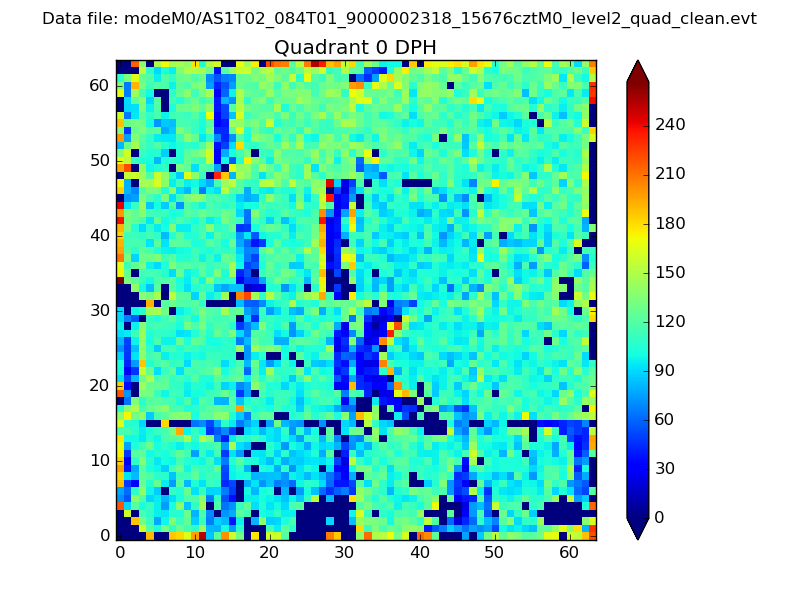 |
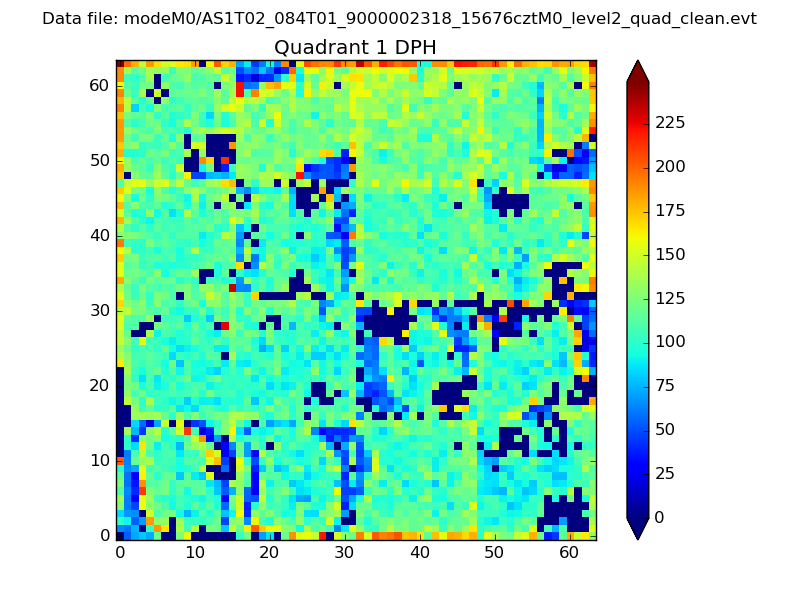 |
Quadrant B |
|---|---|---|---|
| Quadrant D | 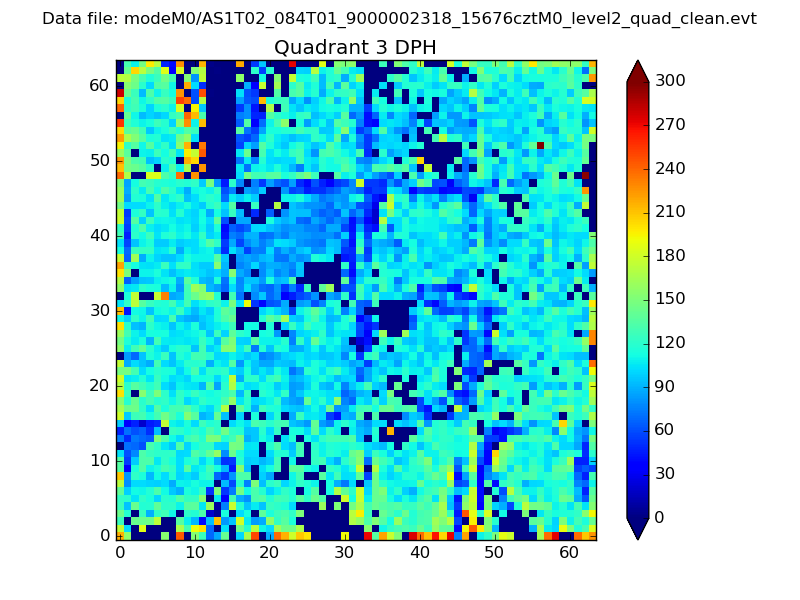 |
 |
Quadrant C |
| Plot type | Count rate plots | Images |
|---|---|---|
| Comparison with Poisson distribution Blue bars denote a histogram of data divided into 1 sec bins. Red curve is a Poisson curve with rate = median count rate of data. |
 |
 |
| Quadrant-wise count rates Data is divided into 100 sec bins |
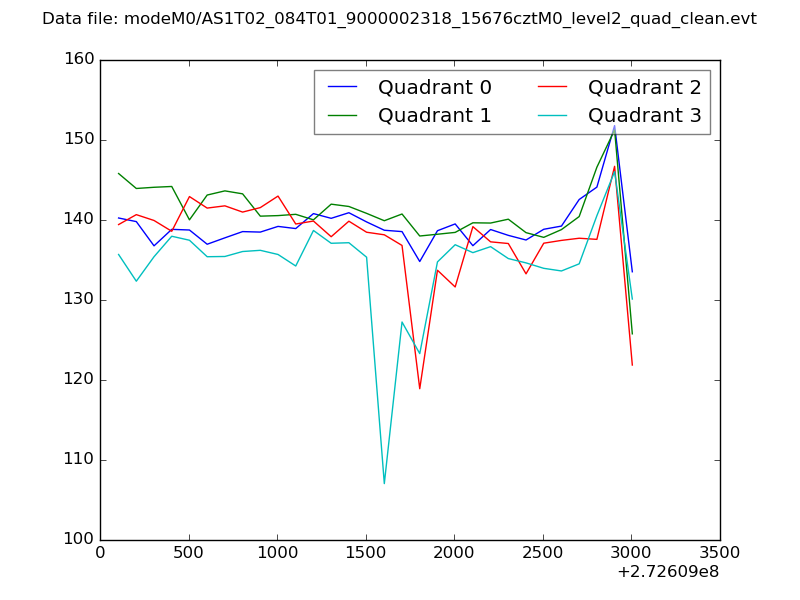 |
|
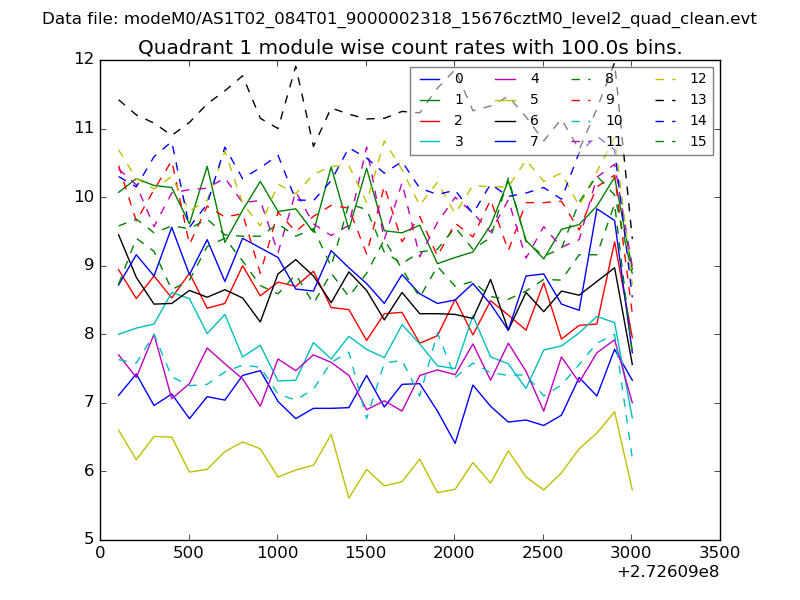
| Module-wise count rates for Quadrant A Data is divided into 100 sec bins |
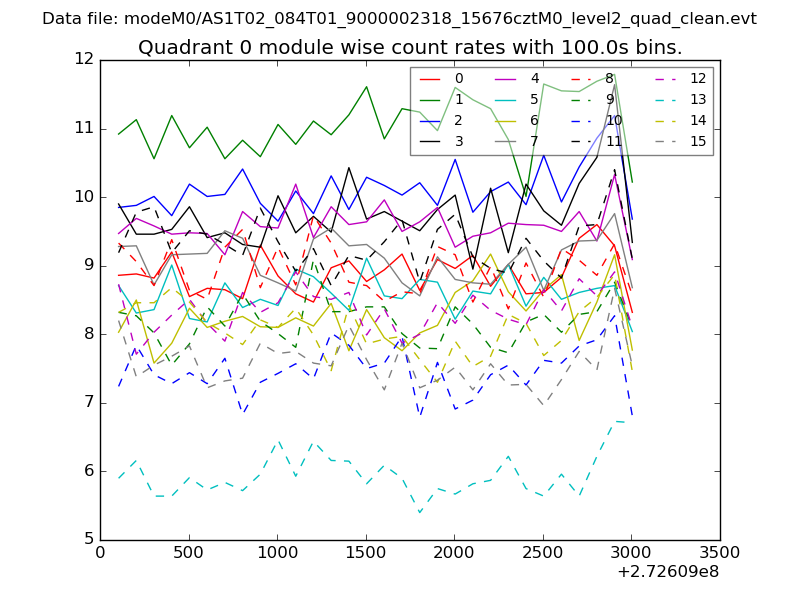 |
 |
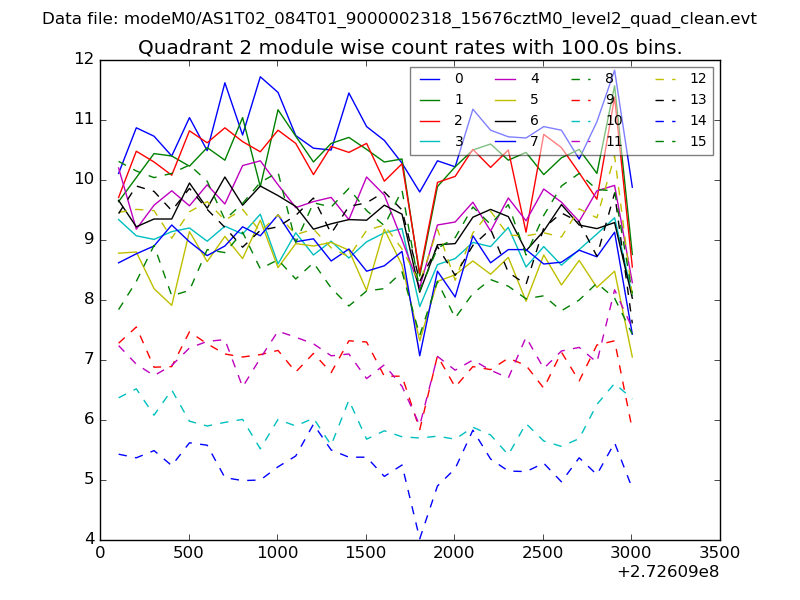
| Module-wise count rates for Quadrant B Data is divided into 100 sec bins |
 |
 |
| Module-wise count rates for Quadrant C Data is divided into 100 sec bins |
 |
 |
| Module-wise count rates for Quadrant D Data is divided into 100 sec bins |
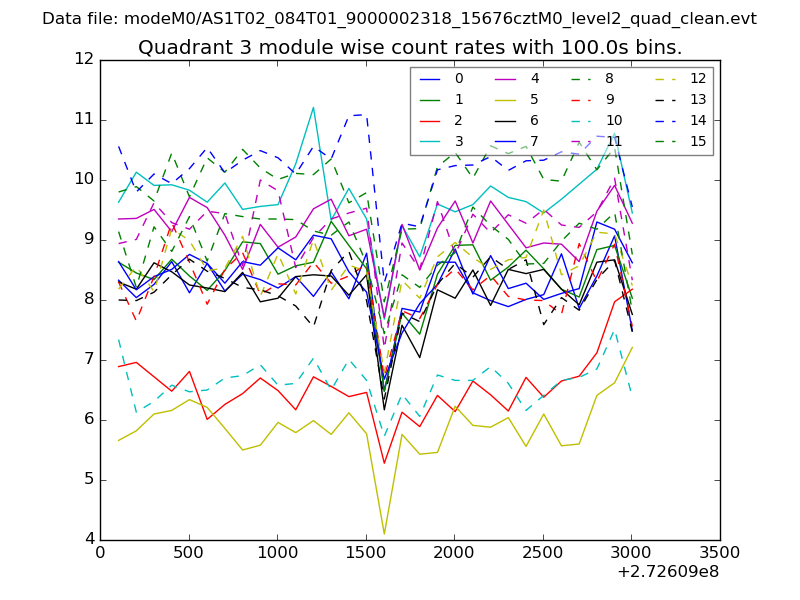 |
 |
| Parameter | Plot |
|---|---|
| CZT HV Monitor | 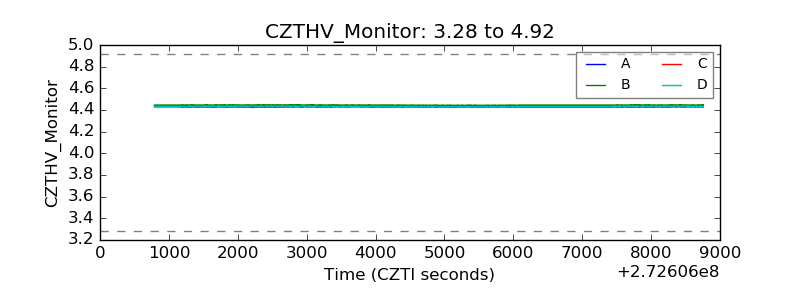 |
| D_VDD | 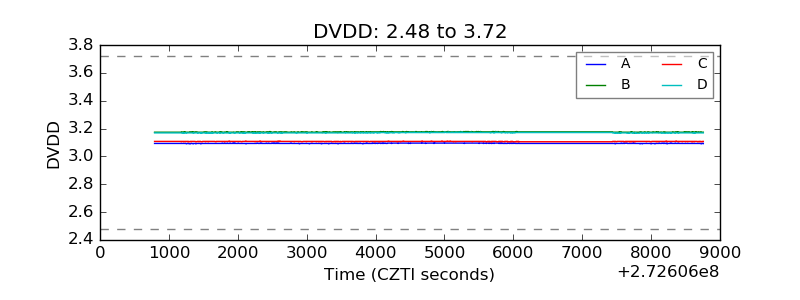 |
| Temperature 1 |  |
| Veto HV Monitor | 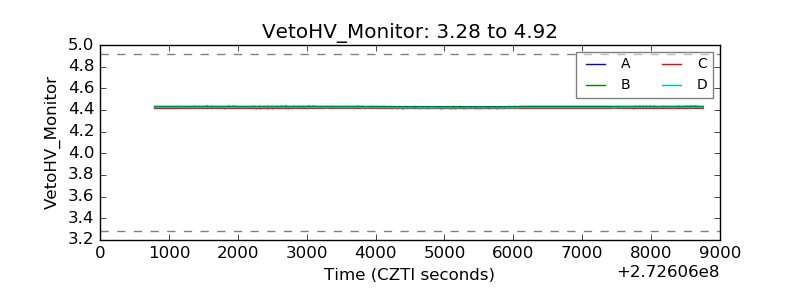 |
| Veto LLD | 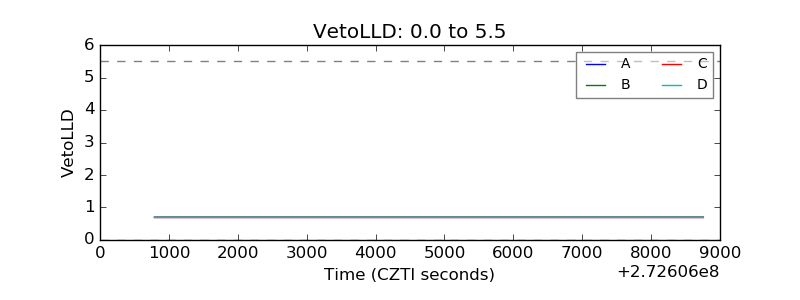 |
| Alpha Counter | 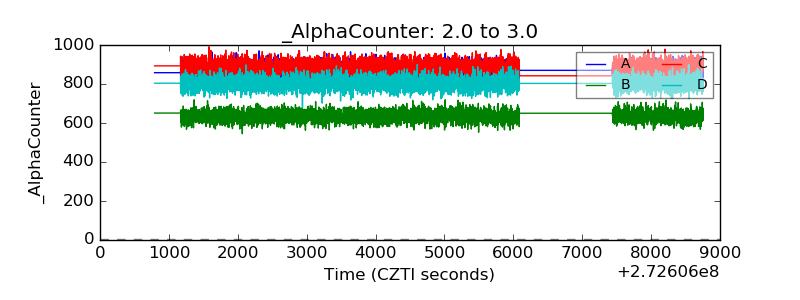 |
| _CPM_Rate | 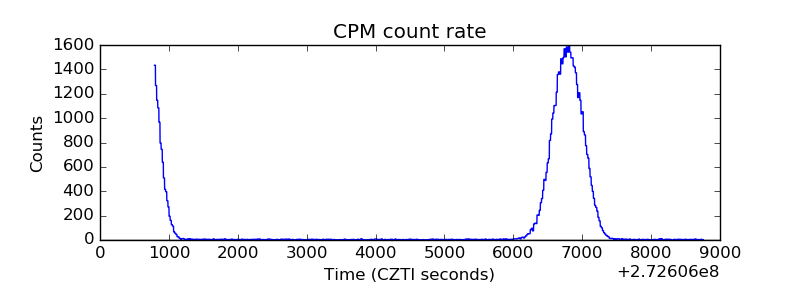 |
| CZT Counter | 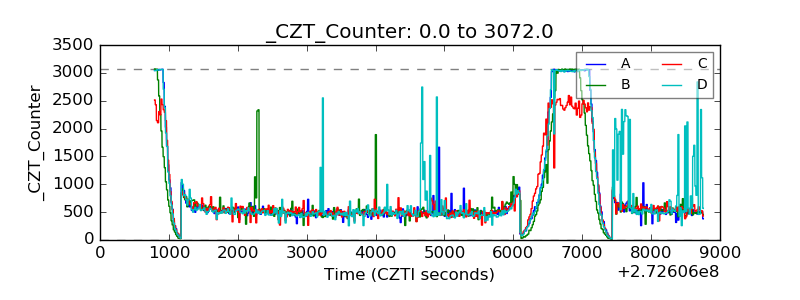 |
| +2.5 Volts monitor |  |
| +5 Volts monitor |  |
| _ROLL_ROT | 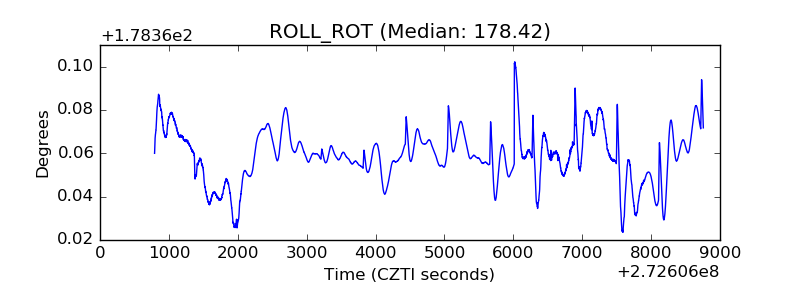 |
| _Roll_DEC | 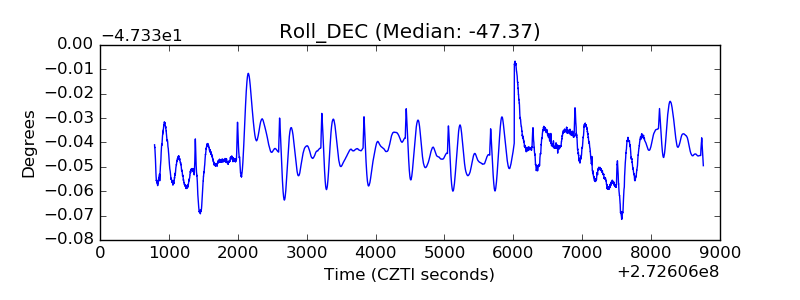 |
| _Roll_RA | 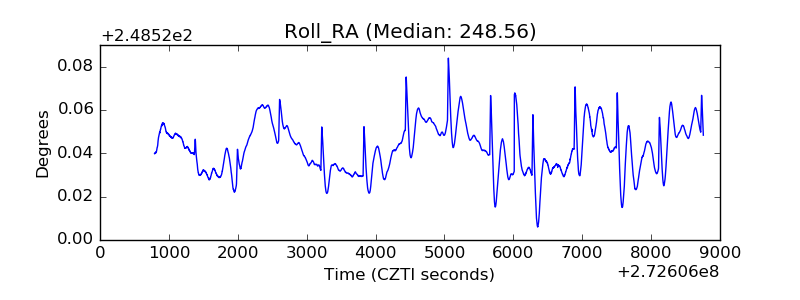 |
| Veto Counter | 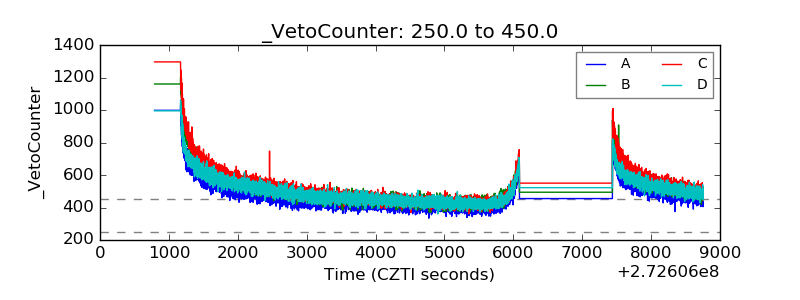 |