| Param | Original file | Final file |
|---|---|---|
| Filename | modeM0/AS1T02_084T01_9000002318_15677cztM0_level2.evt | modeM0/AS1T02_084T01_9000002318_15677cztM0_level2_quad_clean.evt |
| Size (bytes) | 465,667,200 | 81,008,640 |
| Size | 444.1 MB | 77.3 MB |
| Events in quadrant A | 3,177,357 | 506,580 |
| Events in quadrant B | 3,330,343 | 512,593 |
| Events in quadrant C | 3,322,047 | 502,151 |
| Events in quadrant D | 3,843,810 | 490,997 |
| Mode M0 | |||
|---|---|---|---|
| Quadrant | BADHDUFLAG | Total packets | Discarded packets |
| A | 0 | 13195 | 3 |
| B | 0 | 13568 | 2 |
| C | 0 | 13468 | 2 |
| D | 0 | 15369 | 2 |
| Mode M9 | |||
|---|---|---|---|
| Quadrant | BADHDUFLAG | Total packets | Discarded packets |
| A | 0 | 20 | 0 |
| B | 0 | 20 | 0 |
| C | 0 | 20 | 0 |
| D | 0 | 21 | 0 |
| Mode SS | |||
|---|---|---|---|
| Quadrant | BADHDUFLAG | Total packets | Discarded packets |
| A | 0 | 128 | 0 |
| B | 0 | 128 | 0 |
| C | 0 | 128 | 0 |
| D | 0 | 128 | 0 |
| Quadrant | Total seconds | Saturated seconds | Saturation percentage |
|---|---|---|---|
| A | 6316 | 58 | 0.918303% |
| B | 6316 | 88 | 1.393287% |
| C | 6316 | 123 | 1.947435% |
| D | 6316 | 378 | 5.984801% |
Noise dominated data is calculated using 1-second bins in cleaned event files. If a bin has >2000 counts, and if more than 50% of those come from <1% of pixels, then it is considered to be noise-dominated and hence unusable.
| Quadrant | # 1 sec bins | Bins with >0 counts | Bins with >2000 counts | High rate bins dominated by noise | Noise dominated (total time) | Noise dominated (detector-on time) | Marked lightcurve |
|---|---|---|---|---|---|---|---|
| A | 7552 | 6318 | 0 | 0 | 0.00% | 0.00% | 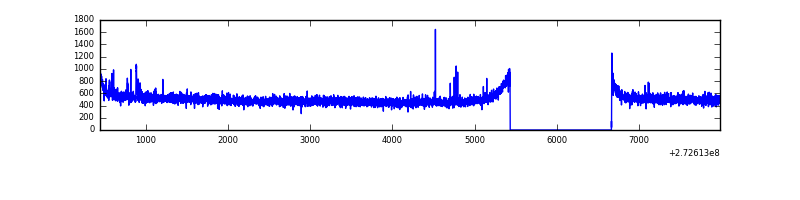 |
| B | 7552 | 6318 | 2 | 2 | 0.03% | 0.03% | 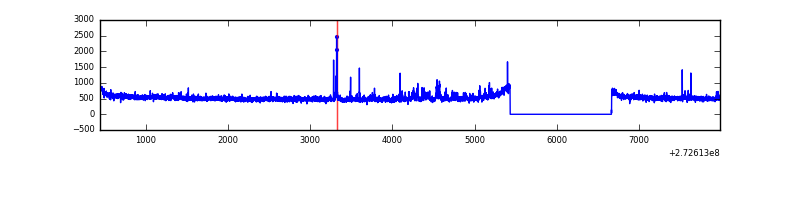 |
| C | 7552 | 6318 | 0 | 0 | 0.00% | 0.00% | 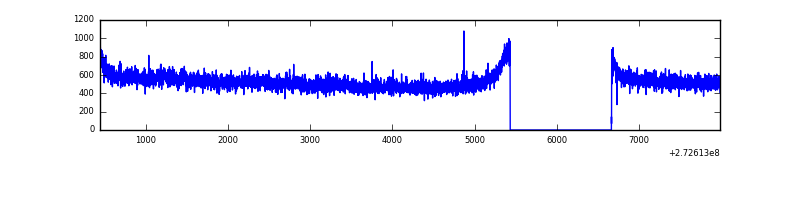 |
| D | 7552 | 6318 | 212 | 212 | 2.81% | 3.36% | 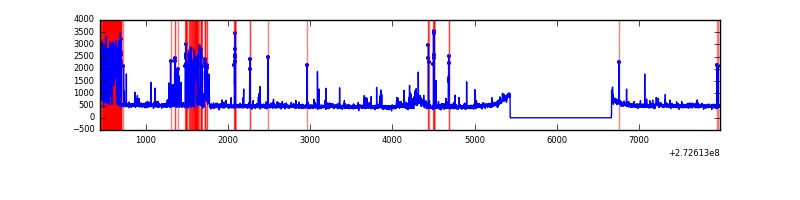 |
Top three noisy pixels from each quadrant. If the there are fewer than three noisy pixels in the level2.evt file, extra rows are filled as -1
| Pixel properties | Quadrant properties | ||||||
|---|---|---|---|---|---|---|---|
| Quadrant | DetID | PixID | Counts | Sigma | Mean | Median | Sigma |
| A | 15 | 69 | 14076 | 81.14 | 819 | 801 | 163.6 |
| A | 4 | 2 | 8922 | 49.64 | 819 | 801 | 163.6 |
| A | 13 | 248 | 8591 | 47.61 | 819 | 801 | 163.6 |
| B | 0 | 189 | 31109 | 197.85 | 817 | 799 | 153.2 |
| B | 4 | 216 | 29476 | 187.19 | 817 | 799 | 153.2 |
| B | 3 | 209 | 18236 | 113.82 | 817 | 799 | 153.2 |
| C | 14 | 238 | 123734 | 675.62 | 793 | 800 | 182.0 |
| C | 3 | 233 | 101967 | 555.99 | 793 | 800 | 182.0 |
| C | 13 | 61 | 5704 | 26.95 | 793 | 800 | 182.0 |
| D | 1 | 52 | 813136 | 4424.97 | 770 | 746 | 183.6 |
| D | 10 | 70 | 67888 | 365.71 | 770 | 746 | 183.6 |
| D | 5 | 51 | 29391 | 156.03 | 770 | 746 | 183.6 |
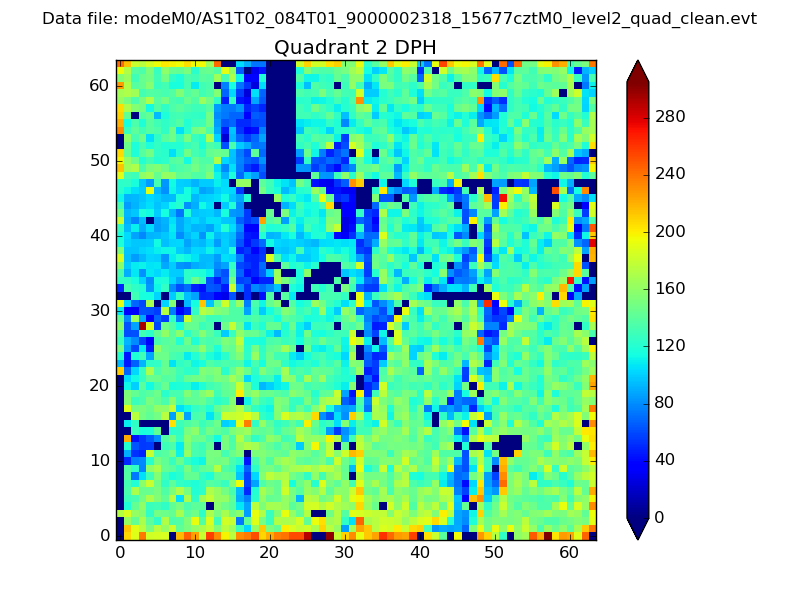
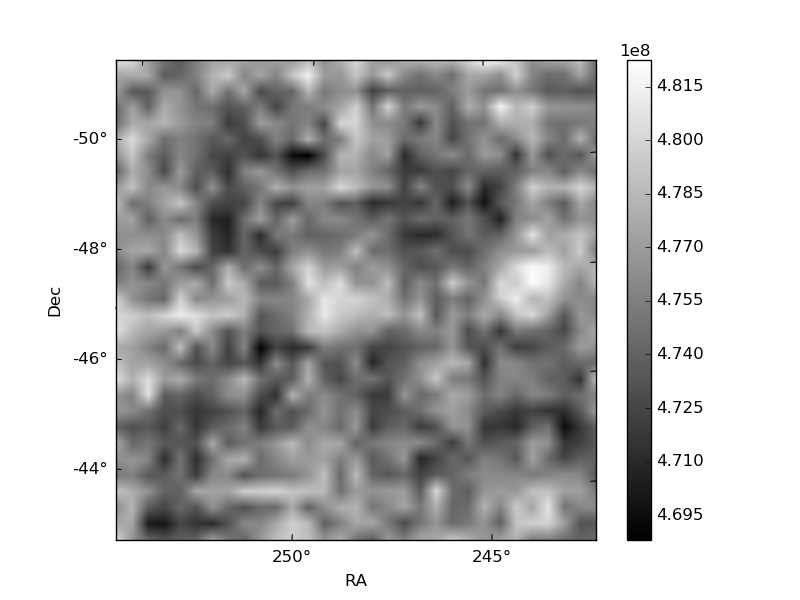
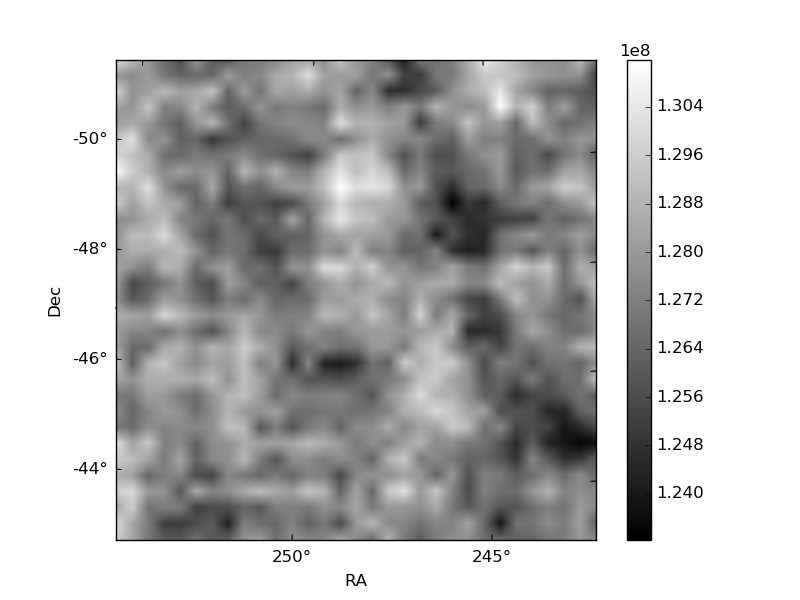
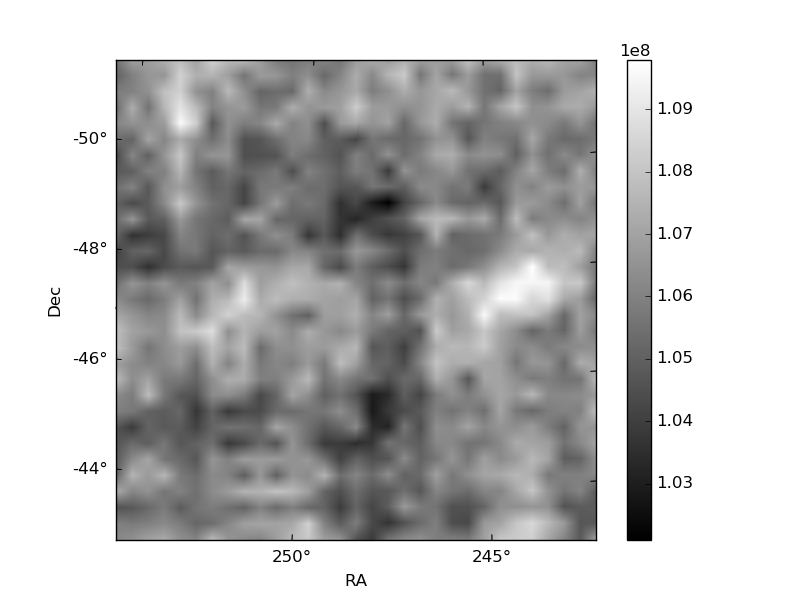
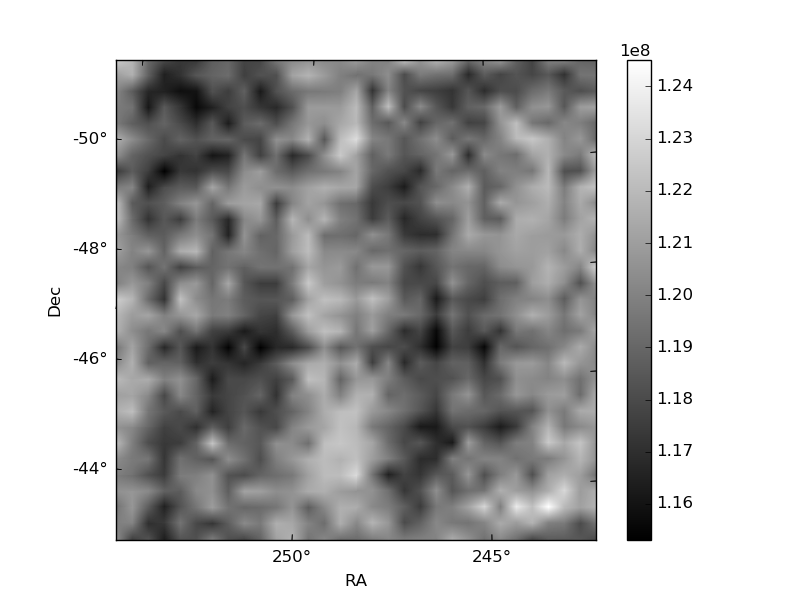
Histogram calculated using DETX and DETY for each event in the final _common_clean file
| Quadrant A | 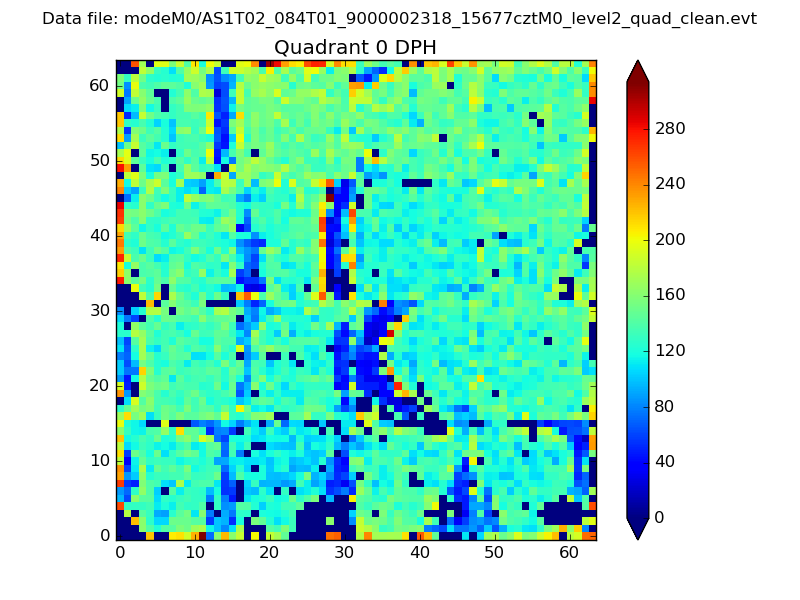 |
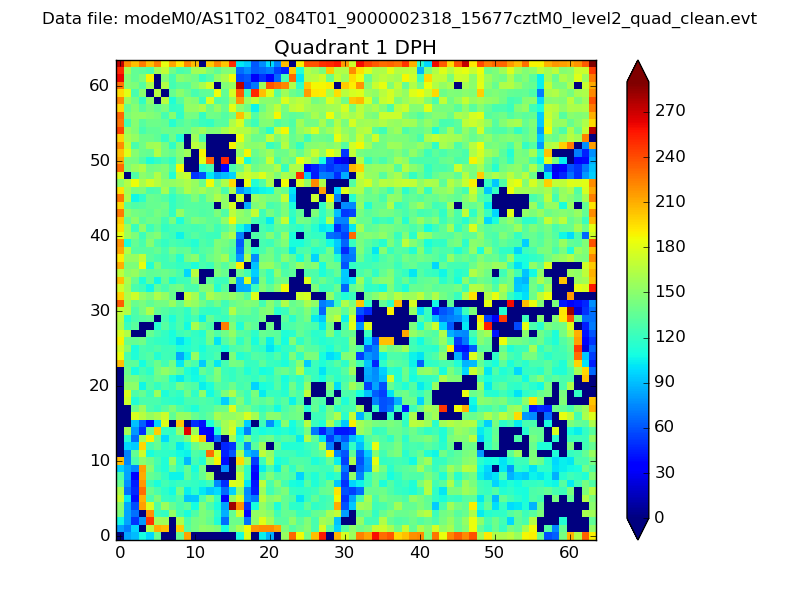 |
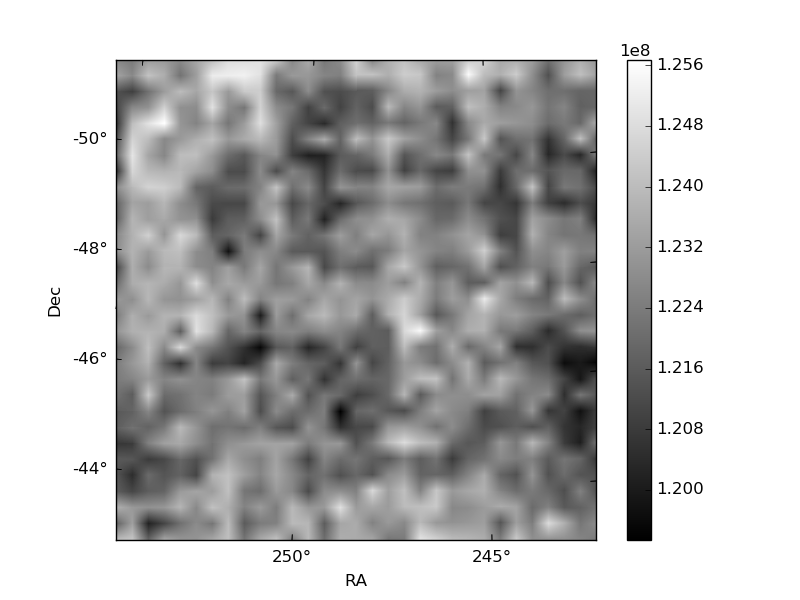
Quadrant B |
|---|---|---|---|
| Quadrant D | 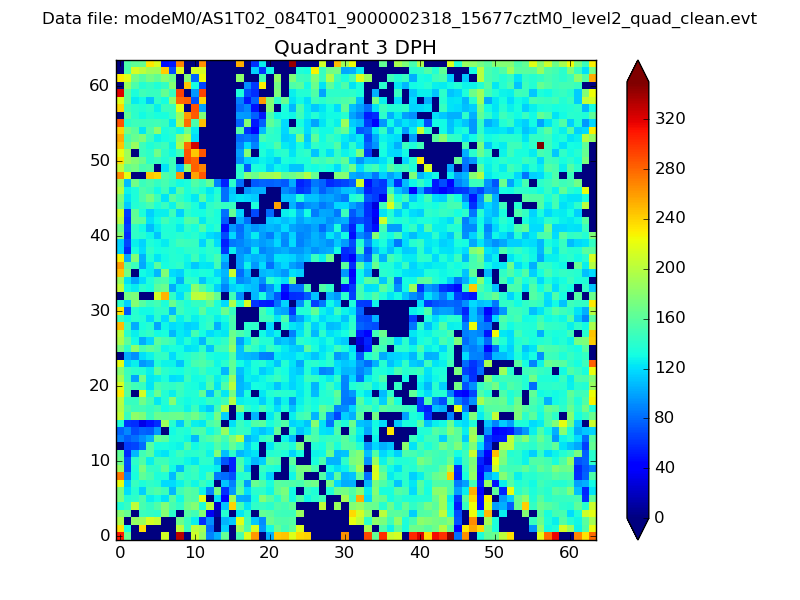 |
 |
Quadrant C |
| Plot type | Count rate plots | Images |
|---|---|---|
| Comparison with Poisson distribution Blue bars denote a histogram of data divided into 1 sec bins. Red curve is a Poisson curve with rate = median count rate of data. |
 |
 |
| Quadrant-wise count rates Data is divided into 100 sec bins |
 |
|
| Module-wise count rates for Quadrant A Data is divided into 100 sec bins |
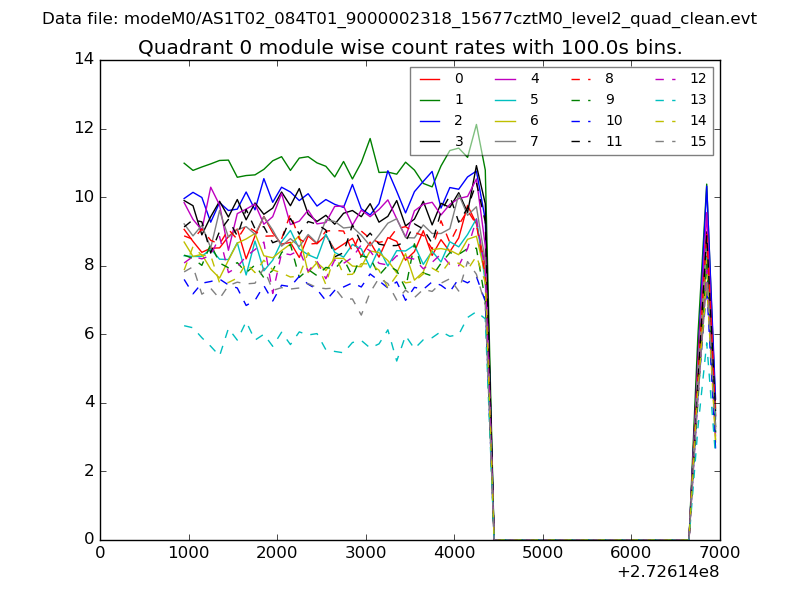 |
 |
| Module-wise count rates for Quadrant B Data is divided into 100 sec bins |
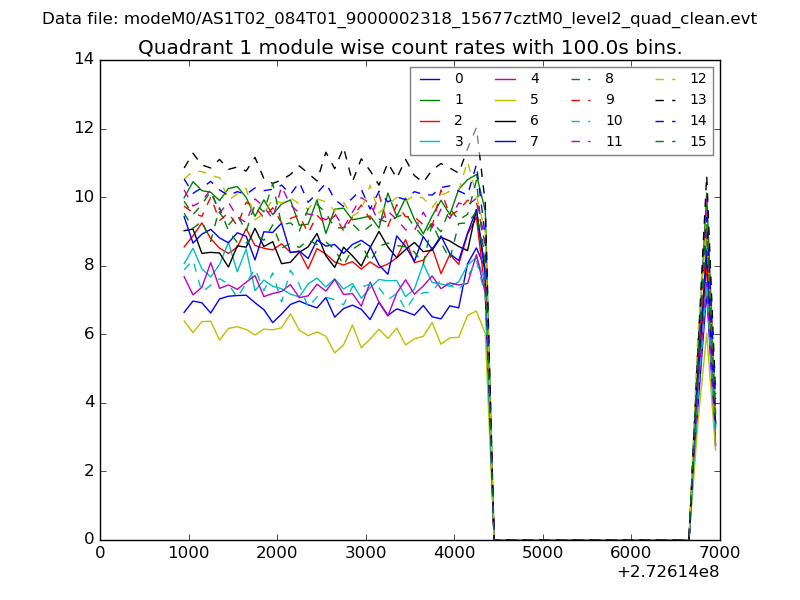 |
 |
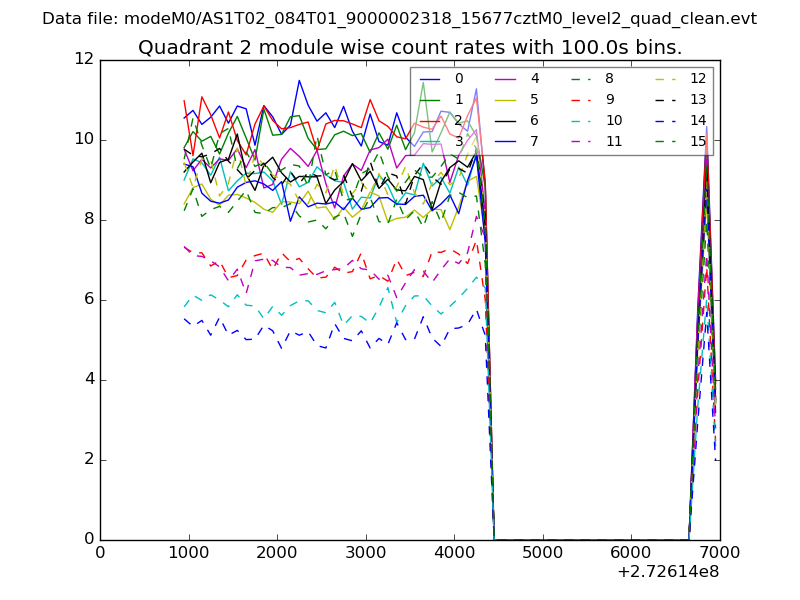
| Module-wise count rates for Quadrant C Data is divided into 100 sec bins |
 |
 |
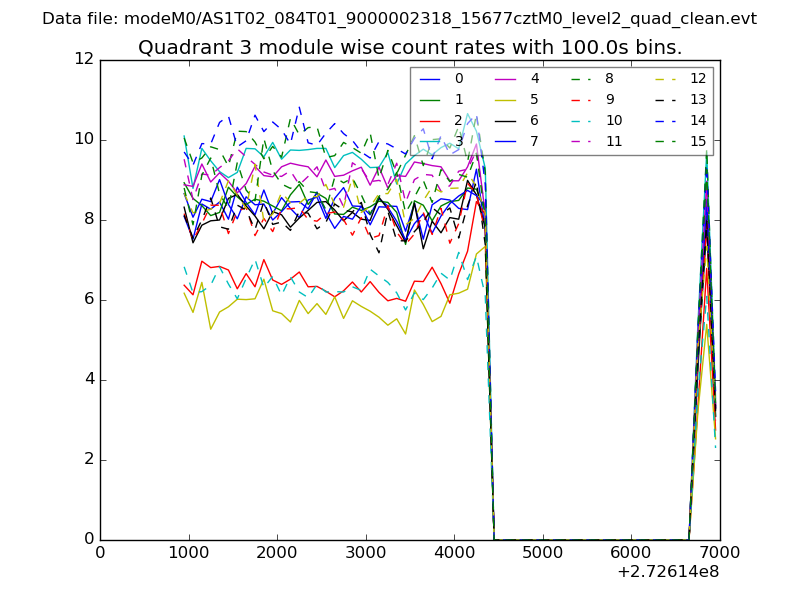
| Module-wise count rates for Quadrant D Data is divided into 100 sec bins |
 |
 |
| Parameter | Plot |
|---|---|
| CZT HV Monitor | 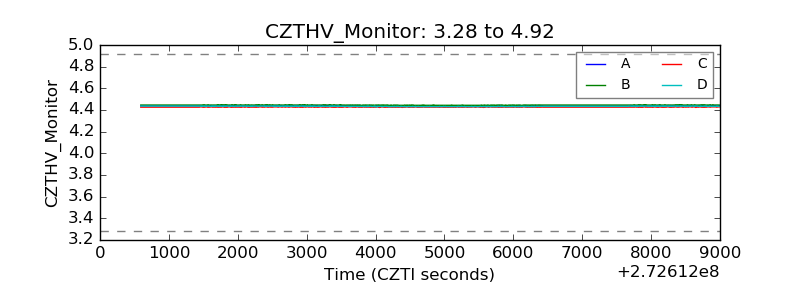 |
| D_VDD | 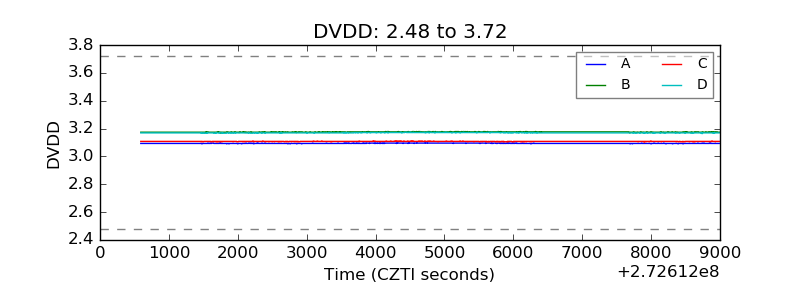 |
| Temperature 1 | 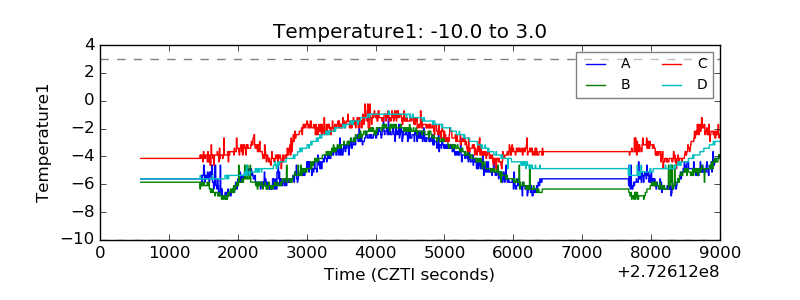 |
| Veto HV Monitor | 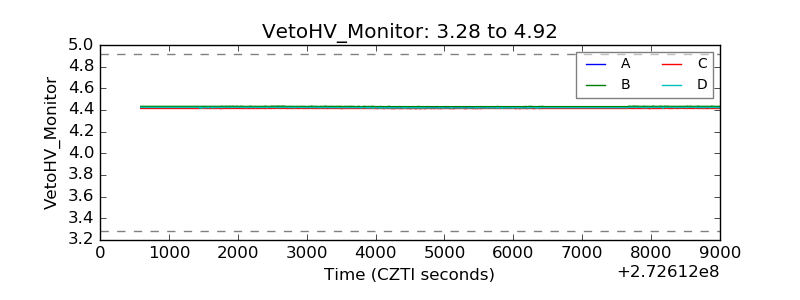 |
| Veto LLD | 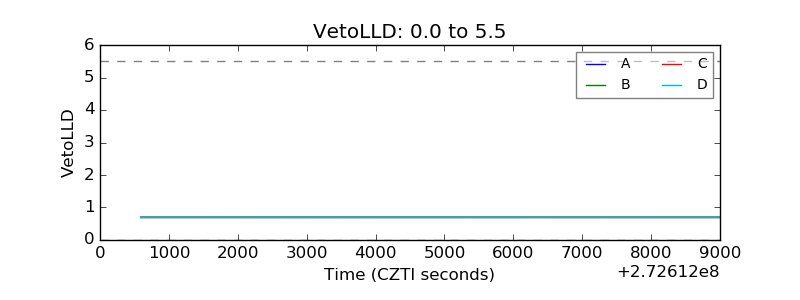 |
| Alpha Counter | 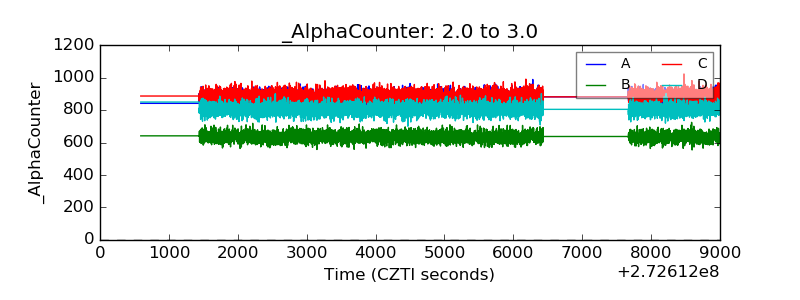 |
| _CPM_Rate |  |
| CZT Counter | 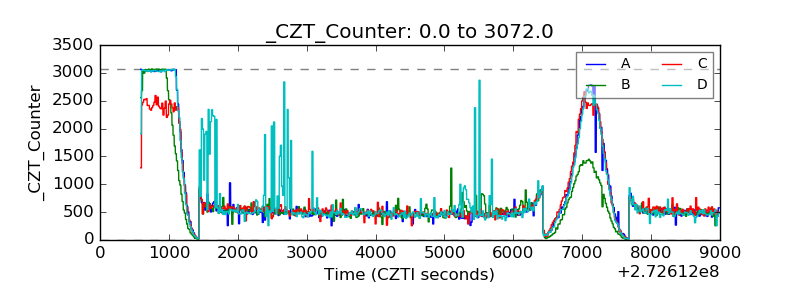 |
| +2.5 Volts monitor |  |
| +5 Volts monitor |  |
| _ROLL_ROT | 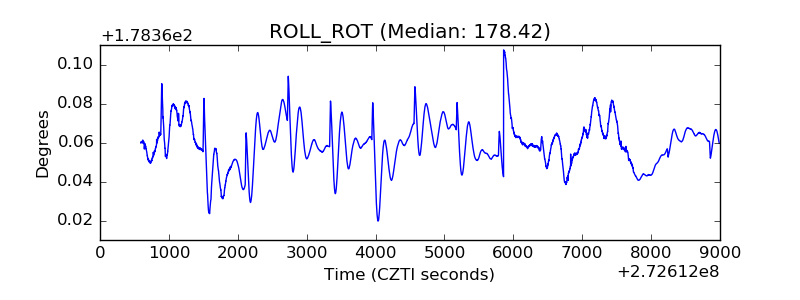 |
| _Roll_DEC | 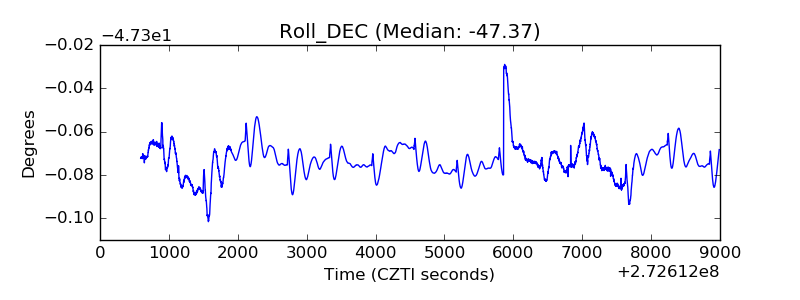 |
| _Roll_RA | 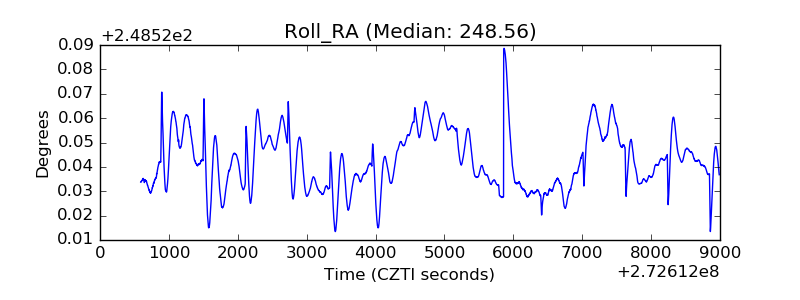 |
| Veto Counter | 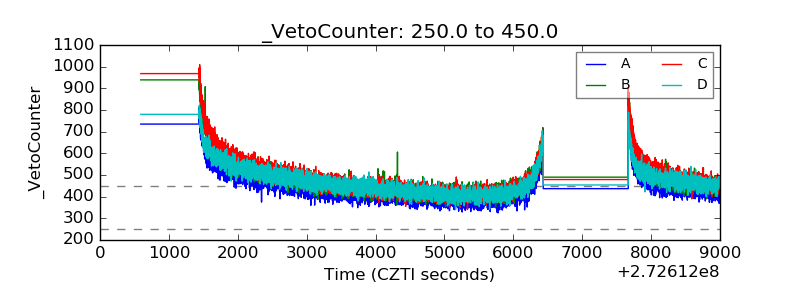 |