| Param | Original file | Final file |
|---|---|---|
| Filename | modeM0/AS1T02_084T01_9000002318_15678cztM0_level2.evt | modeM0/AS1T02_084T01_9000002318_15678cztM0_level2_quad_clean.evt |
| Size (bytes) | 461,399,040 | 93,366,720 |
| Size | 440.0 MB | 89.0 MB |
| Events in quadrant A | 3,241,784 | 594,349 |
| Events in quadrant B | 3,529,376 | 598,356 |
| Events in quadrant C | 3,378,140 | 589,989 |
| Events in quadrant D | 3,367,095 | 575,976 |
| Mode M0 | |||
|---|---|---|---|
| Quadrant | BADHDUFLAG | Total packets | Discarded packets |
| A | 0 | 13847 | 3 |
| B | 0 | 14535 | 2 |
| C | 0 | 13942 | 2 |
| D | 0 | 14408 | 2 |
| Mode M9 | |||
|---|---|---|---|
| Quadrant | BADHDUFLAG | Total packets | Discarded packets |
| A | 0 | 10 | 0 |
| B | 0 | 10 | 0 |
| C | 0 | 10 | 0 |
| D | 0 | 10 | 0 |
| Mode SS | |||
|---|---|---|---|
| Quadrant | BADHDUFLAG | Total packets | Discarded packets |
| A | 0 | 136 | 0 |
| B | 0 | 136 | 0 |
| C | 0 | 136 | 0 |
| D | 0 | 136 | 0 |
| Quadrant | Total seconds | Saturated seconds | Saturation percentage |
|---|---|---|---|
| A | 6727 | 94 | 1.397354% |
| B | 6727 | 119 | 1.768991% |
| C | 6727 | 150 | 2.229820% |
| D | 6728 | 111 | 1.649822% |
Noise dominated data is calculated using 1-second bins in cleaned event files. If a bin has >2000 counts, and if more than 50% of those come from <1% of pixels, then it is considered to be noise-dominated and hence unusable.
| Quadrant | # 1 sec bins | Bins with >0 counts | Bins with >2000 counts | High rate bins dominated by noise | Noise dominated (total time) | Noise dominated (detector-on time) | Marked lightcurve |
|---|---|---|---|---|---|---|---|
| A | 7663 | 6729 | 0 | 0 | 0.00% | 0.00% | 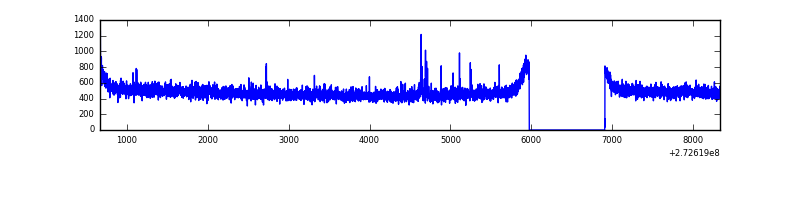 |
| B | 7663 | 6729 | 14 | 14 | 0.18% | 0.21% | 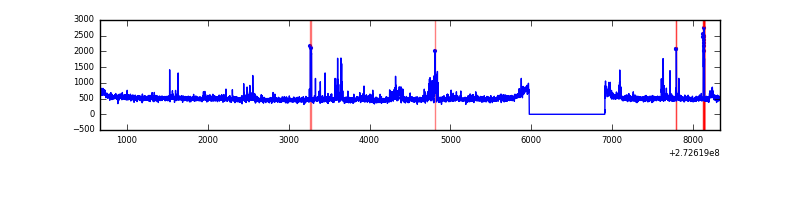 |
| C | 7663 | 6729 | 0 | 0 | 0.00% | 0.00% | 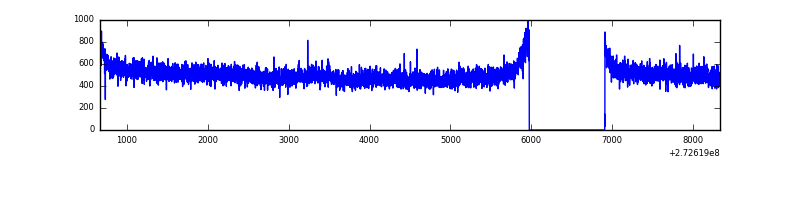 |
| D | 7664 | 6730 | 34 | 34 | 0.44% | 0.51% | 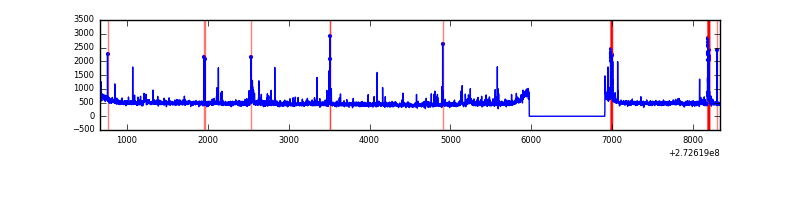 |
Top three noisy pixels from each quadrant. If the there are fewer than three noisy pixels in the level2.evt file, extra rows are filled as -1
| Pixel properties | Quadrant properties | ||||||
|---|---|---|---|---|---|---|---|
| Quadrant | DetID | PixID | Counts | Sigma | Mean | Median | Sigma |
| A | 13 | 248 | 13235 | 73.97 | 838 | 821 | 167.8 |
| A | 0 | 226 | 7273 | 38.45 | 838 | 821 | 167.8 |
| A | 12 | 194 | 6212 | 32.12 | 838 | 821 | 167.8 |
| B | 4 | 173 | 104588 | 664.42 | 833 | 813 | 156.2 |
| B | 0 | 189 | 57255 | 361.37 | 833 | 813 | 156.2 |
| B | 4 | 216 | 28968 | 180.26 | 833 | 813 | 156.2 |
| C | 14 | 238 | 127090 | 678.34 | 806 | 811 | 186.2 |
| C | 3 | 233 | 104032 | 554.47 | 806 | 811 | 186.2 |
| C | 13 | 61 | 5829 | 26.96 | 806 | 811 | 186.2 |
| D | 10 | 70 | 105379 | 520.46 | 819 | 797 | 200.9 |
| D | 1 | 52 | 79275 | 390.55 | 819 | 797 | 200.9 |
| D | 2 | 234 | 25268 | 121.78 | 819 | 797 | 200.9 |
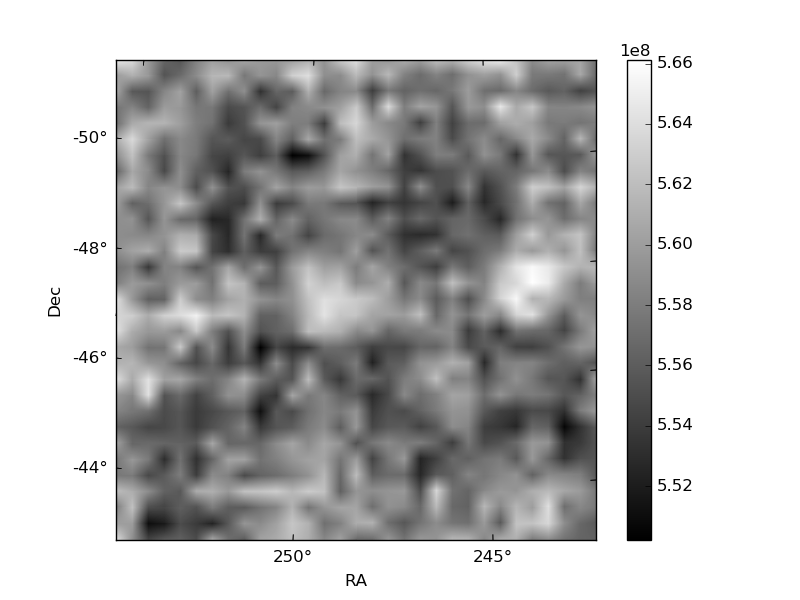
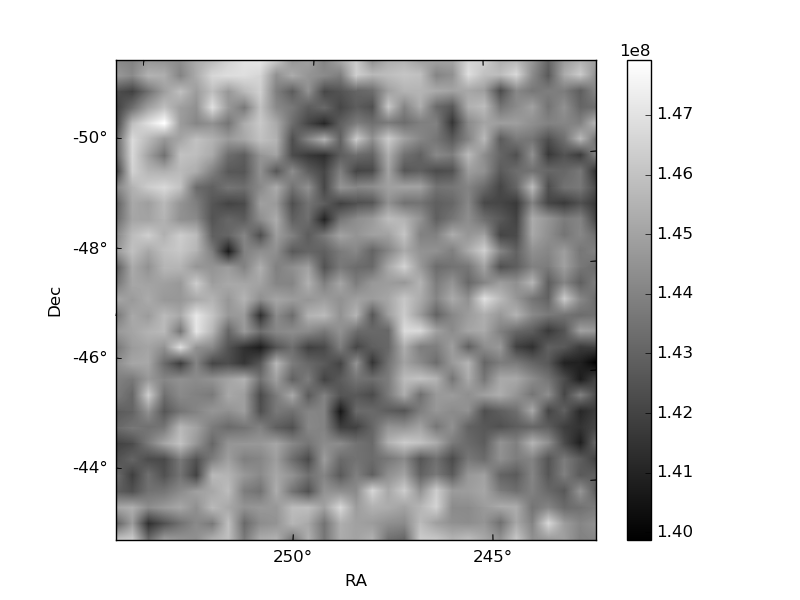
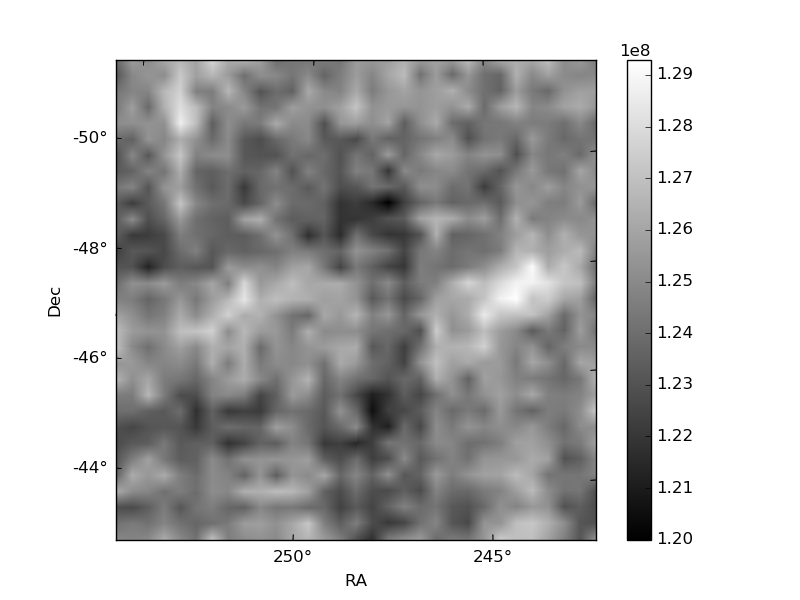
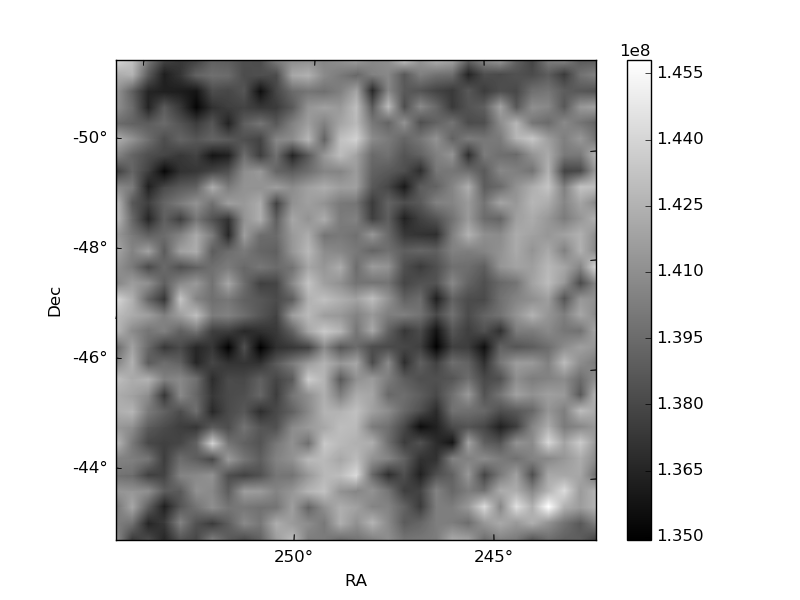
Histogram calculated using DETX and DETY for each event in the final _common_clean file
| Quadrant A | 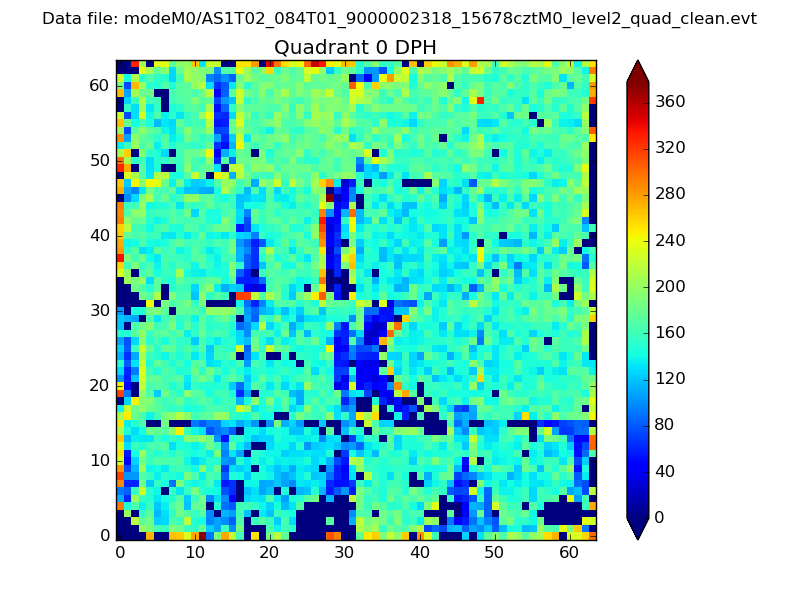 |
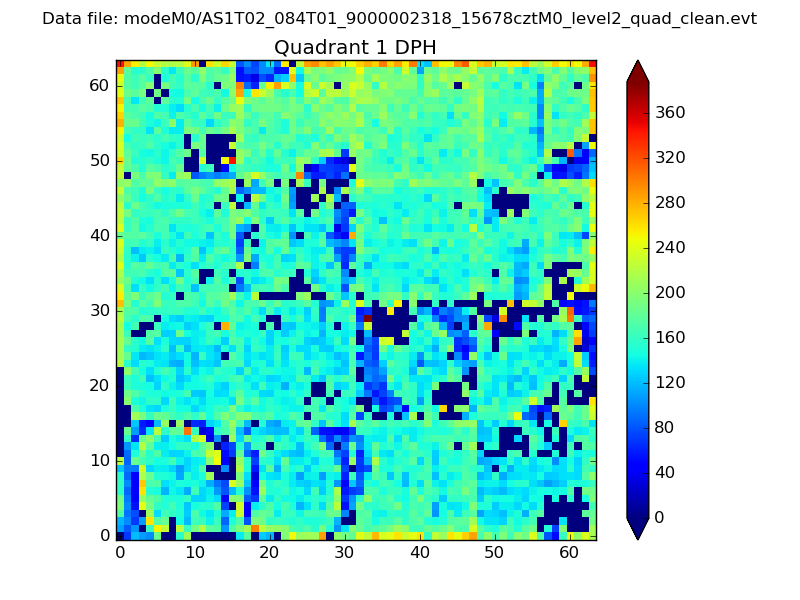 |
Quadrant B |
|---|---|---|---|
| Quadrant D | 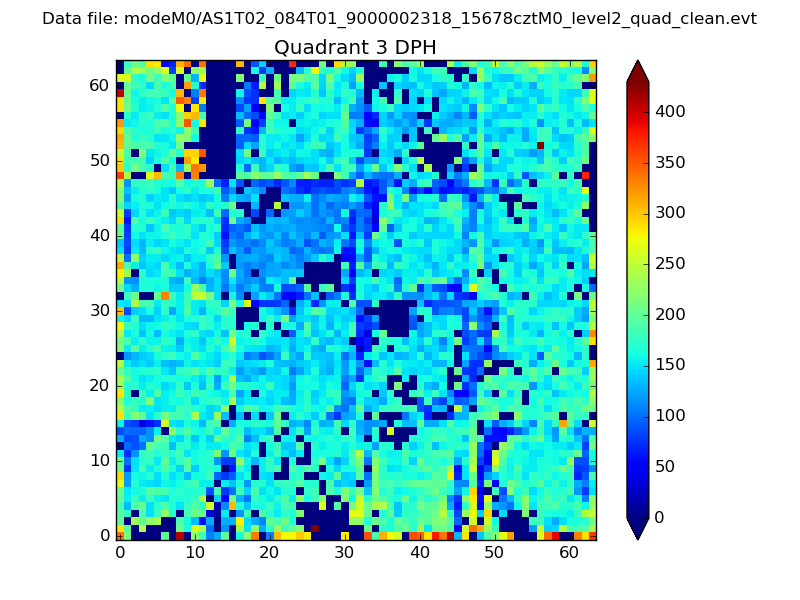 |
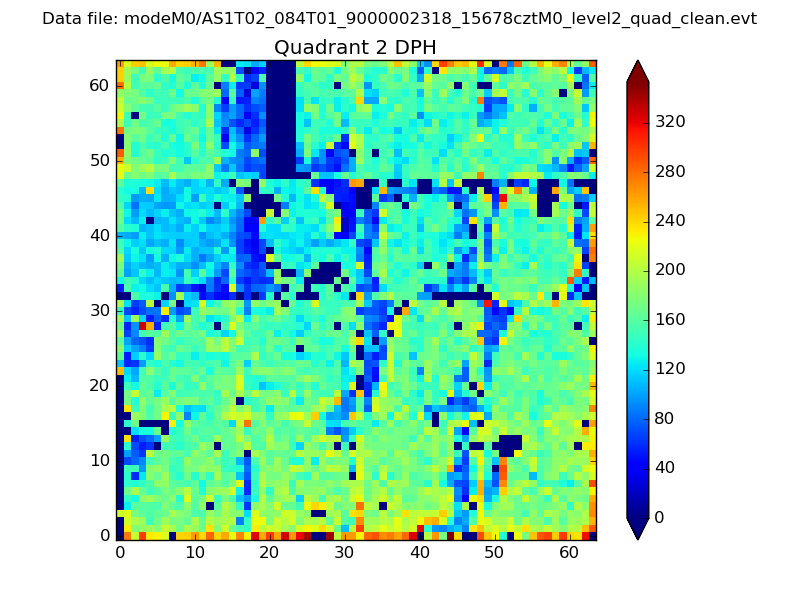 |
Quadrant C |
| Plot type | Count rate plots | Images |
|---|---|---|
| Comparison with Poisson distribution Blue bars denote a histogram of data divided into 1 sec bins. Red curve is a Poisson curve with rate = median count rate of data. |
 |
 |
| Quadrant-wise count rates Data is divided into 100 sec bins |
 |
|
| Module-wise count rates for Quadrant A Data is divided into 100 sec bins |
 |
 |
| Module-wise count rates for Quadrant B Data is divided into 100 sec bins |
 |
 |
| Module-wise count rates for Quadrant C Data is divided into 100 sec bins |
 |
 |
| Module-wise count rates for Quadrant D Data is divided into 100 sec bins |
 |
 |
| Parameter | Plot |
|---|---|
| CZT HV Monitor |  |
| D_VDD | 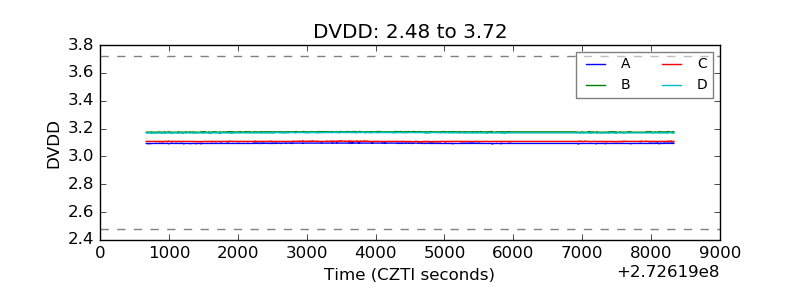 |
| Temperature 1 | 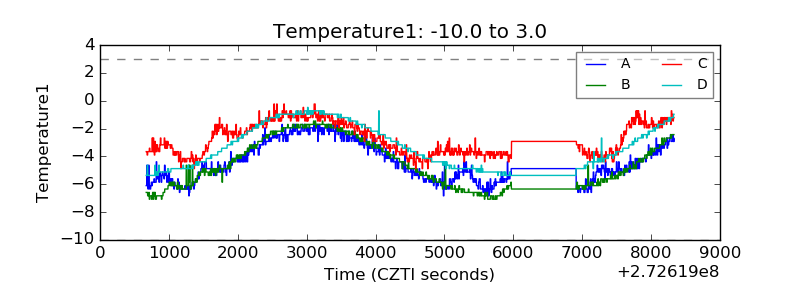 |
| Veto HV Monitor | 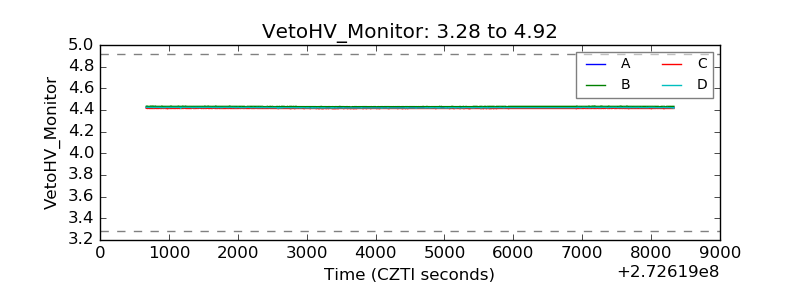 |
| Veto LLD | 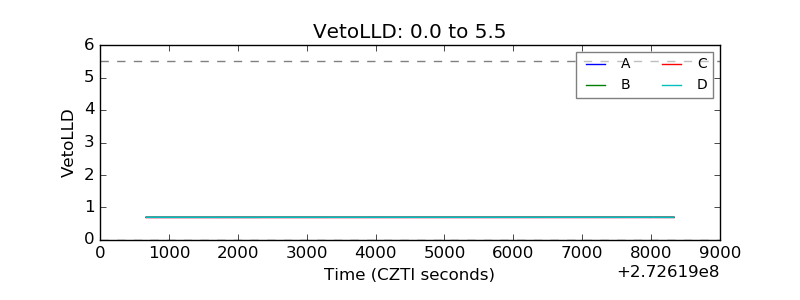 |
| Alpha Counter |  |
| _CPM_Rate |  |
| CZT Counter | 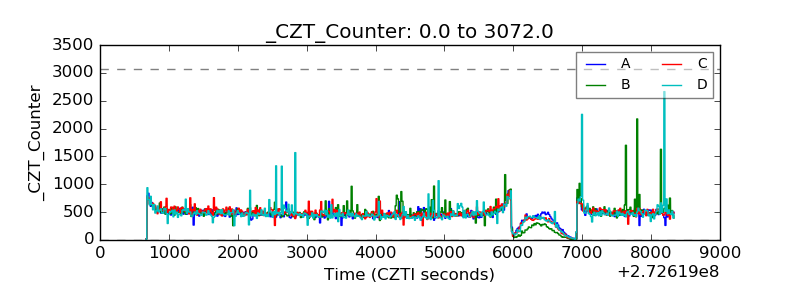 |
| +2.5 Volts monitor |  |
| +5 Volts monitor |  |
| _ROLL_ROT |  |
| _Roll_DEC |  |
| _Roll_RA | 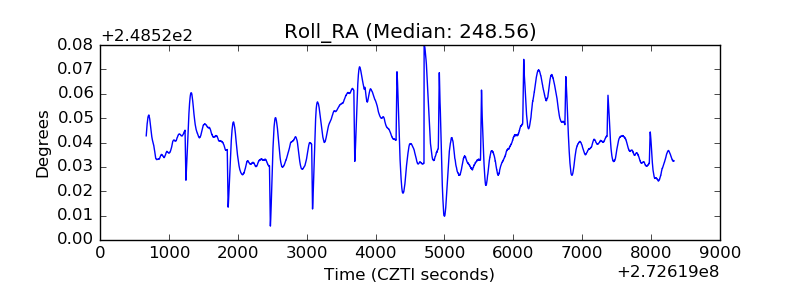 |
| Veto Counter |  |