| Param | Original file | Final file |
|---|---|---|
| Filename | modeM0/AS1T02_084T01_9000002318_15679cztM0_level2.evt | modeM0/AS1T02_084T01_9000002318_15679cztM0_level2_quad_clean.evt |
| Size (bytes) | 486,475,200 | 98,150,400 |
| Size | 463.9 MB | 93.6 MB |
| Events in quadrant A | 3,414,120 | 622,525 |
| Events in quadrant B | 3,720,307 | 628,558 |
| Events in quadrant C | 3,459,453 | 617,331 |
| Events in quadrant D | 3,650,966 | 604,021 |
| Mode M0 | |||
|---|---|---|---|
| Quadrant | BADHDUFLAG | Total packets | Discarded packets |
| A | 0 | 14833 | 3 |
| B | 0 | 15521 | 2 |
| C | 0 | 14846 | 2 |
| D | 0 | 15753 | 2 |
| Mode M9 | |||
|---|---|---|---|
| Quadrant | BADHDUFLAG | Total packets | Discarded packets |
| A | 0 | 8 | 0 |
| B | 0 | 8 | 0 |
| C | 0 | 8 | 0 |
| D | 0 | 9 | 0 |
| Mode SS | |||
|---|---|---|---|
| Quadrant | BADHDUFLAG | Total packets | Discarded packets |
| A | 0 | 144 | 0 |
| B | 0 | 144 | 0 |
| C | 0 | 144 | 0 |
| D | 0 | 144 | 0 |
| Quadrant | Total seconds | Saturated seconds | Saturation percentage |
|---|---|---|---|
| A | 7186 | 143 | 1.989981% |
| B | 7186 | 153 | 2.129140% |
| C | 7186 | 167 | 2.323963% |
| D | 7186 | 168 | 2.337879% |
Noise dominated data is calculated using 1-second bins in cleaned event files. If a bin has >2000 counts, and if more than 50% of those come from <1% of pixels, then it is considered to be noise-dominated and hence unusable.
| Quadrant | # 1 sec bins | Bins with >0 counts | Bins with >2000 counts | High rate bins dominated by noise | Noise dominated (total time) | Noise dominated (detector-on time) | Marked lightcurve |
|---|---|---|---|---|---|---|---|
| A | 7677 | 7188 | 2 | 2 | 0.03% | 0.03% | 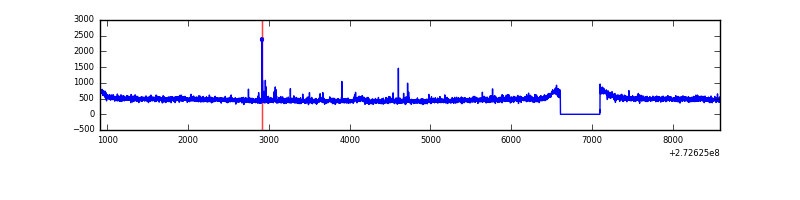 |
| B | 7677 | 7188 | 14 | 14 | 0.18% | 0.19% | 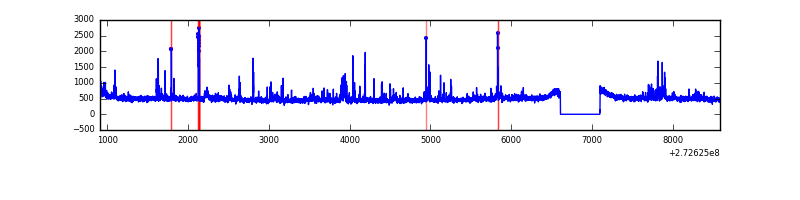 |
| C | 7677 | 7188 | 0 | 0 | 0.00% | 0.00% | 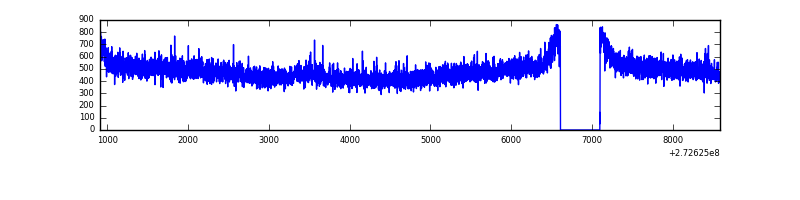 |
| D | 7677 | 7188 | 53 | 53 | 0.69% | 0.74% | 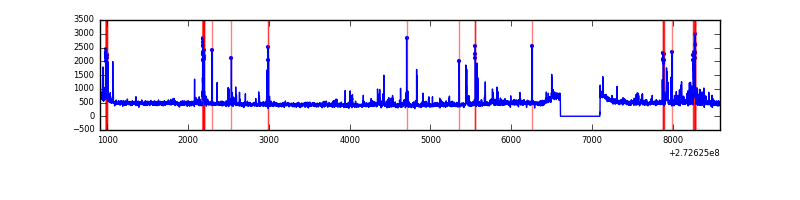 |
Top three noisy pixels from each quadrant. If the there are fewer than three noisy pixels in the level2.evt file, extra rows are filled as -1
| Pixel properties | Quadrant properties | ||||||
|---|---|---|---|---|---|---|---|
| Quadrant | DetID | PixID | Counts | Sigma | Mean | Median | Sigma |
| A | 13 | 248 | 31418 | 170.85 | 880 | 859 | 178.9 |
| A | 0 | 226 | 7732 | 38.42 | 880 | 859 | 178.9 |
| A | 12 | 194 | 6600 | 32.1 | 880 | 859 | 178.9 |
| B | 4 | 173 | 148871 | 884.75 | 875 | 854 | 167.3 |
| B | 0 | 189 | 30797 | 178.98 | 875 | 854 | 167.3 |
| B | 3 | 64 | 28862 | 167.41 | 875 | 854 | 167.3 |
| C | 14 | 238 | 129130 | 653.56 | 845 | 851 | 196.3 |
| C | 3 | 233 | 25892 | 127.58 | 845 | 851 | 196.3 |
| C | 13 | 61 | 5971 | 26.09 | 845 | 851 | 196.3 |
| D | 1 | 52 | 139554 | 671.54 | 856 | 832 | 206.6 |
| D | 12 | 110 | 114377 | 549.66 | 856 | 832 | 206.6 |
| D | 10 | 70 | 111473 | 535.6 | 856 | 832 | 206.6 |
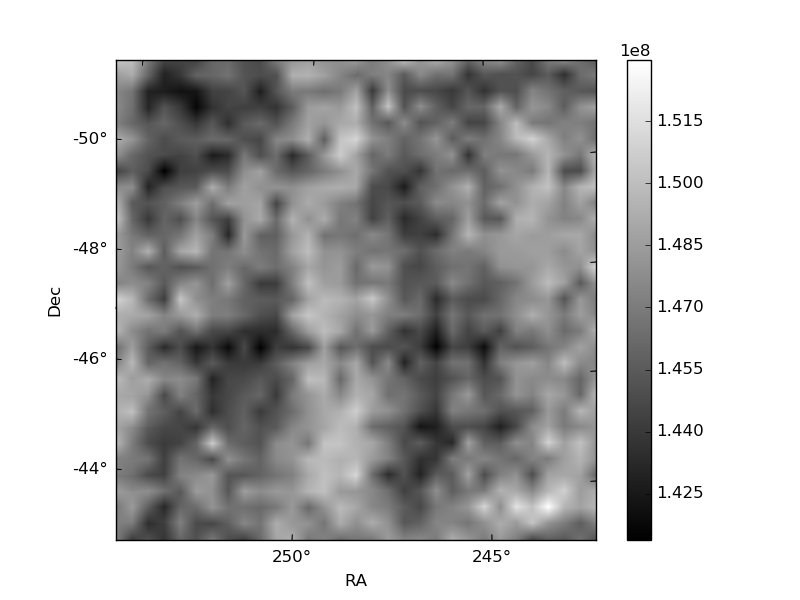
Histogram calculated using DETX and DETY for each event in the final _common_clean file
| Quadrant A | 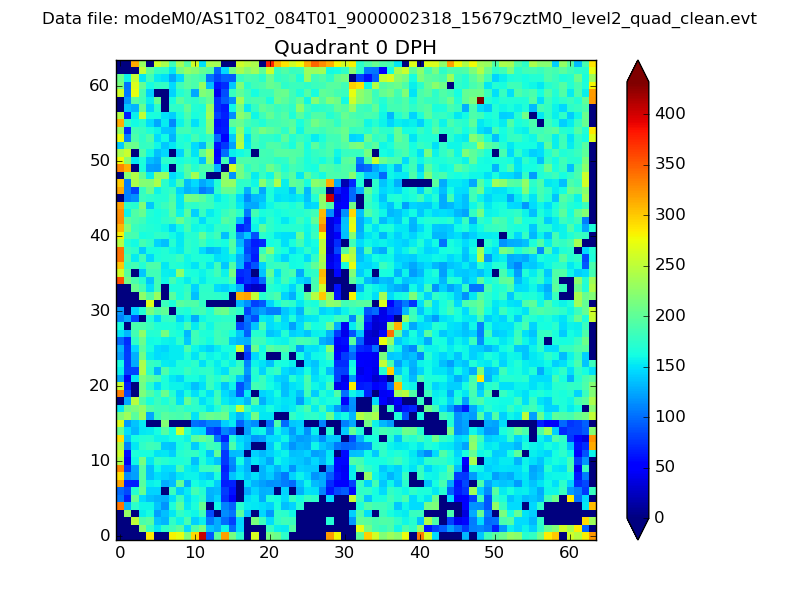 |
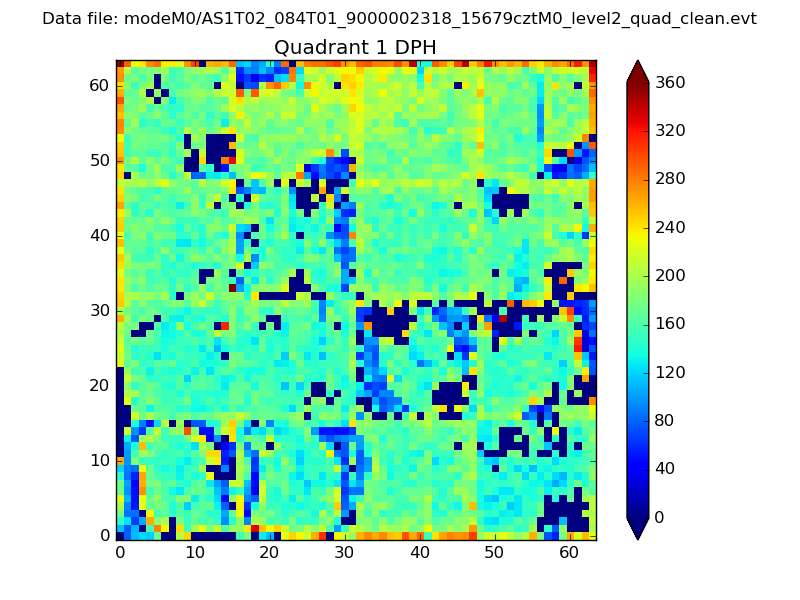 |
Quadrant B |
|---|---|---|---|
| Quadrant D |  |
 |
Quadrant C |
| Plot type | Count rate plots | Images |
|---|---|---|
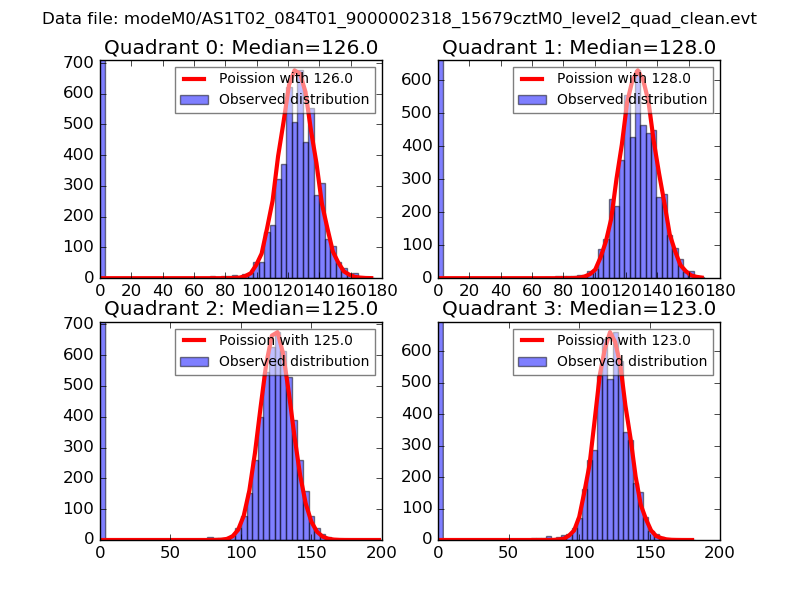
| Comparison with Poisson distribution Blue bars denote a histogram of data divided into 1 sec bins. Red curve is a Poisson curve with rate = median count rate of data. |
 |
 |
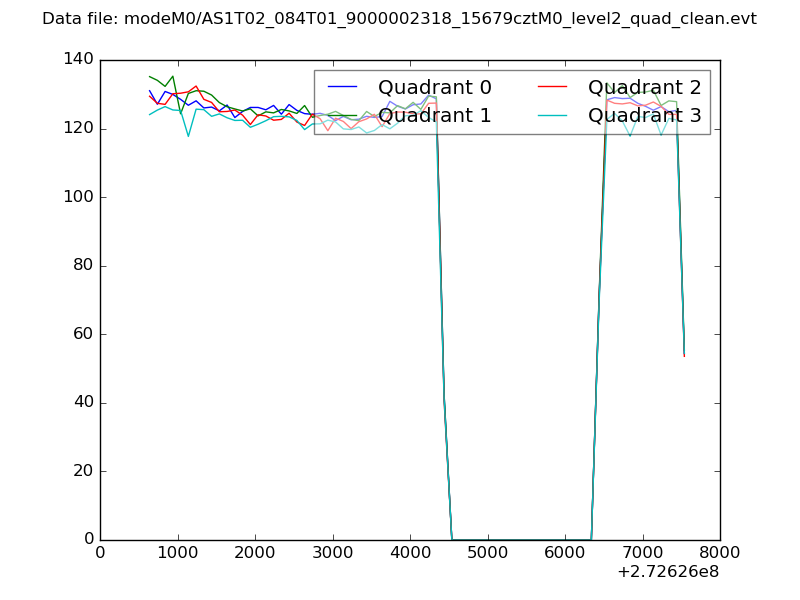
| Quadrant-wise count rates Data is divided into 100 sec bins |
 |
|
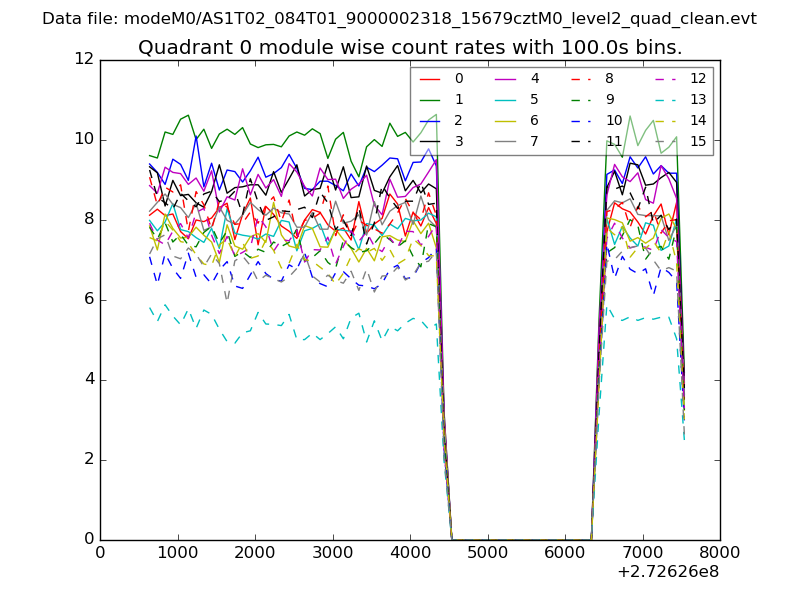
| Module-wise count rates for Quadrant A Data is divided into 100 sec bins |
 |
 |
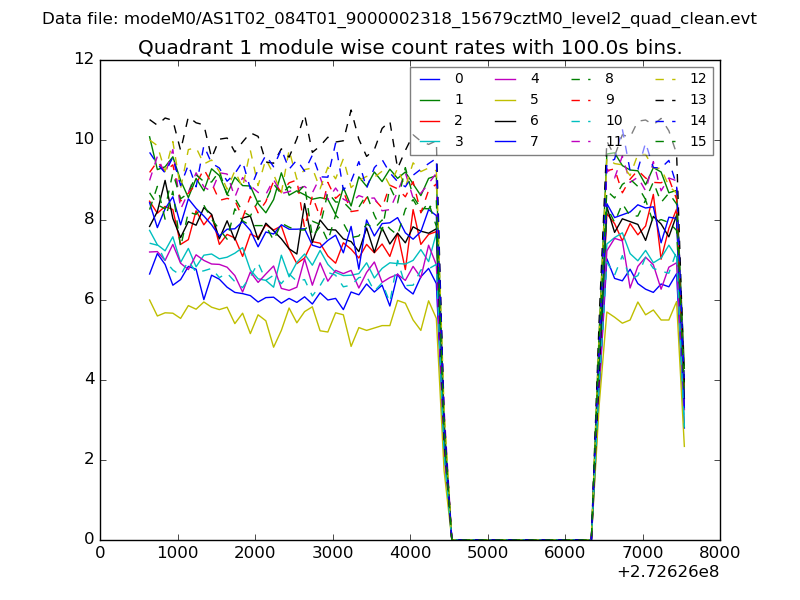
| Module-wise count rates for Quadrant B Data is divided into 100 sec bins |
 |
 |
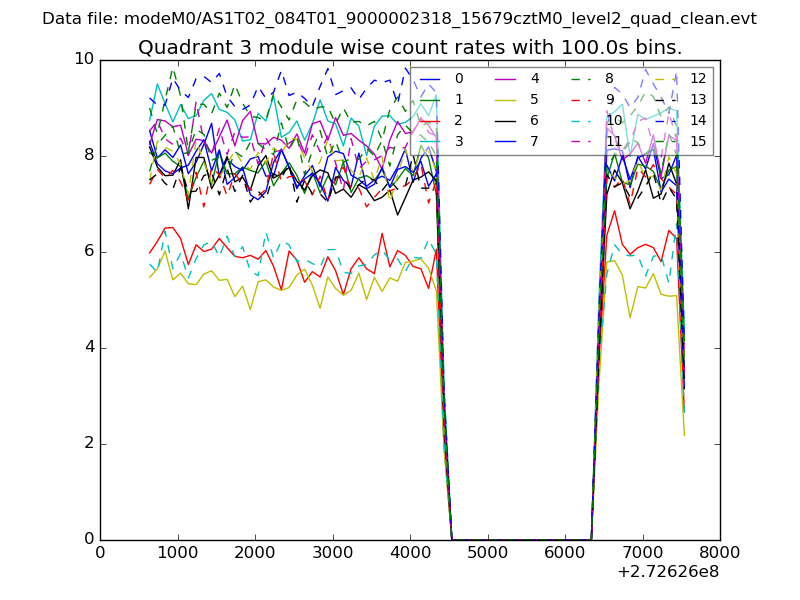
| Module-wise count rates for Quadrant C Data is divided into 100 sec bins |
 |
 |
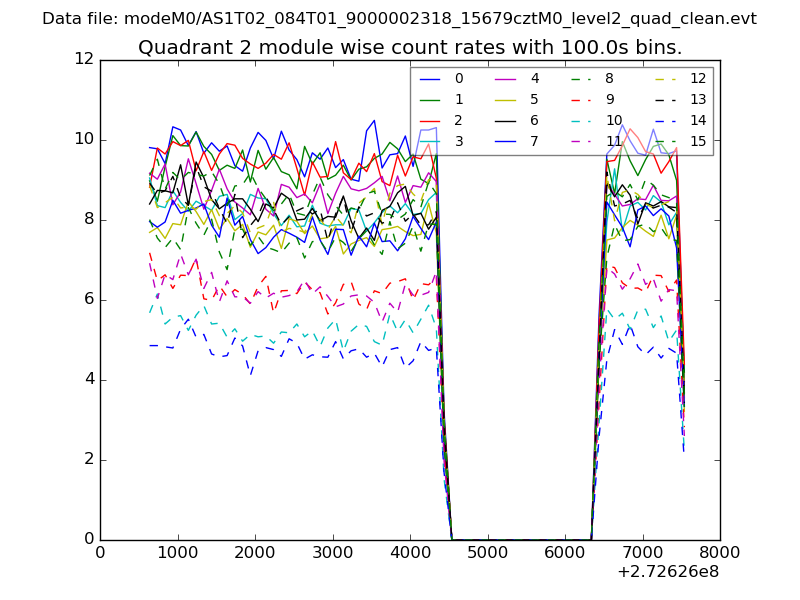
| Module-wise count rates for Quadrant D Data is divided into 100 sec bins |
 |
 |
| Parameter | Plot |
|---|---|
| CZT HV Monitor | 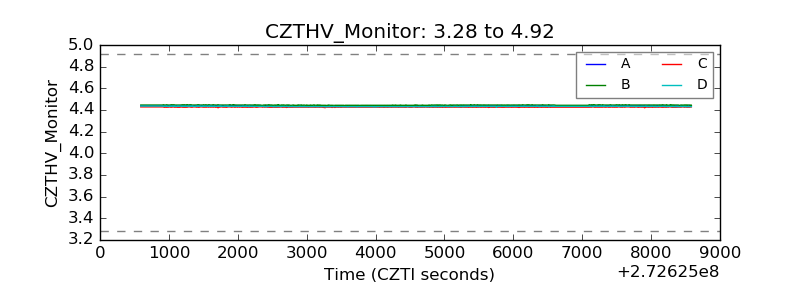 |
| D_VDD | 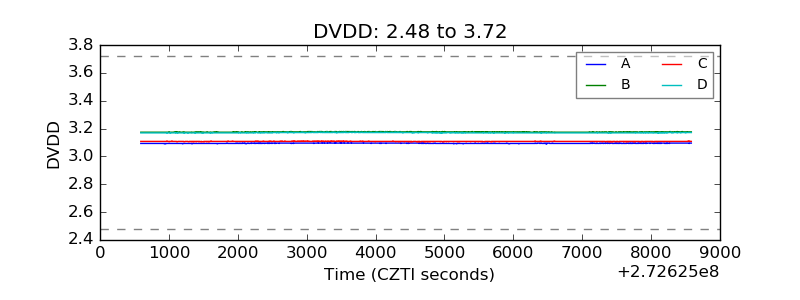 |
| Temperature 1 | 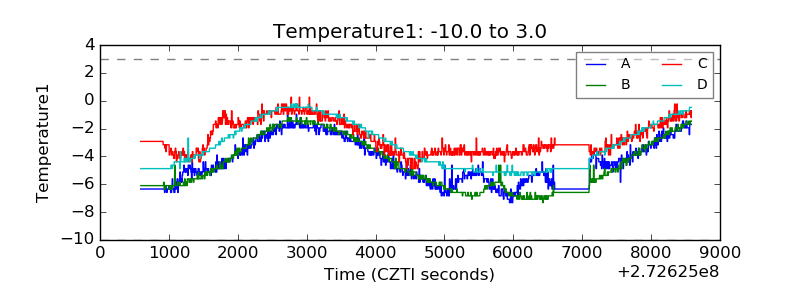 |
| Veto HV Monitor | 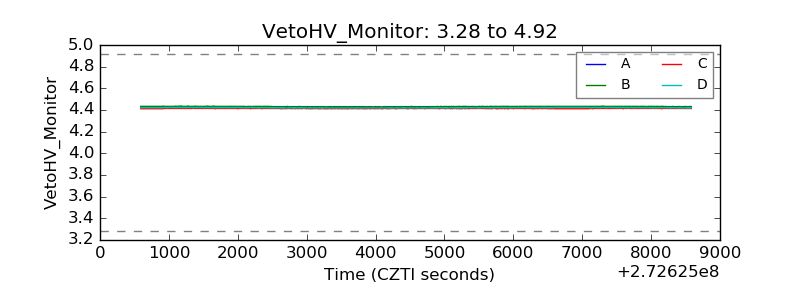 |
| Veto LLD | 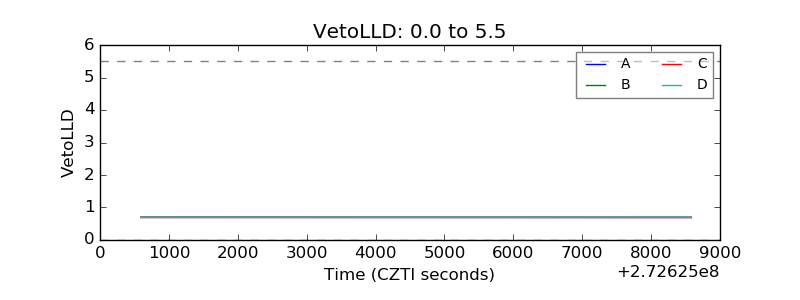 |
| Alpha Counter | 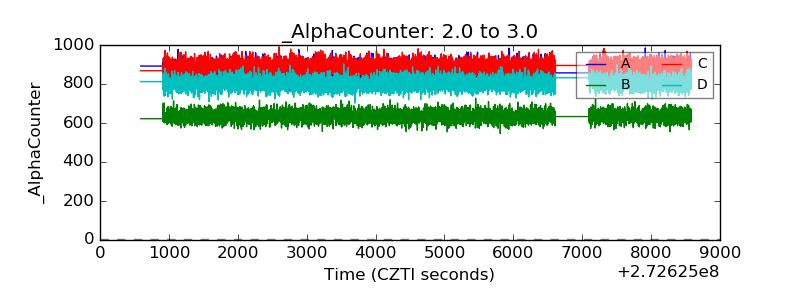 |
| _CPM_Rate | 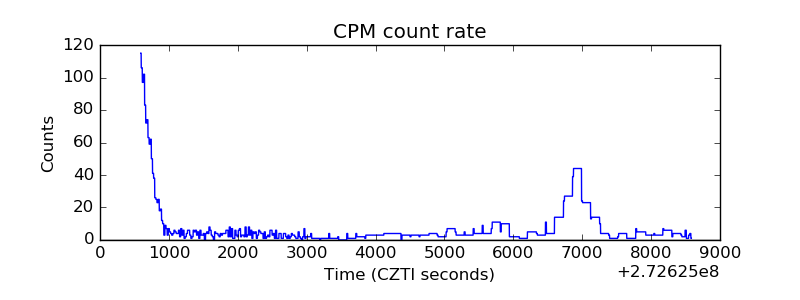 |
| CZT Counter | 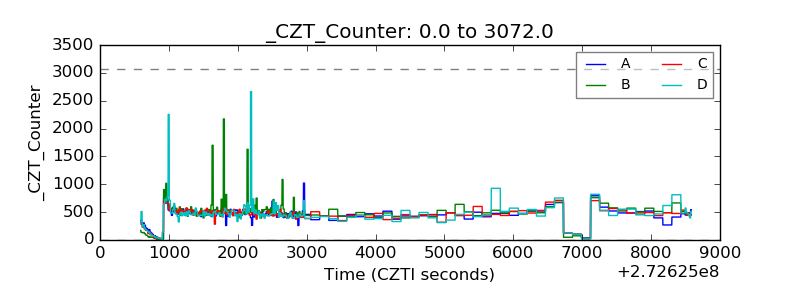 |
| +2.5 Volts monitor |  |
| +5 Volts monitor |  |
| _ROLL_ROT | 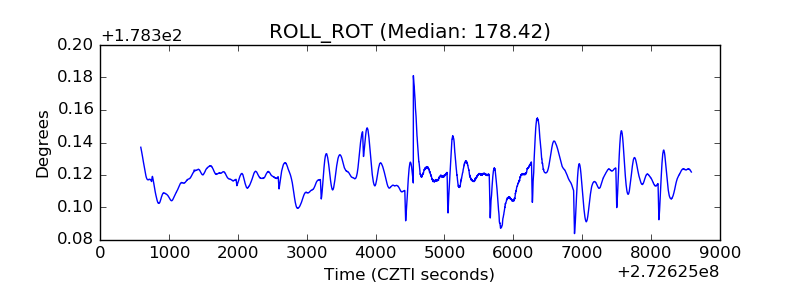 |
| _Roll_DEC | 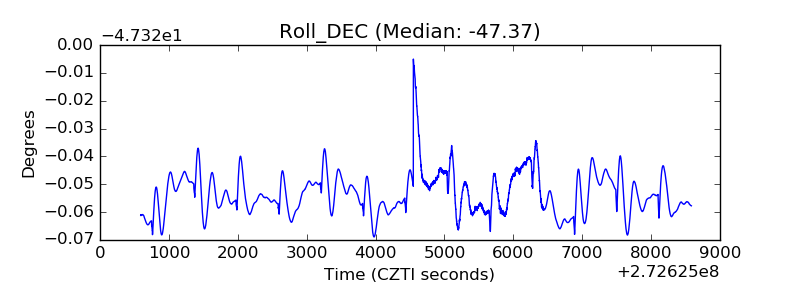 |
| _Roll_RA | 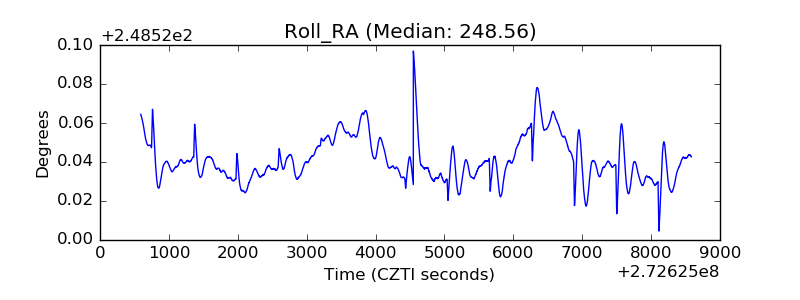 |
| Veto Counter | 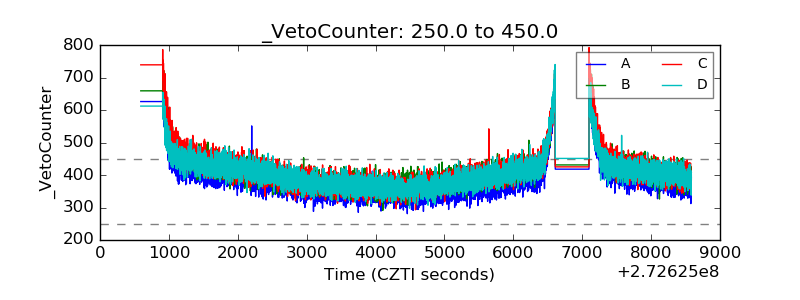 |