| Param | Original file | Final file |
|---|---|---|
| Filename | modeM0/AS1T02_084T01_9000002318_15680cztM0_level2.evt | modeM0/AS1T02_084T01_9000002318_15680cztM0_level2_quad_clean.evt |
| Size (bytes) | 464,751,360 | 97,640,640 |
| Size | 443.2 MB | 93.1 MB |
| Events in quadrant A | 3,411,645 | 619,585 |
| Events in quadrant B | 3,418,575 | 633,378 |
| Events in quadrant C | 3,256,679 | 619,450 |
| Events in quadrant D | 3,521,708 | 606,694 |
| Mode M0 | |||
|---|---|---|---|
| Quadrant | BADHDUFLAG | Total packets | Discarded packets |
| A | 0 | 14743 | 2 |
| B | 0 | 14571 | 1 |
| C | 0 | 14251 | 1 |
| D | 0 | 15149 | 1 |
| Mode M9 | |||
|---|---|---|---|
| Quadrant | BADHDUFLAG | Total packets | Discarded packets |
| A | 0 | 2 | 0 |
| B | 0 | 2 | 0 |
| C | 0 | 2 | 0 |
| D | 0 | 2 | 0 |
| Mode SS | |||
|---|---|---|---|
| Quadrant | BADHDUFLAG | Total packets | Discarded packets |
| A | 0 | 140 | 0 |
| B | 0 | 140 | 0 |
| C | 0 | 140 | 0 |
| D | 0 | 140 | 0 |
| Quadrant | Total seconds | Saturated seconds | Saturation percentage |
|---|---|---|---|
| A | 6857 | 200 | 2.916727% |
| B | 6857 | 106 | 1.545866% |
| C | 6857 | 116 | 1.691702% |
| D | 6857 | 113 | 1.647951% |
Noise dominated data is calculated using 1-second bins in cleaned event files. If a bin has >2000 counts, and if more than 50% of those come from <1% of pixels, then it is considered to be noise-dominated and hence unusable.
| Quadrant | # 1 sec bins | Bins with >0 counts | Bins with >2000 counts | High rate bins dominated by noise | Noise dominated (total time) | Noise dominated (detector-on time) | Marked lightcurve |
|---|---|---|---|---|---|---|---|
| A | 7103 | 6859 | 83 | 83 | 1.17% | 1.21% | 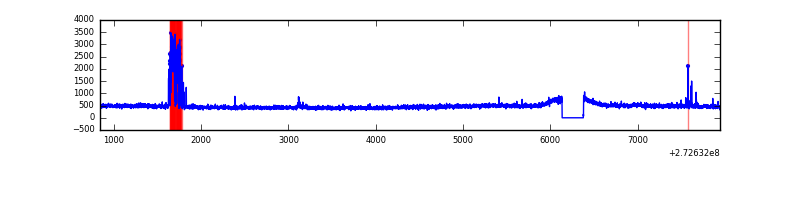 |
| B | 7103 | 6859 | 0 | 0 | 0.00% | 0.00% | 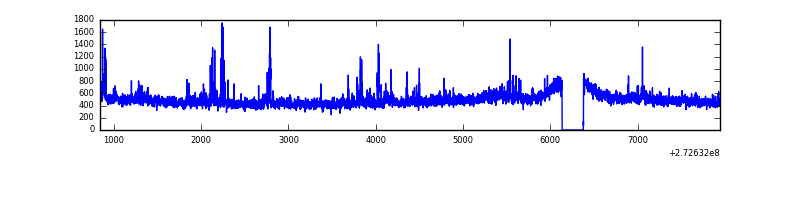 |
| C | 7103 | 6859 | 3 | 3 | 0.04% | 0.04% | 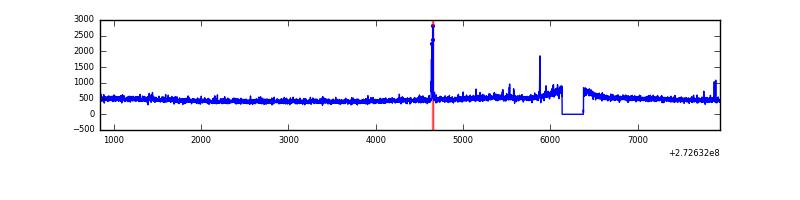 |
| D | 7103 | 6859 | 42 | 42 | 0.59% | 0.61% | 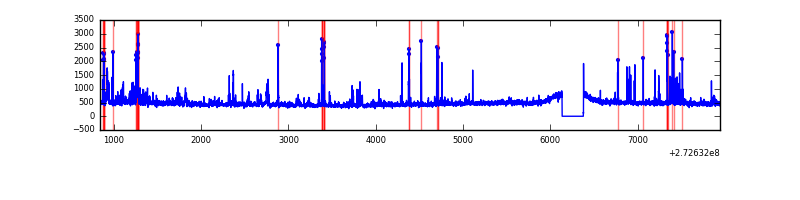 |
Top three noisy pixels from each quadrant. If the there are fewer than three noisy pixels in the level2.evt file, extra rows are filled as -1
| Pixel properties | Quadrant properties | ||||||
|---|---|---|---|---|---|---|---|
| Quadrant | DetID | PixID | Counts | Sigma | Mean | Median | Sigma |
| A | 13 | 248 | 257715 | 1534.83 | 818 | 799 | 167.4 |
| A | 13 | 210 | 9174 | 50.03 | 818 | 799 | 167.4 |
| A | 0 | 226 | 7324 | 38.98 | 818 | 799 | 167.4 |
| B | 4 | 173 | 77078 | 484.25 | 821 | 802 | 157.5 |
| B | 0 | 214 | 35669 | 221.36 | 821 | 802 | 157.5 |
| B | 12 | 111 | 18025 | 109.34 | 821 | 802 | 157.5 |
| C | 14 | 238 | 121110 | 653.28 | 790 | 793 | 184.2 |
| C | 9 | 54 | 31936 | 169.09 | 790 | 793 | 184.2 |
| C | 3 | 233 | 11426 | 57.73 | 790 | 793 | 184.2 |
| D | 1 | 52 | 226089 | 1140.99 | 805 | 780 | 197.5 |
| D | 12 | 110 | 150989 | 760.67 | 805 | 780 | 197.5 |
| D | 2 | 120 | 46011 | 229.05 | 805 | 780 | 197.5 |
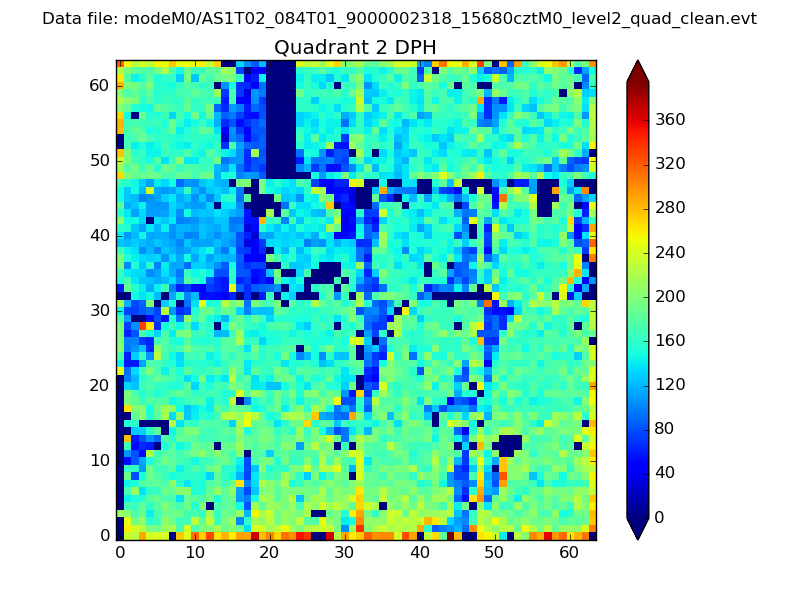
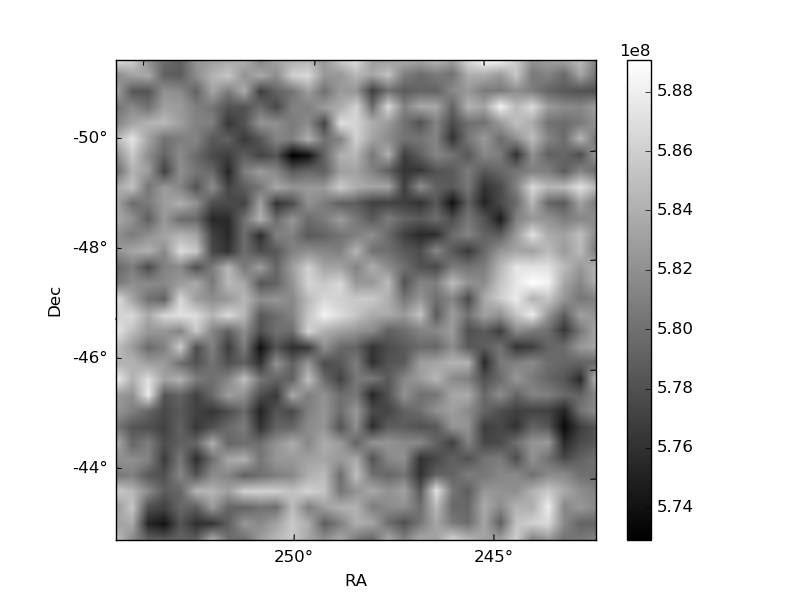
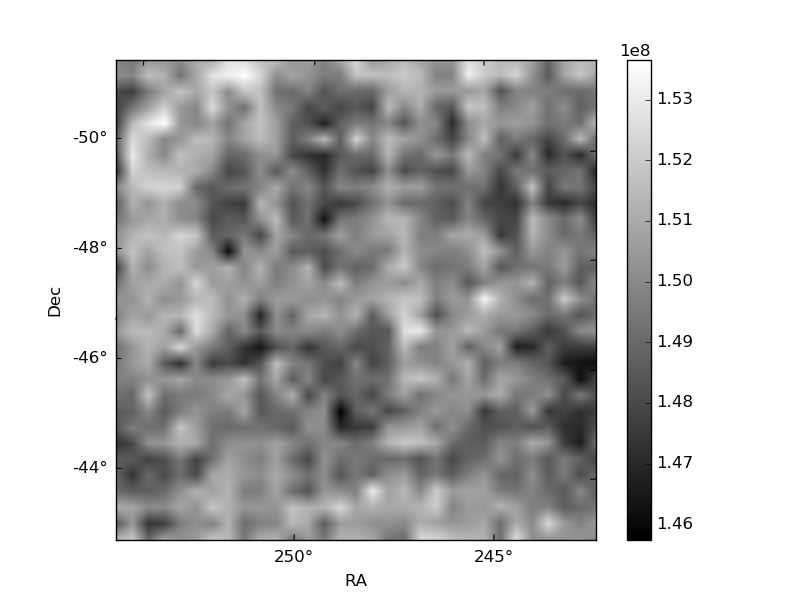
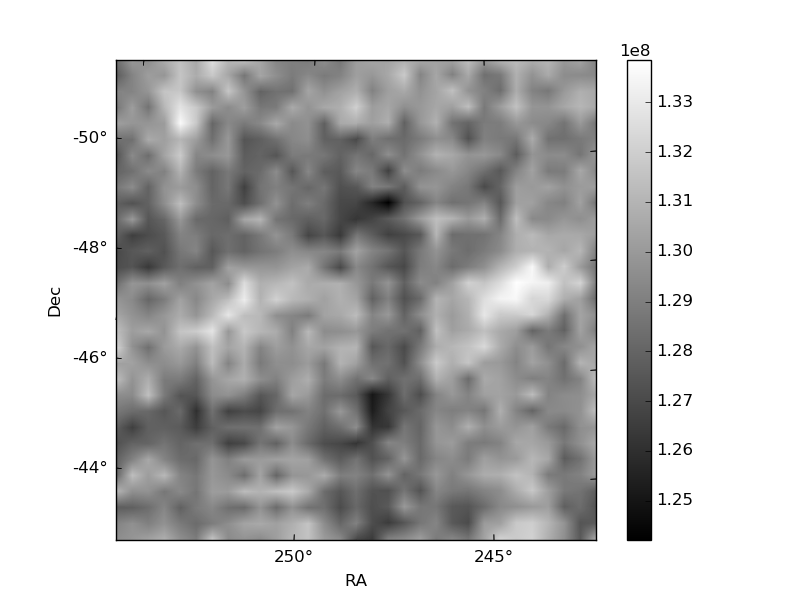
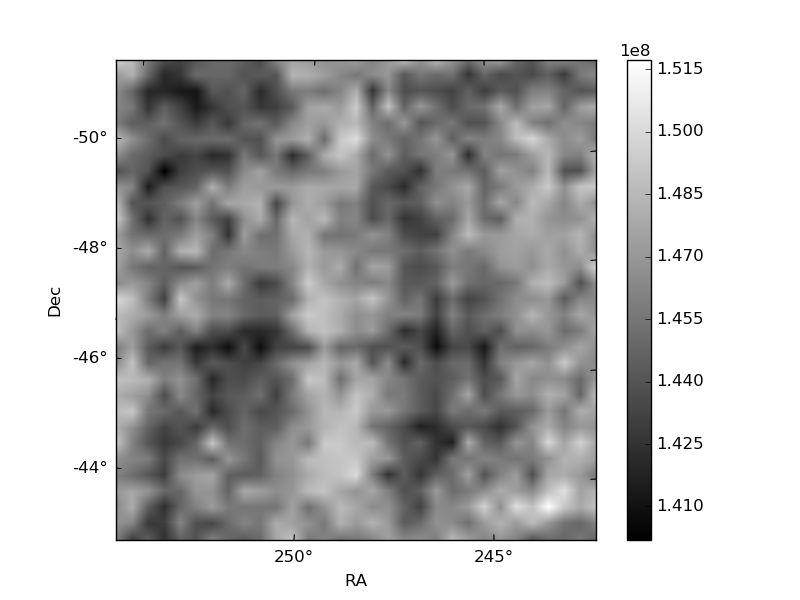
Histogram calculated using DETX and DETY for each event in the final _common_clean file
| Quadrant A | 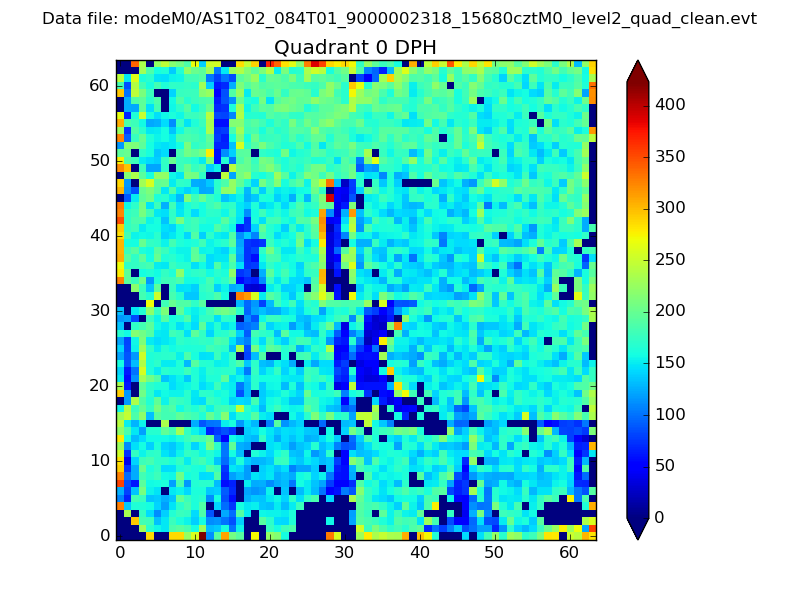 |
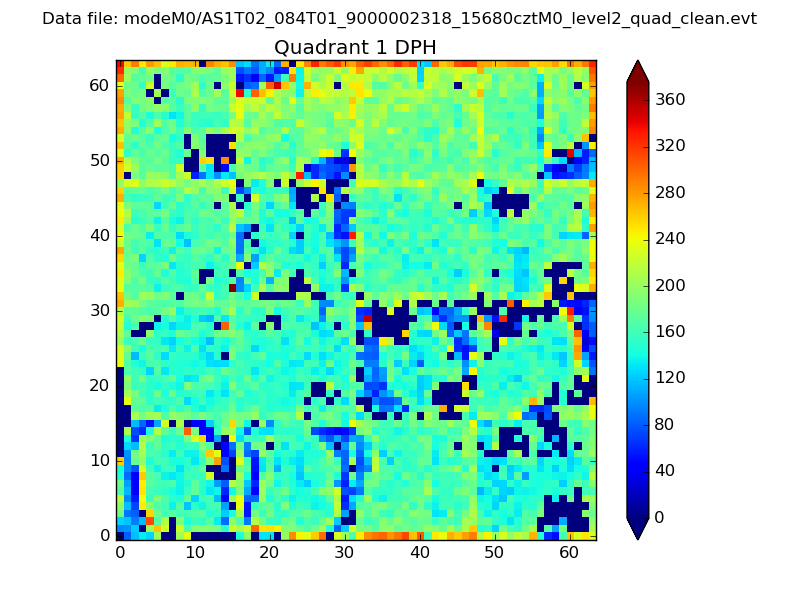 |
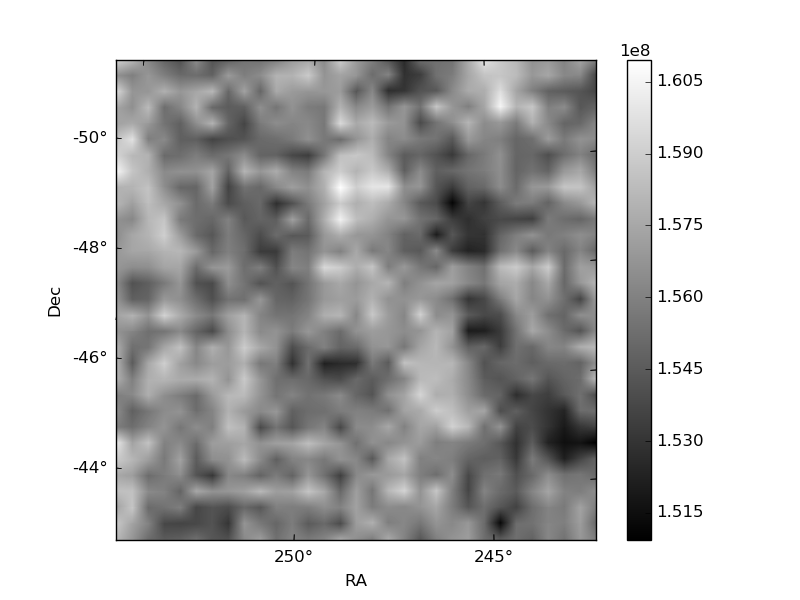
Quadrant B |
|---|---|---|---|
| Quadrant D | 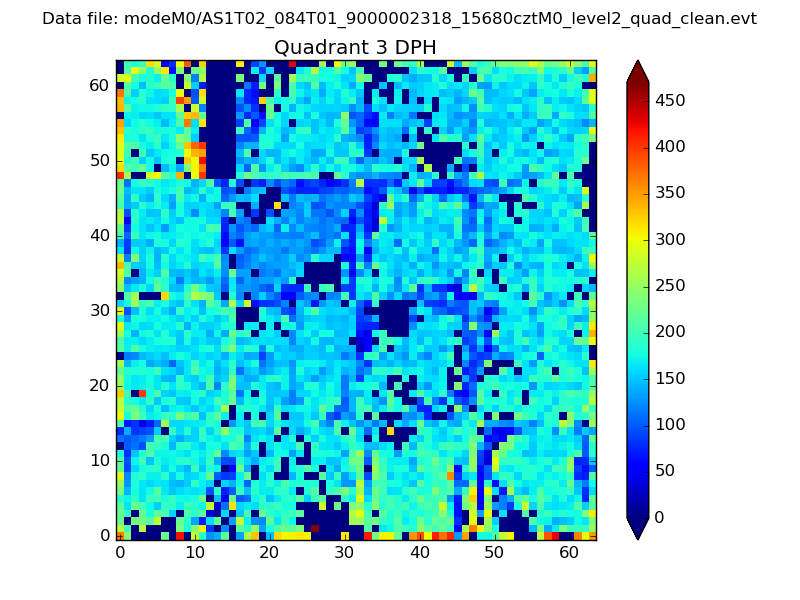 |
 |
Quadrant C |
| Plot type | Count rate plots | Images |
|---|---|---|
| Comparison with Poisson distribution Blue bars denote a histogram of data divided into 1 sec bins. Red curve is a Poisson curve with rate = median count rate of data. |
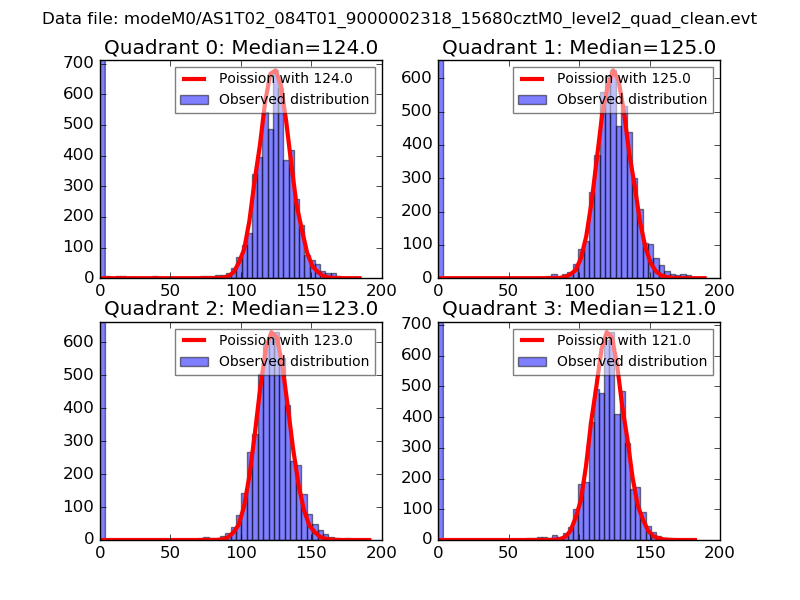 |
 |
| Quadrant-wise count rates Data is divided into 100 sec bins |
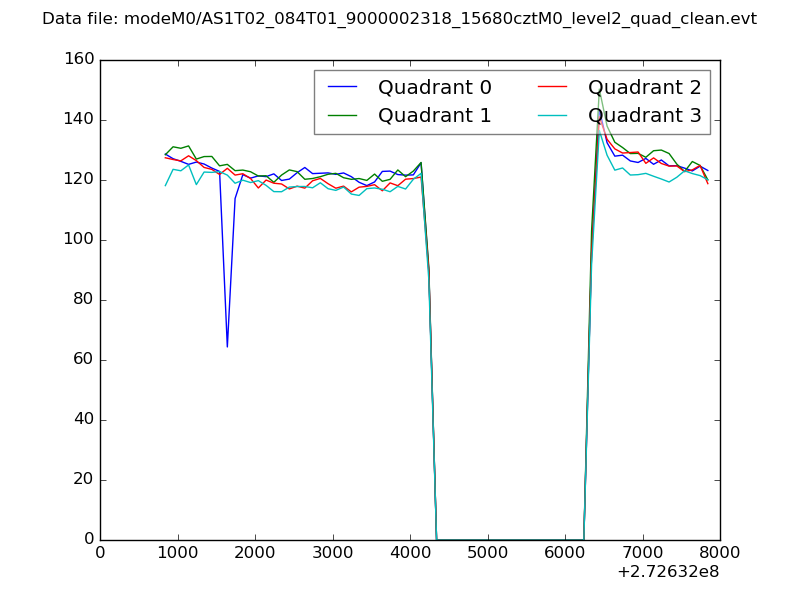 |
|
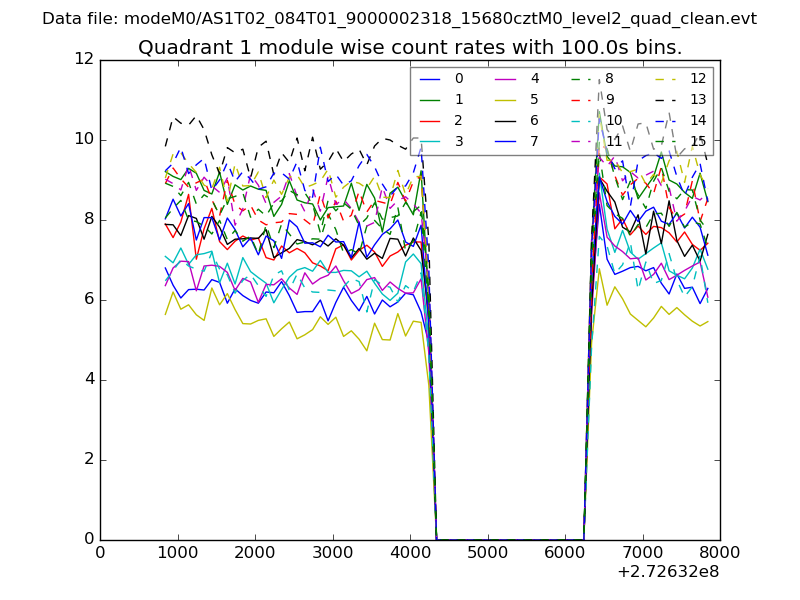
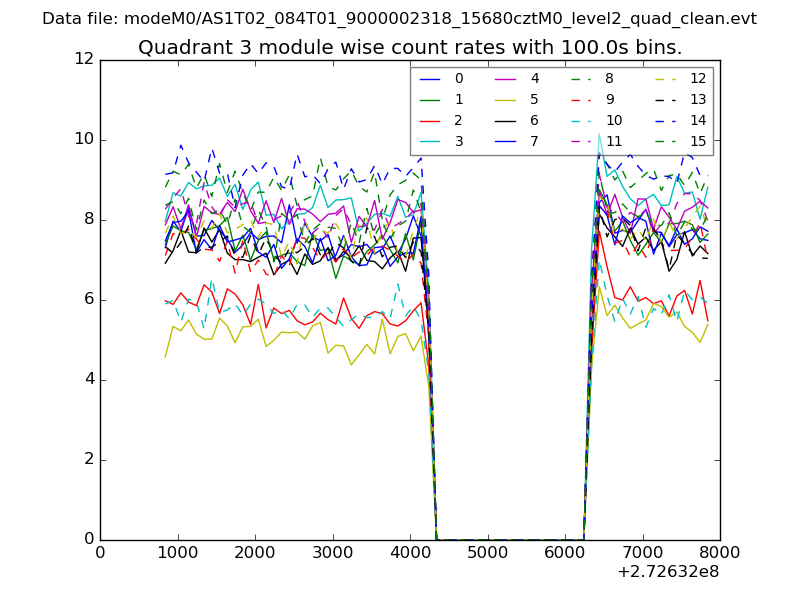
| Module-wise count rates for Quadrant A Data is divided into 100 sec bins |
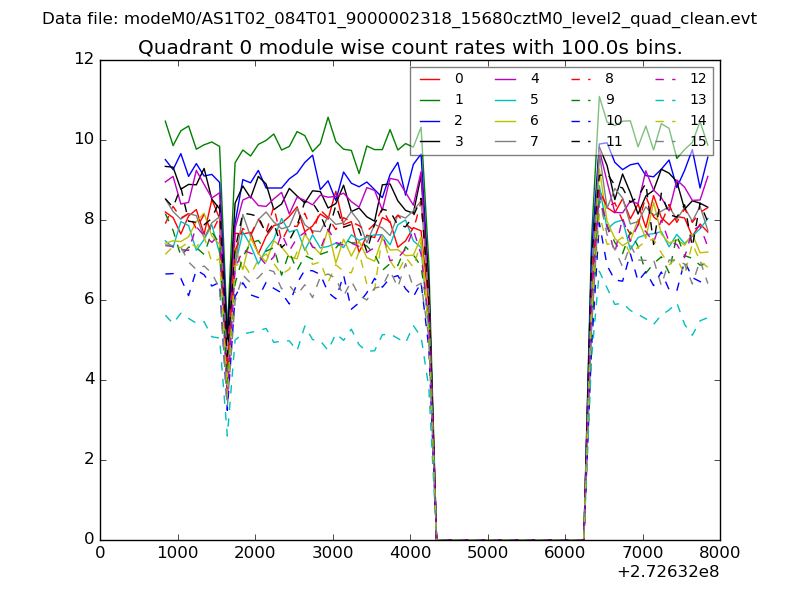 |
 |
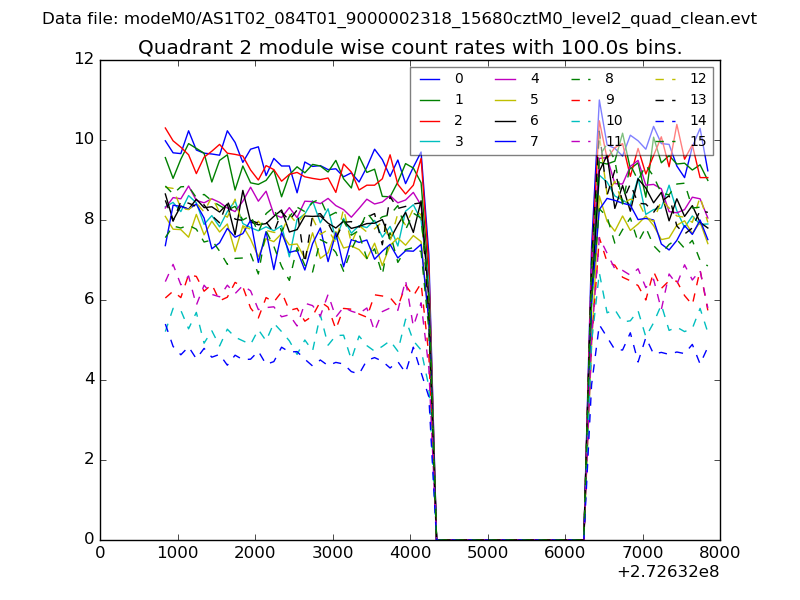
| Module-wise count rates for Quadrant B Data is divided into 100 sec bins |
 |
 |
| Module-wise count rates for Quadrant C Data is divided into 100 sec bins |
 |
 |
| Module-wise count rates for Quadrant D Data is divided into 100 sec bins |
 |
 |
| Parameter | Plot |
|---|---|
| CZT HV Monitor | 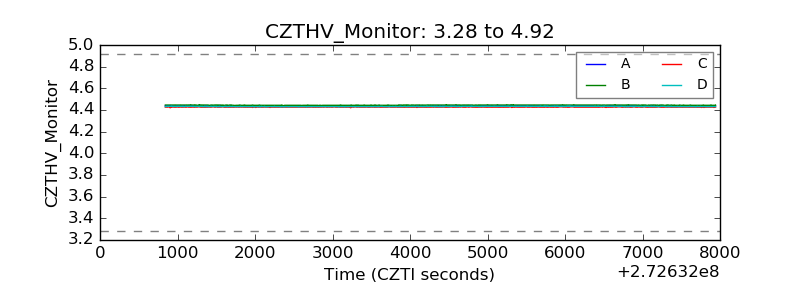 |
| D_VDD | 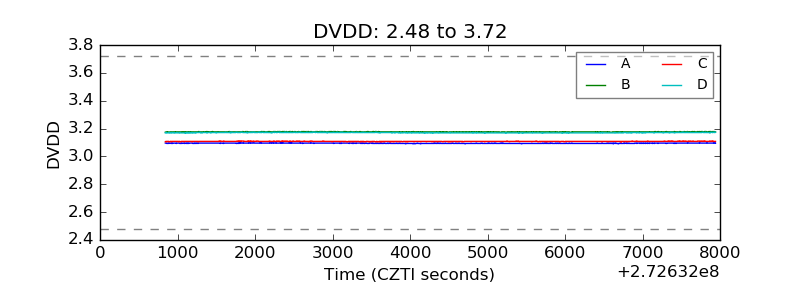 |
| Temperature 1 | 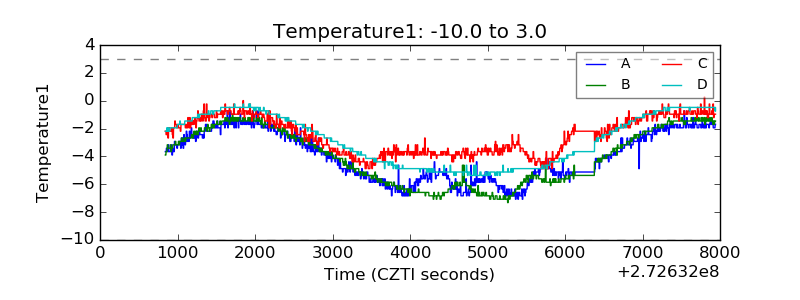 |
| Veto HV Monitor | 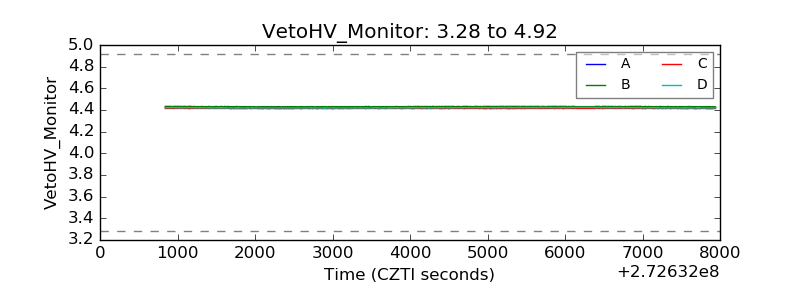 |
| Veto LLD | 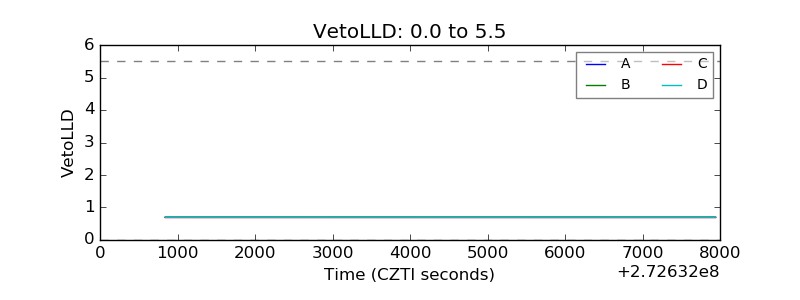 |
| Alpha Counter | 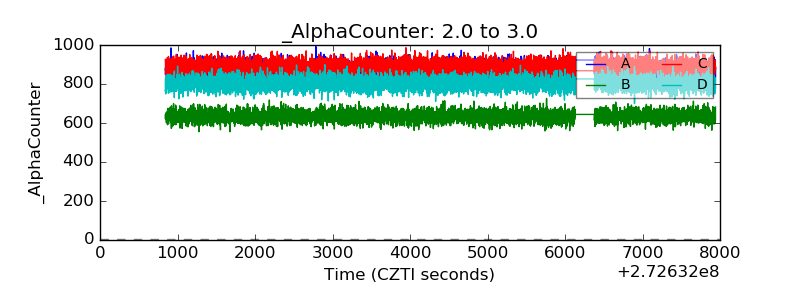 |
| _CPM_Rate | 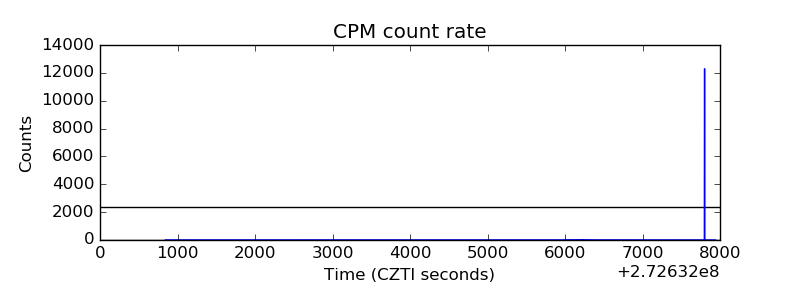 |
| CZT Counter | 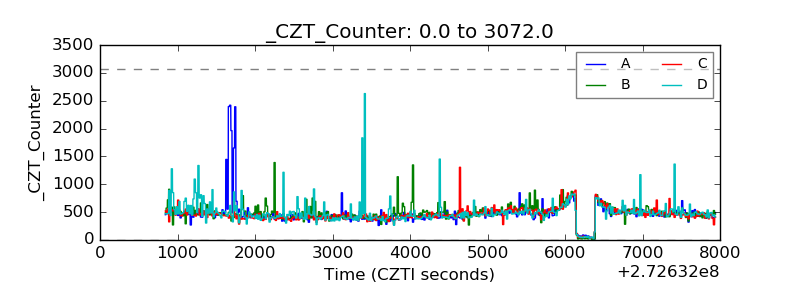 |
| +2.5 Volts monitor | 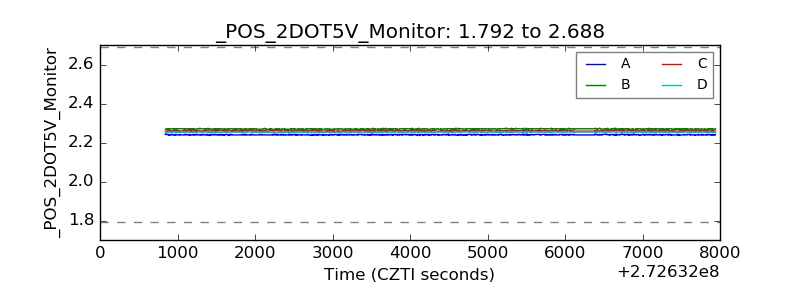 |
| +5 Volts monitor | 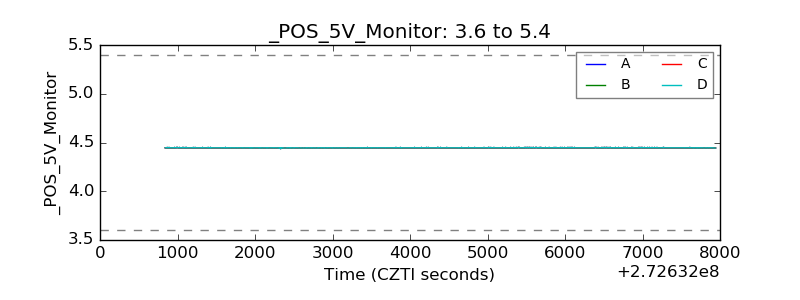 |
| _ROLL_ROT | 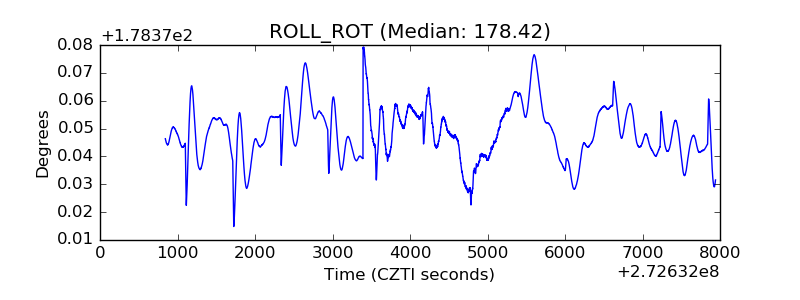 |
| _Roll_DEC | 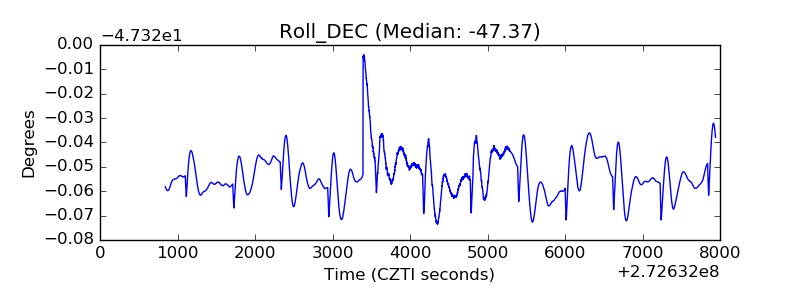 |
| _Roll_RA | 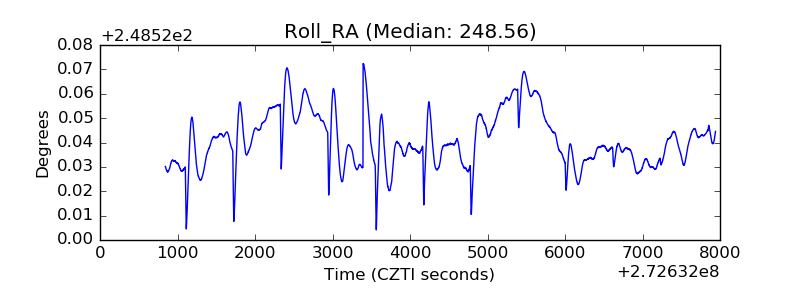 |
| Veto Counter | 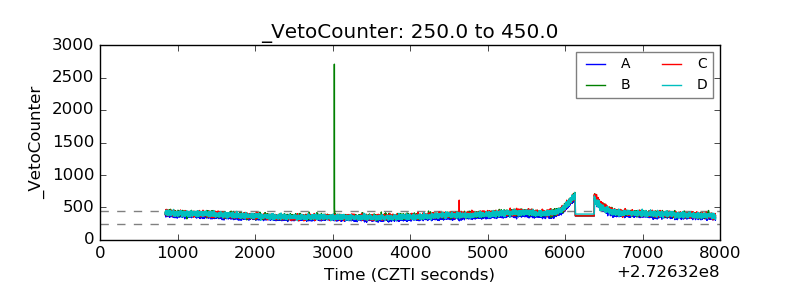 |