| Param | Original file | Final file |
|---|---|---|
| Filename | modeM0/AS1T02_084T01_9000002318_15684cztM0_level2.evt | modeM0/AS1T02_084T01_9000002318_15684cztM0_level2_quad_clean.evt |
| Size (bytes) | 1,222,960,320 | 230,016,960 |
| Size | 1.1 GB | 219.4 MB |
| Events in quadrant A | 8,331,965 | 1,456,106 |
| Events in quadrant B | 8,710,483 | 1,470,709 |
| Events in quadrant C | 8,750,874 | 1,430,347 |
| Events in quadrant D | 10,037,969 | 1,379,990 |
| Mode M0 | |||
|---|---|---|---|
| Quadrant | BADHDUFLAG | Total packets | Discarded packets |
| A | 0 | 37046 | 4 |
| B | 0 | 37512 | 3 |
| C | 0 | 37965 | 3 |
| D | 0 | 42433 | 3 |
| Mode M9 | |||
|---|---|---|---|
| Quadrant | BADHDUFLAG | Total packets | Discarded packets |
| A | 0 | 21 | 0 |
| B | 0 | 21 | 0 |
| C | 0 | 21 | 0 |
| D | 0 | 21 | 0 |
| Mode SS | |||
|---|---|---|---|
| Quadrant | BADHDUFLAG | Total packets | Discarded packets |
| A | 0 | 360 | 0 |
| B | 0 | 360 | 0 |
| C | 0 | 360 | 0 |
| D | 0 | 360 | 0 |
| Quadrant | Total seconds | Saturated seconds | Saturation percentage |
|---|---|---|---|
| A | 17846 | 156 | 0.874145% |
| B | 17846 | 88 | 0.493108% |
| C | 17846 | 174 | 0.975008% |
| D | 17846 | 526 | 2.947439% |
Noise dominated data is calculated using 1-second bins in cleaned event files. If a bin has >2000 counts, and if more than 50% of those come from <1% of pixels, then it is considered to be noise-dominated and hence unusable.
| Quadrant | # 1 sec bins | Bins with >0 counts | Bins with >2000 counts | High rate bins dominated by noise | Noise dominated (total time) | Noise dominated (detector-on time) | Marked lightcurve |
|---|---|---|---|---|---|---|---|
| A | 19853 | 17850 | 66 | 66 | 0.33% | 0.37% | 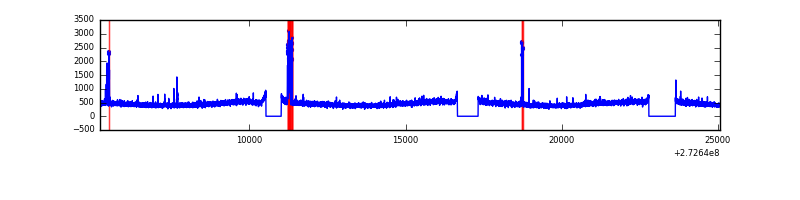 |
| B | 19853 | 17850 | 4 | 4 | 0.02% | 0.02% | 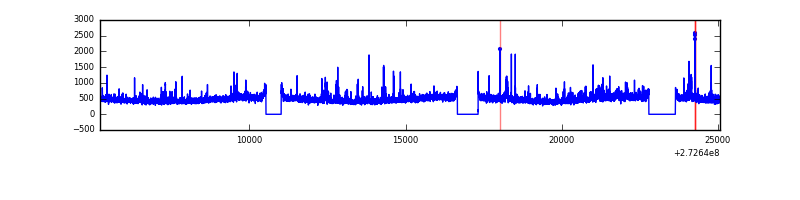 |
| C | 19853 | 17850 | 32 | 32 | 0.16% | 0.18% | 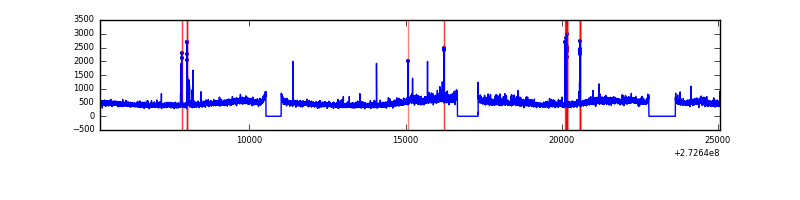 |
| D | 19853 | 17850 | 428 | 428 | 2.16% | 2.40% | 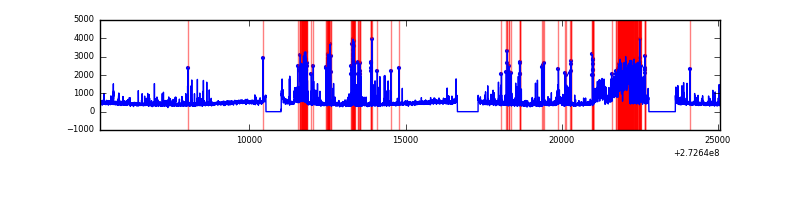 |
Top three noisy pixels from each quadrant. If the there are fewer than three noisy pixels in the level2.evt file, extra rows are filled as -1
| Pixel properties | Quadrant properties | ||||||
|---|---|---|---|---|---|---|---|
| Quadrant | DetID | PixID | Counts | Sigma | Mean | Median | Sigma |
| A | 13 | 248 | 268093 | 628.41 | 2088 | 2043 | 423.4 |
| A | 0 | 226 | 18702 | 39.35 | 2088 | 2043 | 423.4 |
| A | 13 | 210 | 18345 | 38.51 | 2088 | 2043 | 423.4 |
| B | 0 | 214 | 122632 | 305.14 | 2092 | 2040 | 395.2 |
| B | 0 | 189 | 92926 | 229.97 | 2092 | 2040 | 395.2 |
| B | 4 | 216 | 86046 | 212.56 | 2092 | 2040 | 395.2 |
| C | 3 | 233 | 445191 | 950.38 | 1998 | 2008 | 466.3 |
| C | 14 | 238 | 306897 | 653.81 | 1998 | 2008 | 466.3 |
| C | 9 | 54 | 167889 | 355.72 | 1998 | 2008 | 466.3 |
| D | 1 | 52 | 2122417 | 4332.85 | 2007 | 1949 | 489.4 |
| D | 2 | 120 | 77563 | 154.51 | 2007 | 1949 | 489.4 |
| D | 2 | 234 | 75667 | 150.63 | 2007 | 1949 | 489.4 |
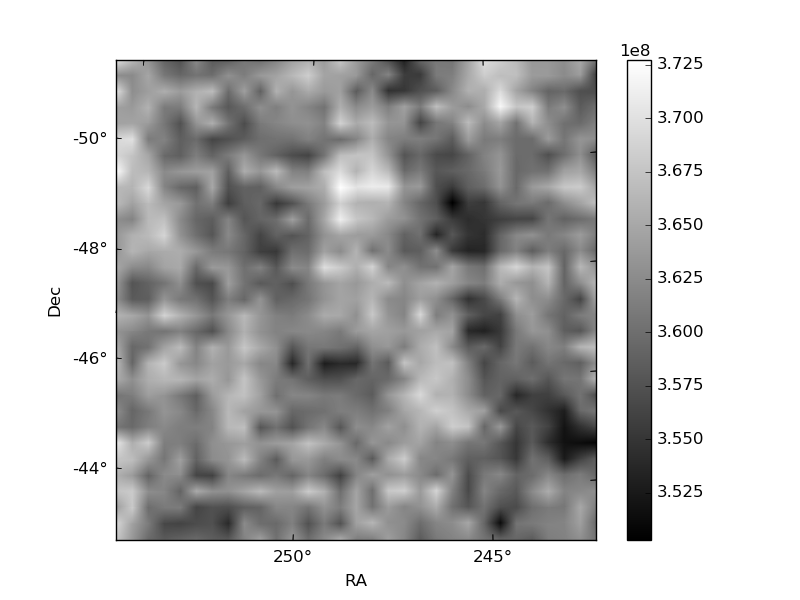
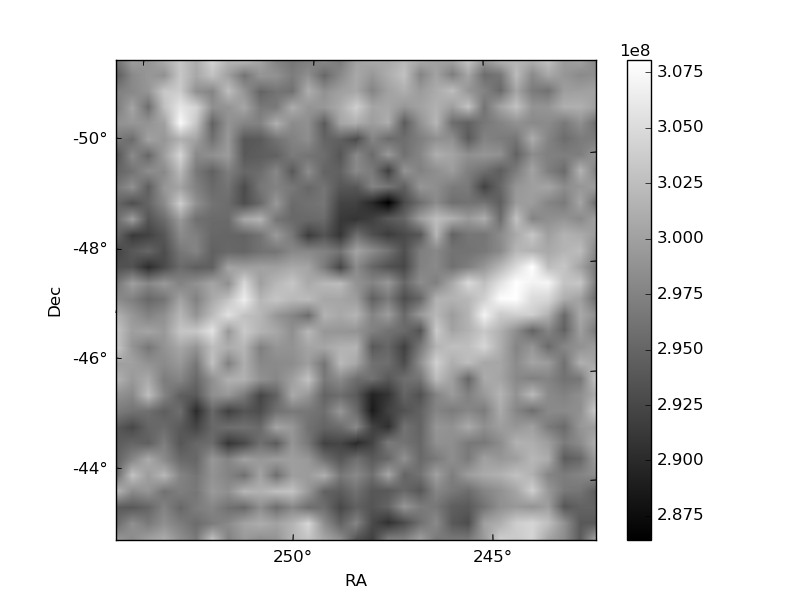
Histogram calculated using DETX and DETY for each event in the final _common_clean file
| Quadrant A | 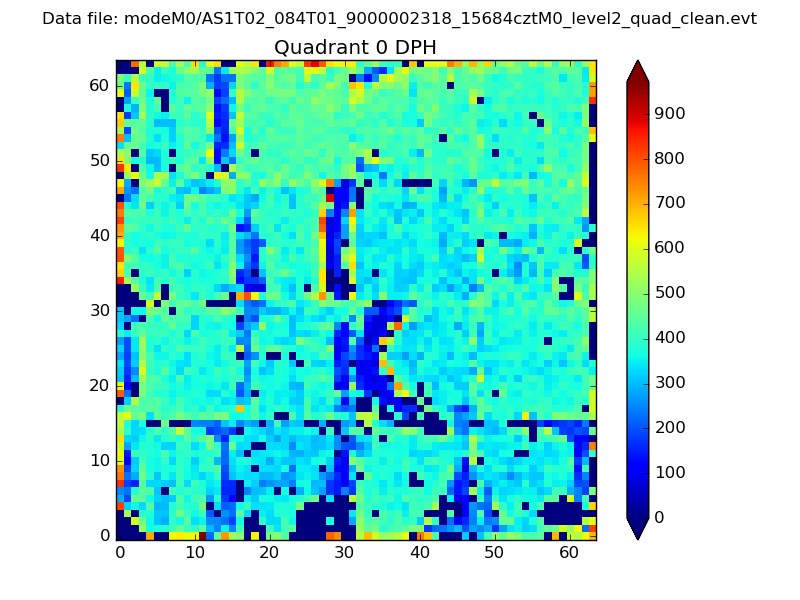 |
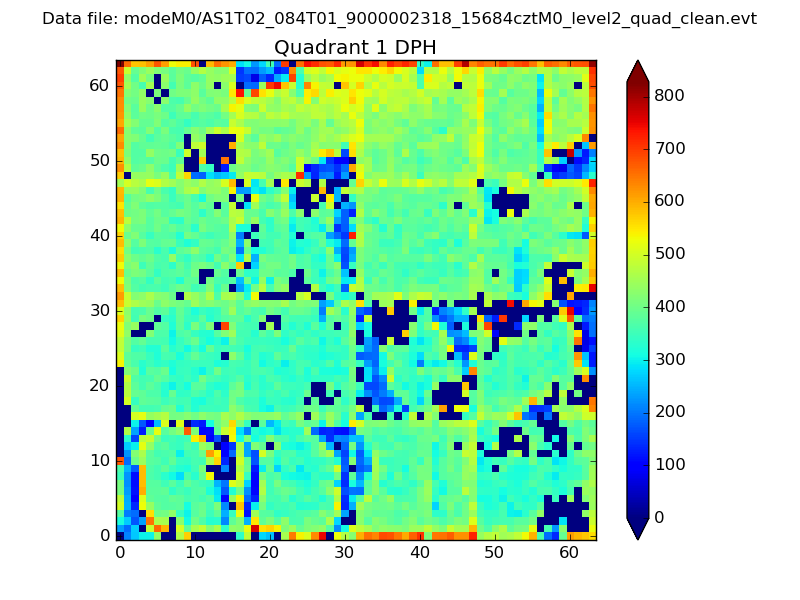 |
Quadrant B |
|---|---|---|---|
| Quadrant D | 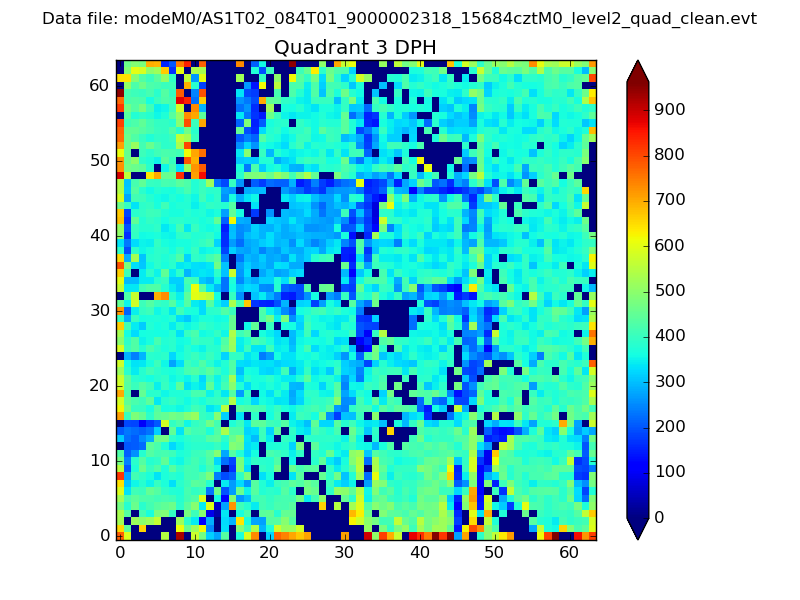 |
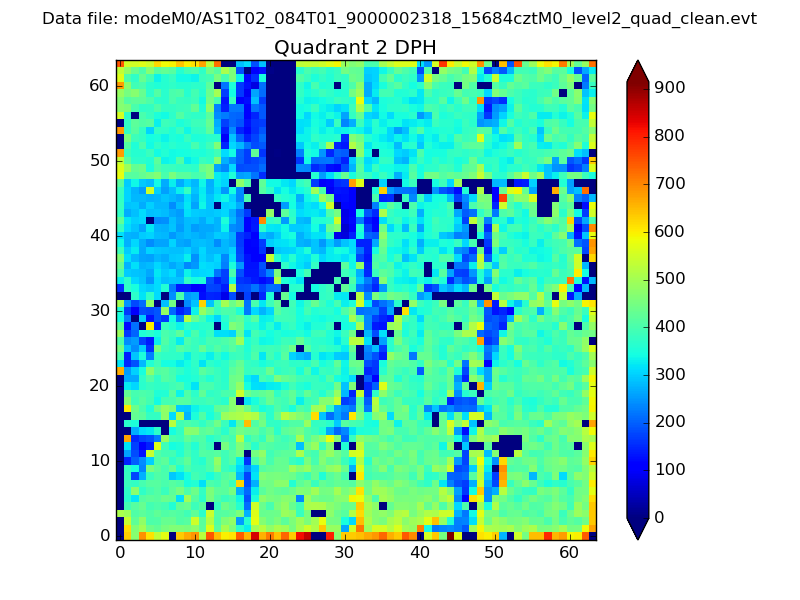 |
Quadrant C |
| Plot type | Count rate plots | Images |
|---|---|---|
| Comparison with Poisson distribution Blue bars denote a histogram of data divided into 1 sec bins. Red curve is a Poisson curve with rate = median count rate of data. |
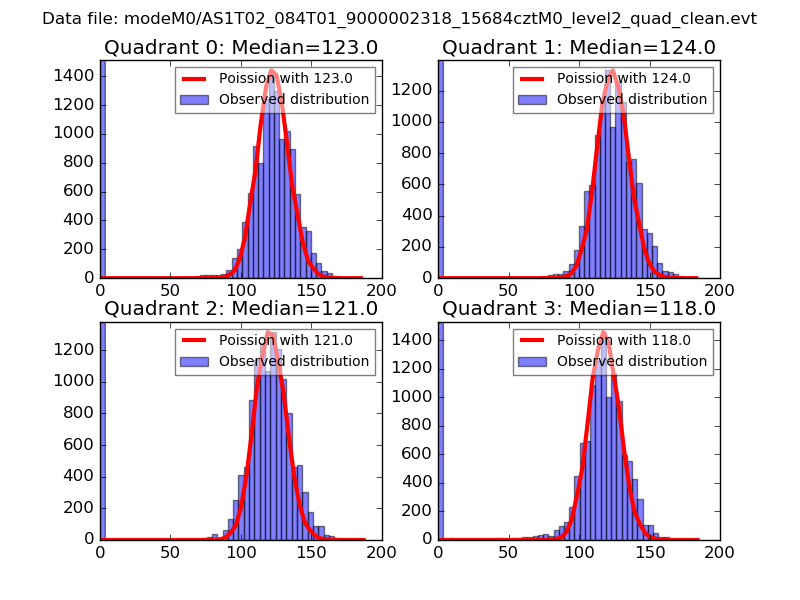 |
 |
| Quadrant-wise count rates Data is divided into 100 sec bins |
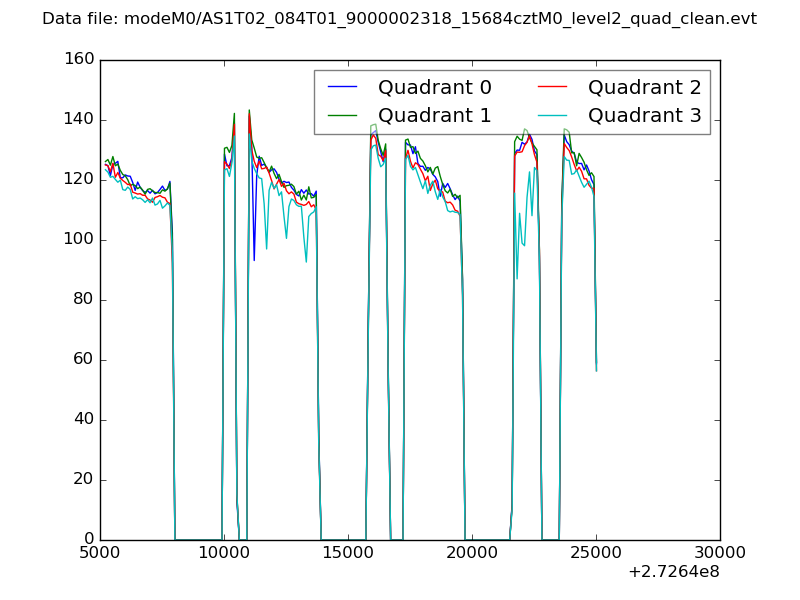 |
|
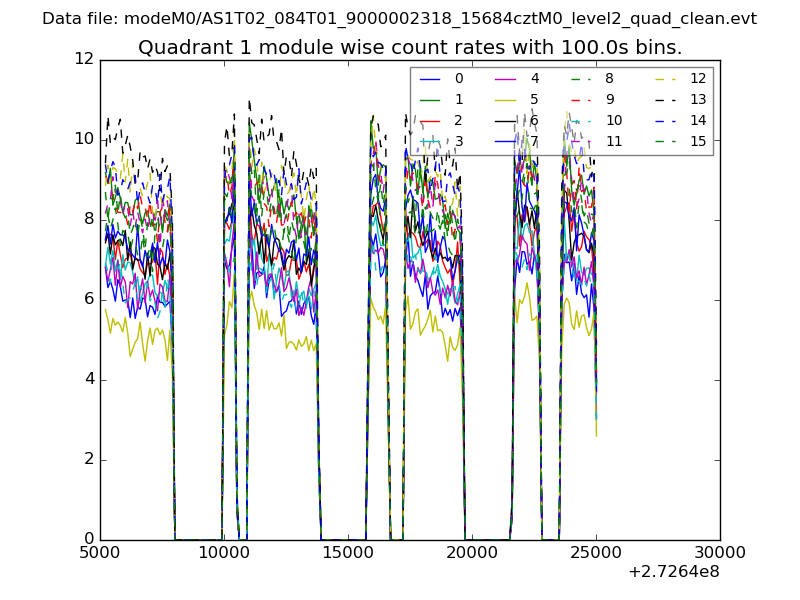
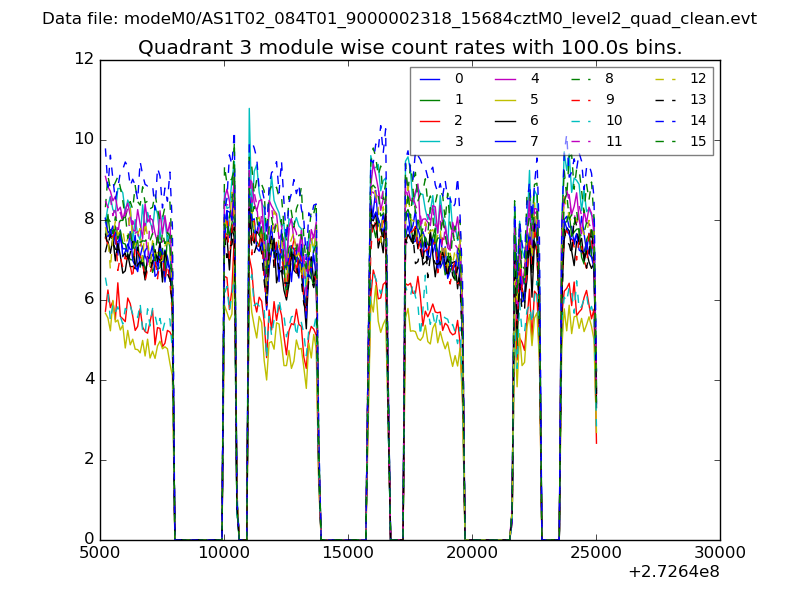
| Module-wise count rates for Quadrant A Data is divided into 100 sec bins |
 |
 |
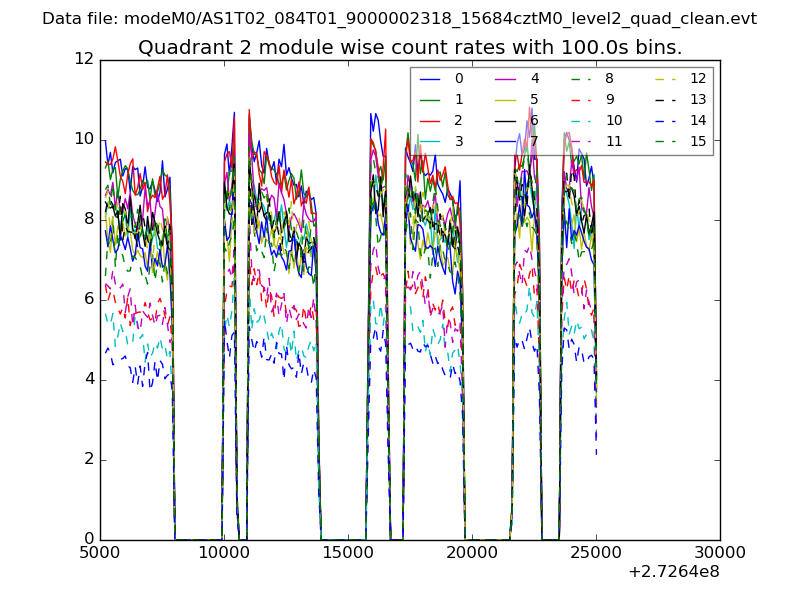
| Module-wise count rates for Quadrant B Data is divided into 100 sec bins |
 |
 |
| Module-wise count rates for Quadrant C Data is divided into 100 sec bins |
 |
 |
| Module-wise count rates for Quadrant D Data is divided into 100 sec bins |
 |
 |
| Parameter | Plot |
|---|---|
| CZT HV Monitor |  |
| D_VDD | 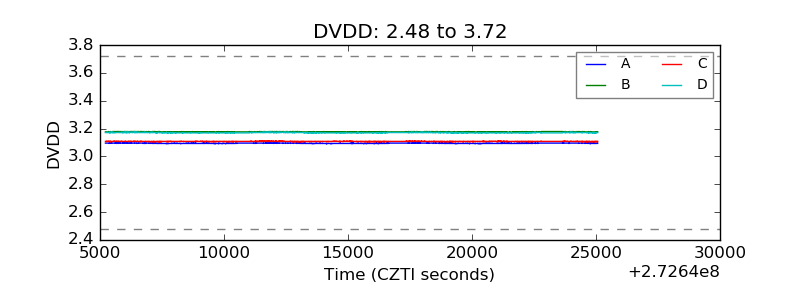 |
| Temperature 1 | 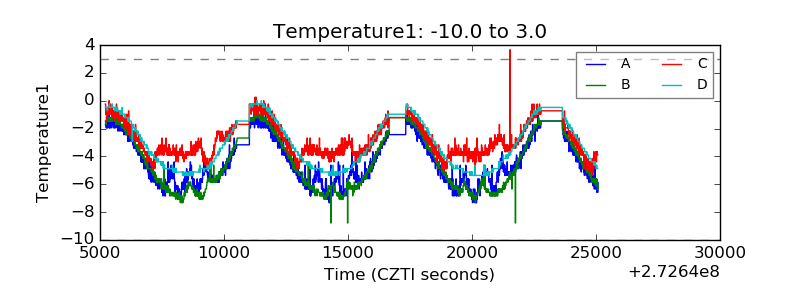 |
| Veto HV Monitor | 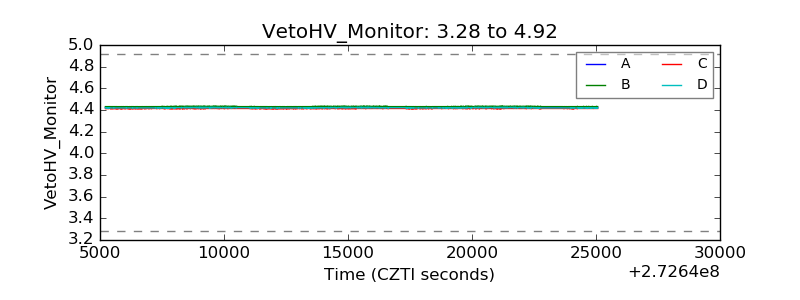 |
| Veto LLD | 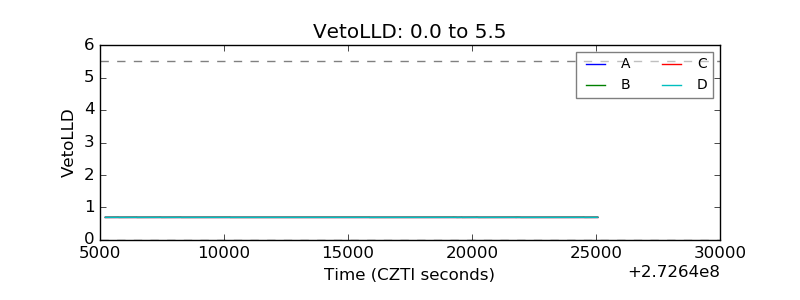 |
| Alpha Counter | 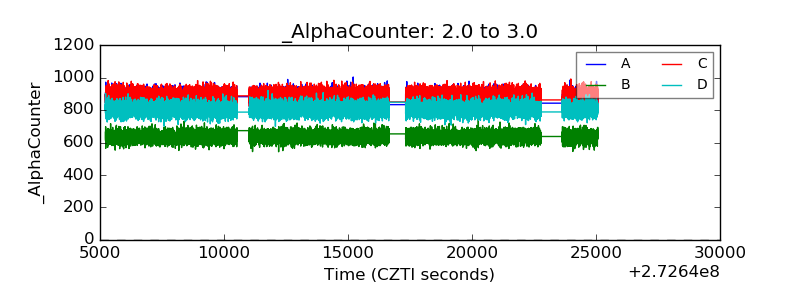 |
| _CPM_Rate | 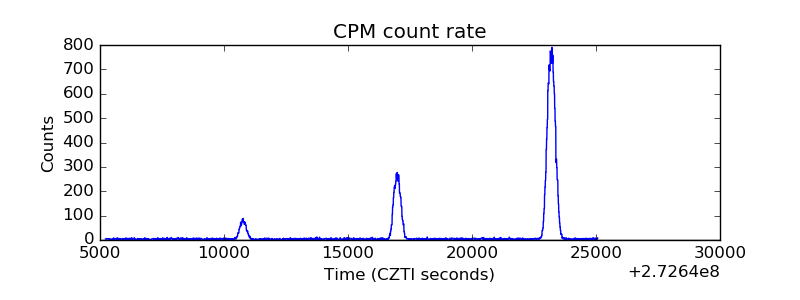 |
| CZT Counter | 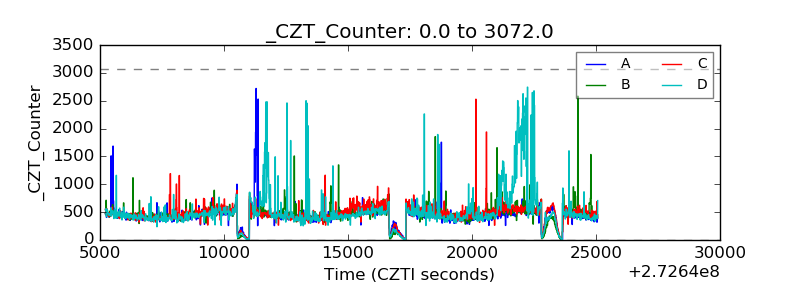 |
| +2.5 Volts monitor | 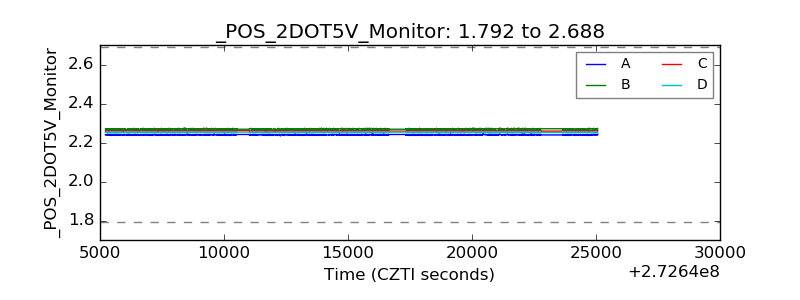 |
| +5 Volts monitor | 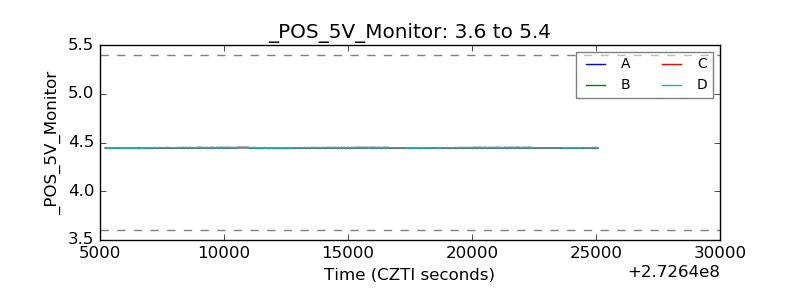 |
| _ROLL_ROT | 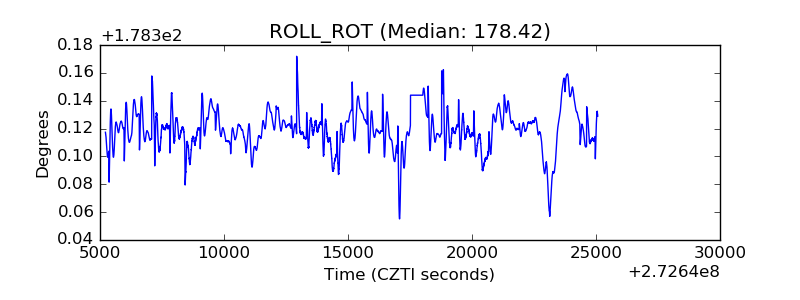 |
| _Roll_DEC | 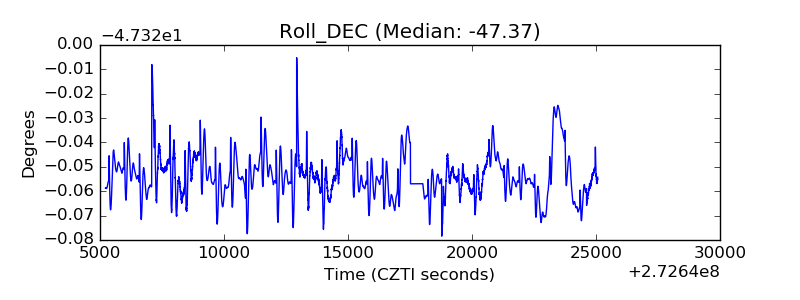 |
| _Roll_RA | 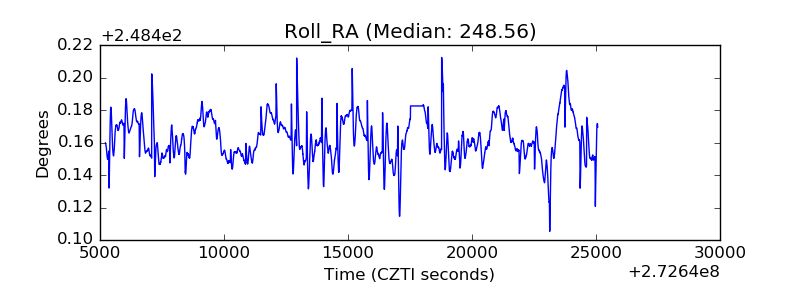 |
| Veto Counter | 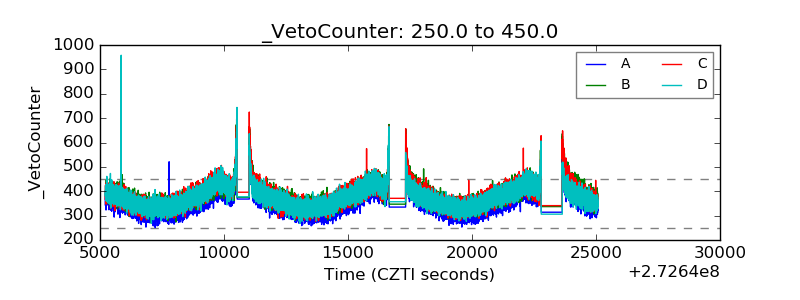 |