| Param | Original file | Final file |
|---|---|---|
| Filename | modeM0/AS1T02_084T01_9000002318_15685cztM0_level2.evt | modeM0/AS1T02_084T01_9000002318_15685cztM0_level2_quad_clean.evt |
| Size (bytes) | 472,809,600 | 90,558,720 |
| Size | 450.9 MB | 86.4 MB |
| Events in quadrant A | 3,049,849 | 581,584 |
| Events in quadrant B | 3,310,494 | 588,610 |
| Events in quadrant C | 3,342,943 | 569,223 |
| Events in quadrant D | 4,172,930 | 548,411 |
| Mode M0 | |||
|---|---|---|---|
| Quadrant | BADHDUFLAG | Total packets | Discarded packets |
| A | 0 | 13482 | 3 |
| B | 0 | 14030 | 2 |
| C | 0 | 13975 | 2 |
| D | 0 | 17039 | 2 |
| Mode M9 | |||
|---|---|---|---|
| Quadrant | BADHDUFLAG | Total packets | Discarded packets |
| A | 0 | 11 | 0 |
| B | 0 | 11 | 0 |
| C | 0 | 11 | 0 |
| D | 0 | 12 | 0 |
| Mode SS | |||
|---|---|---|---|
| Quadrant | BADHDUFLAG | Total packets | Discarded packets |
| A | 0 | 132 | 0 |
| B | 0 | 132 | 0 |
| C | 0 | 132 | 0 |
| D | 0 | 132 | 0 |
| Quadrant | Total seconds | Saturated seconds | Saturation percentage |
|---|---|---|---|
| A | 6519 | 27 | 0.414174% |
| B | 6519 | 23 | 0.352815% |
| C | 6519 | 40 | 0.613591% |
| D | 6519 | 414 | 6.350667% |
Noise dominated data is calculated using 1-second bins in cleaned event files. If a bin has >2000 counts, and if more than 50% of those come from <1% of pixels, then it is considered to be noise-dominated and hence unusable.
| Quadrant | # 1 sec bins | Bins with >0 counts | Bins with >2000 counts | High rate bins dominated by noise | Noise dominated (total time) | Noise dominated (detector-on time) | Marked lightcurve |
|---|---|---|---|---|---|---|---|
| A | 7540 | 6521 | 10 | 10 | 0.13% | 0.15% | 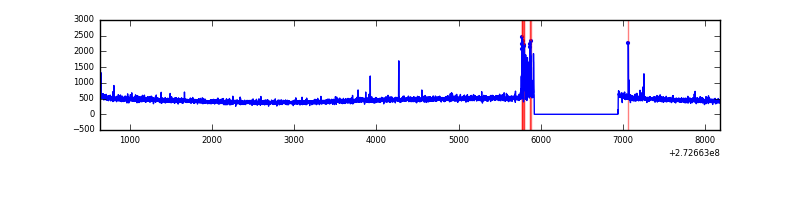 |
| B | 7540 | 6521 | 5 | 5 | 0.07% | 0.08% | 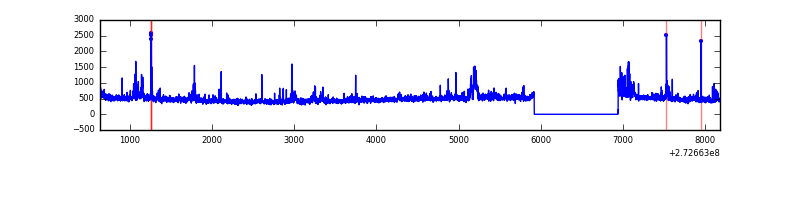 |
| C | 7540 | 6521 | 1 | 1 | 0.01% | 0.02% | 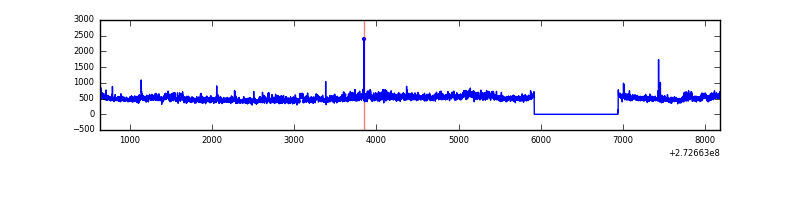 |
| D | 7540 | 6521 | 432 | 432 | 5.73% | 6.62% | 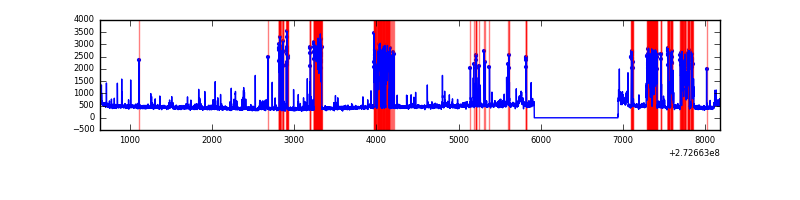 |
Top three noisy pixels from each quadrant. If the there are fewer than three noisy pixels in the level2.evt file, extra rows are filled as -1
| Pixel properties | Quadrant properties | ||||||
|---|---|---|---|---|---|---|---|
| Quadrant | DetID | PixID | Counts | Sigma | Mean | Median | Sigma |
| A | 13 | 248 | 96560 | 614.86 | 765 | 749 | 155.8 |
| A | 4 | 2 | 12529 | 75.6 | 765 | 749 | 155.8 |
| A | 0 | 226 | 6917 | 39.58 | 765 | 749 | 155.8 |
| B | 0 | 189 | 105686 | 707.64 | 769 | 750 | 148.3 |
| B | 0 | 214 | 53464 | 355.48 | 769 | 750 | 148.3 |
| B | 4 | 216 | 42151 | 279.19 | 769 | 750 | 148.3 |
| C | 3 | 233 | 346055 | 2007.43 | 732 | 736 | 172.0 |
| C | 14 | 238 | 112380 | 649.01 | 732 | 736 | 172.0 |
| C | 9 | 54 | 16453 | 91.37 | 732 | 736 | 172.0 |
| D | 1 | 52 | 1336699 | 7544.24 | 720 | 698 | 177.1 |
| D | 10 | 40 | 42954 | 238.61 | 720 | 698 | 177.1 |
| D | 2 | 120 | 28352 | 156.16 | 720 | 698 | 177.1 |
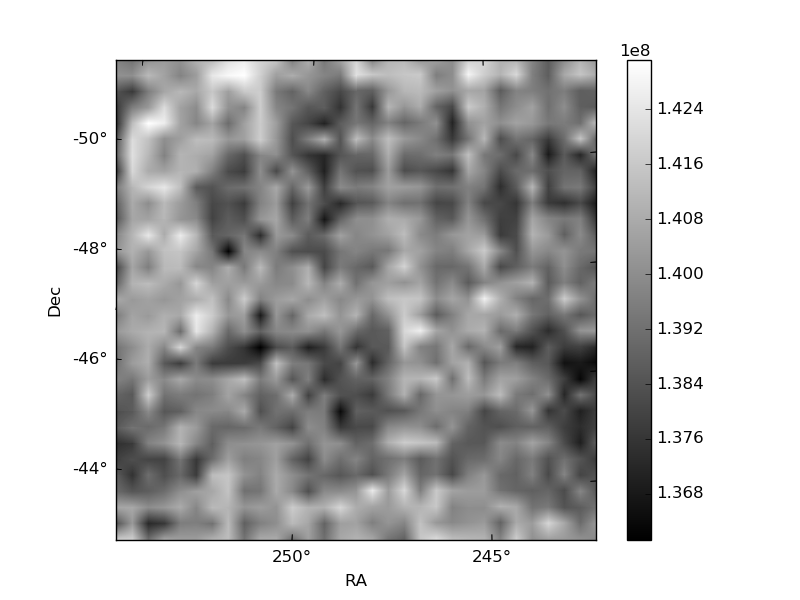
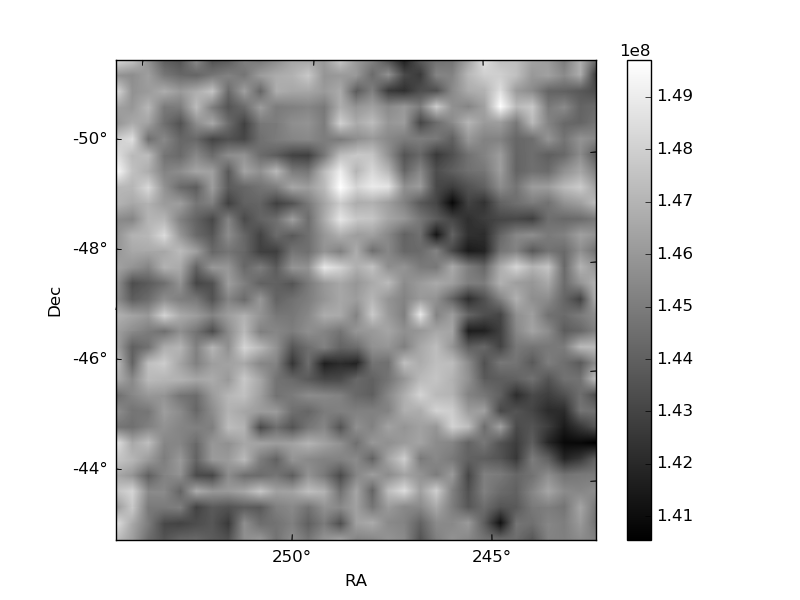
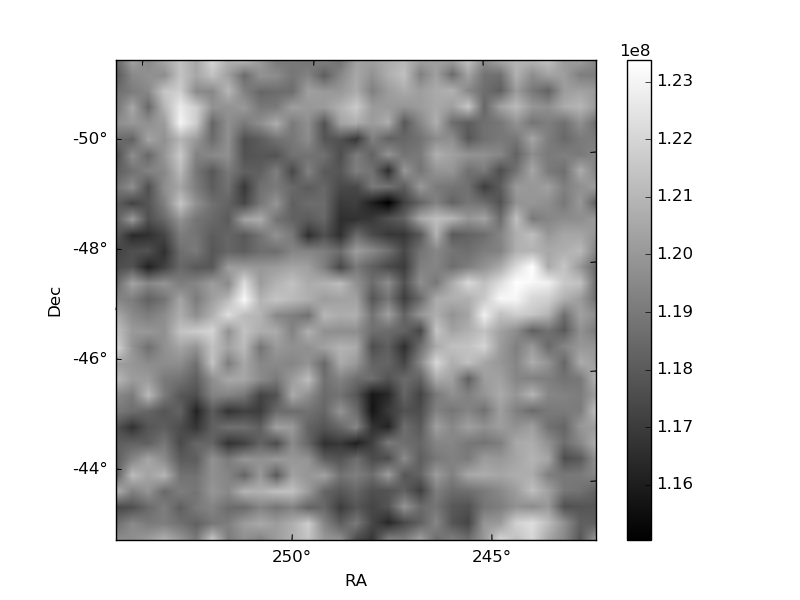
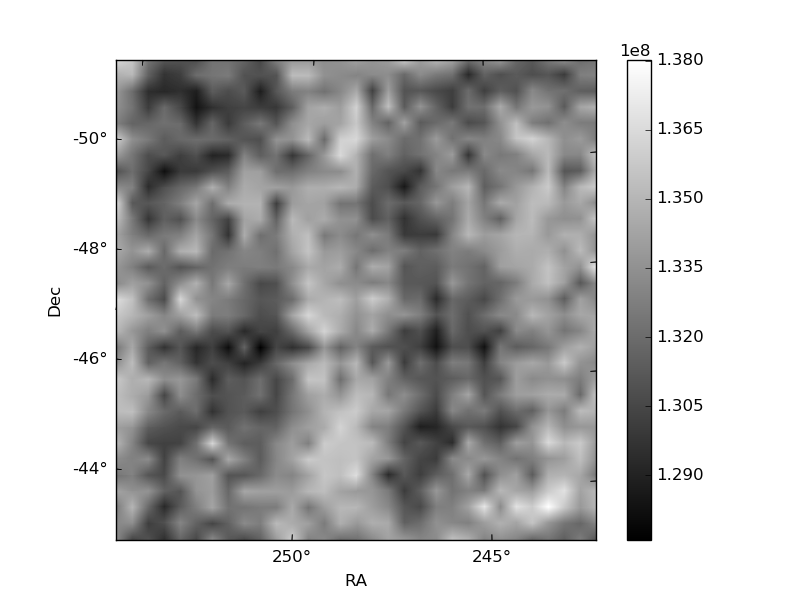
Histogram calculated using DETX and DETY for each event in the final _common_clean file
| Quadrant A | 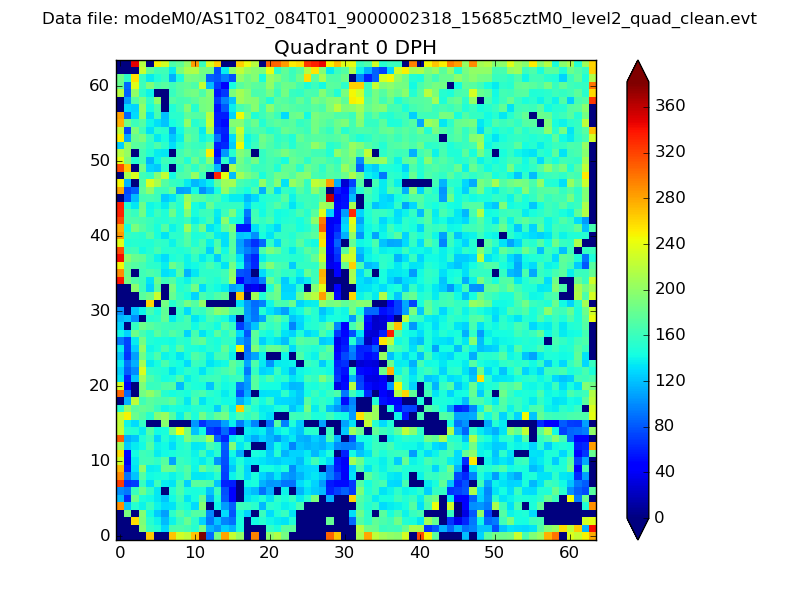 |
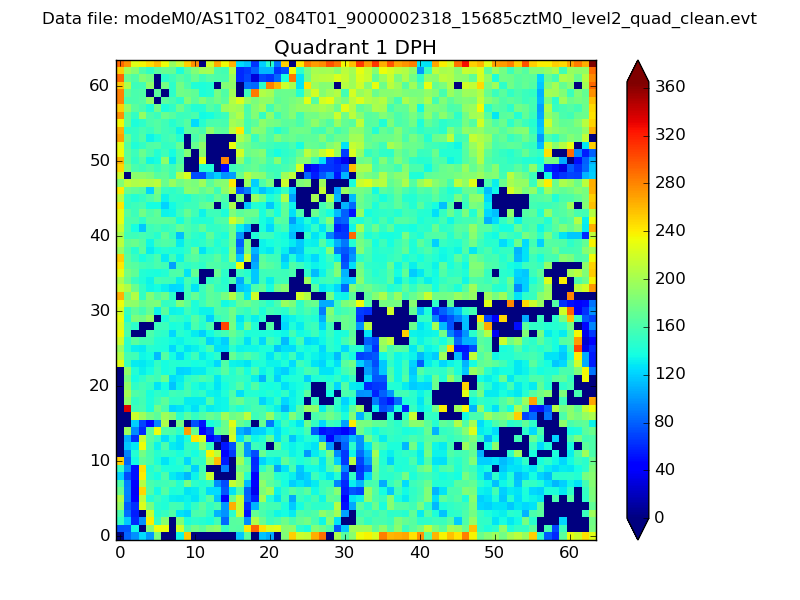 |
Quadrant B |
|---|---|---|---|
| Quadrant D |  |
 |
Quadrant C |
| Plot type | Count rate plots | Images |
|---|---|---|
| Comparison with Poisson distribution Blue bars denote a histogram of data divided into 1 sec bins. Red curve is a Poisson curve with rate = median count rate of data. |
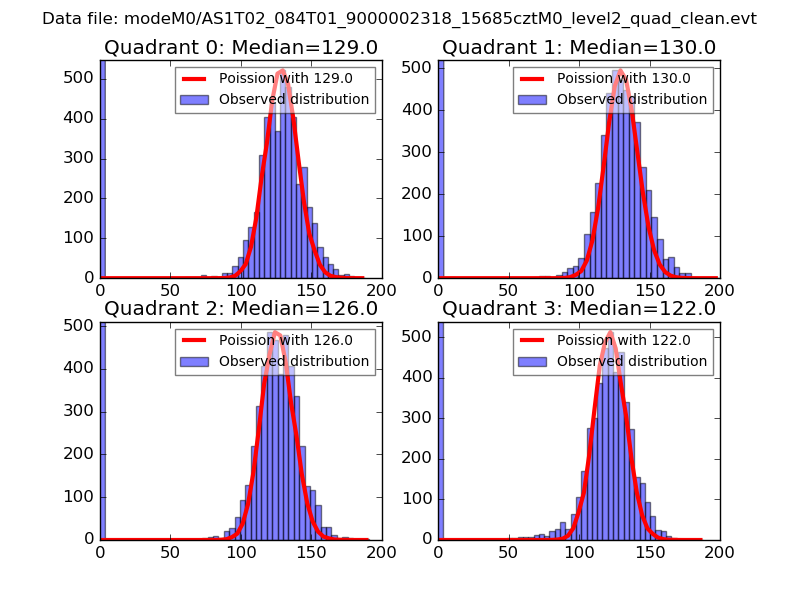 |
 |
| Quadrant-wise count rates Data is divided into 100 sec bins |
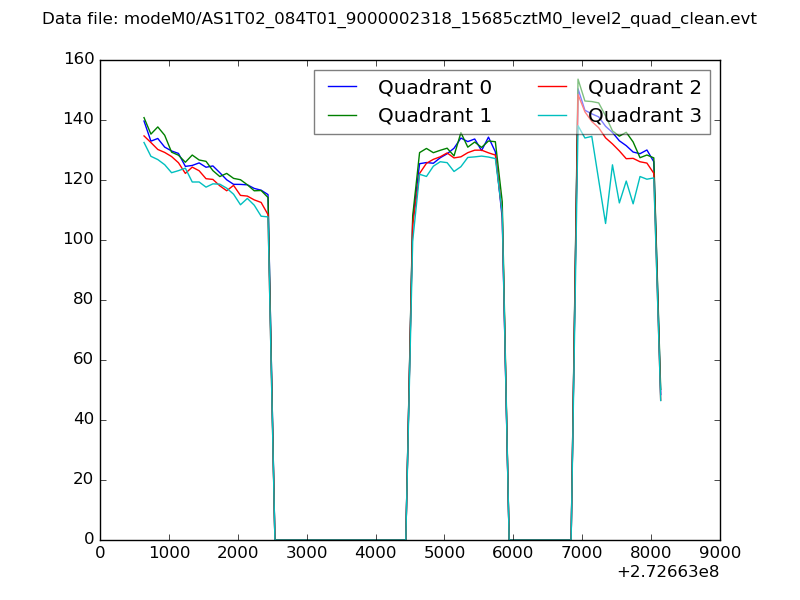 |
|
| Module-wise count rates for Quadrant A Data is divided into 100 sec bins |
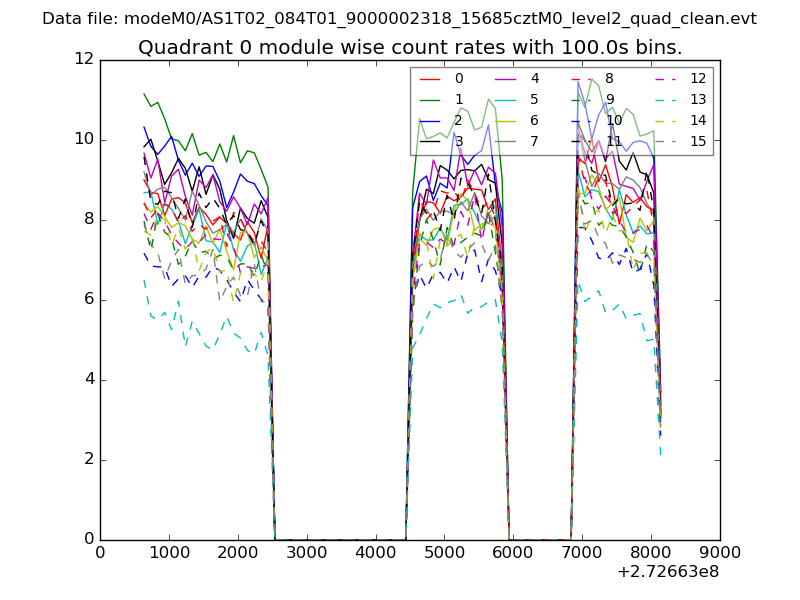 |
 |
| Module-wise count rates for Quadrant B Data is divided into 100 sec bins |
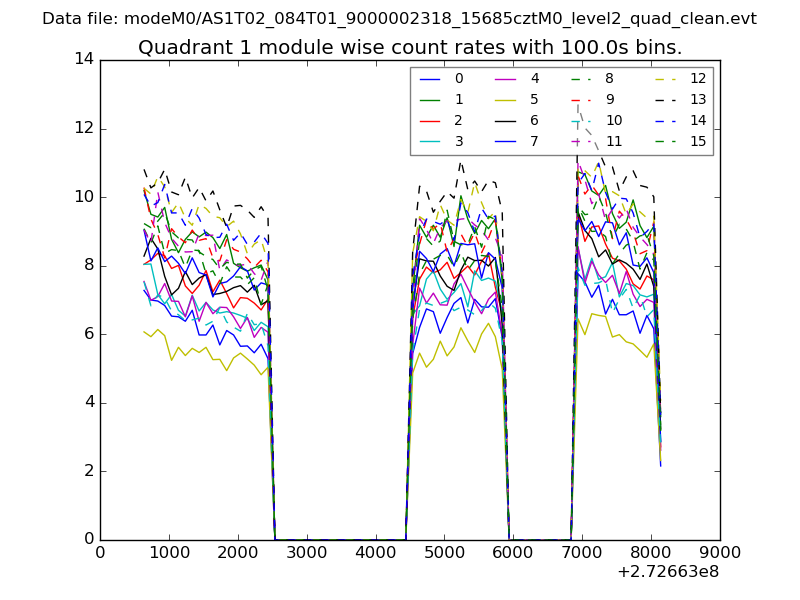 |
 |
| Module-wise count rates for Quadrant C Data is divided into 100 sec bins |
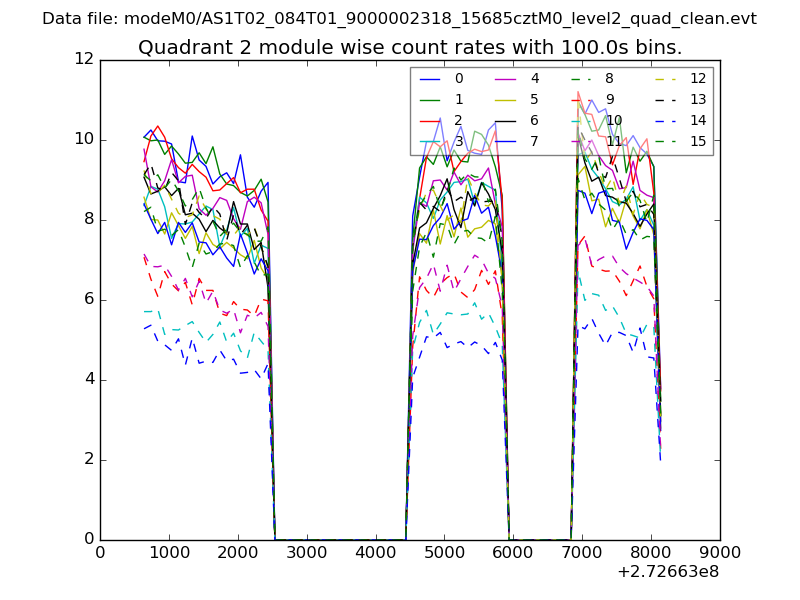 |
 |
| Module-wise count rates for Quadrant D Data is divided into 100 sec bins |
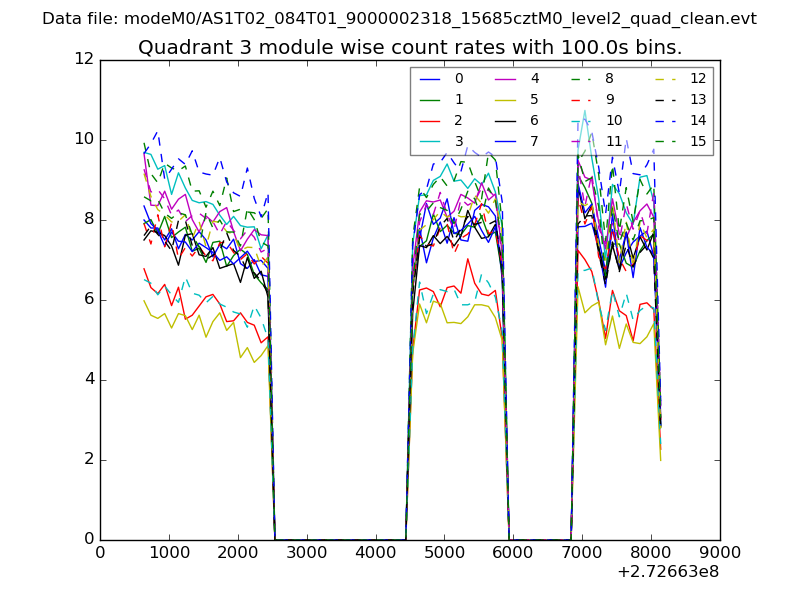 |
 |
| Parameter | Plot |
|---|---|
| CZT HV Monitor | 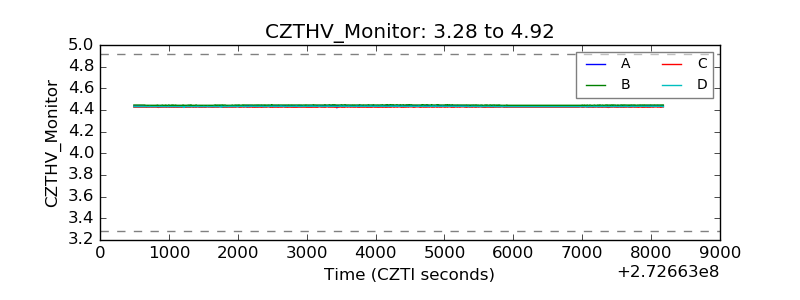 |
| D_VDD | 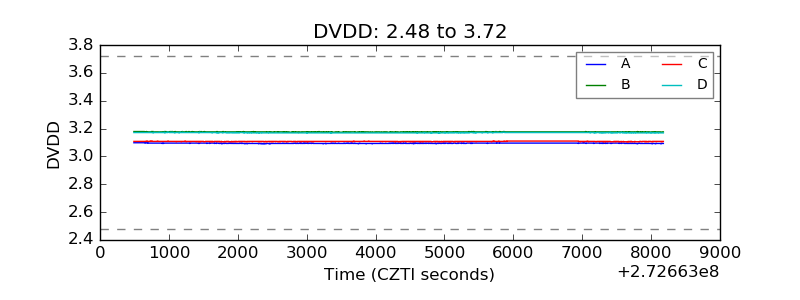 |
| Temperature 1 | 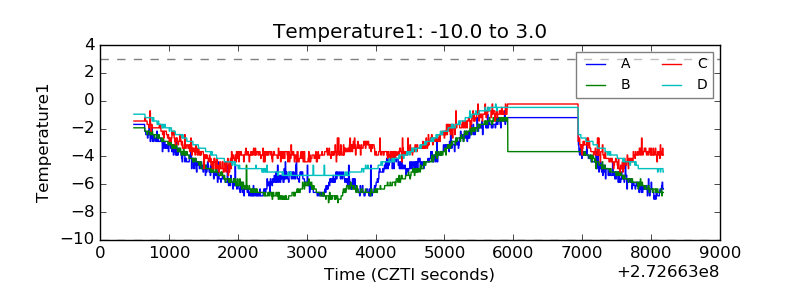 |
| Veto HV Monitor | 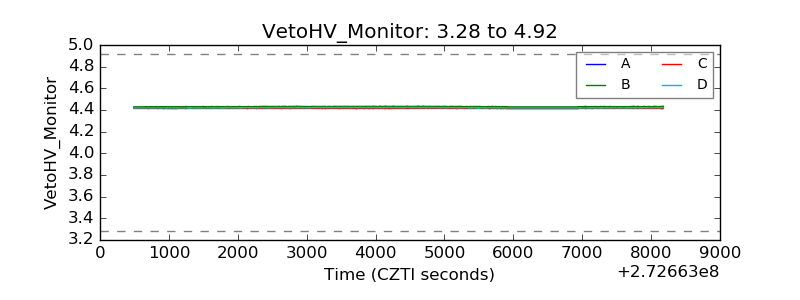 |
| Veto LLD | 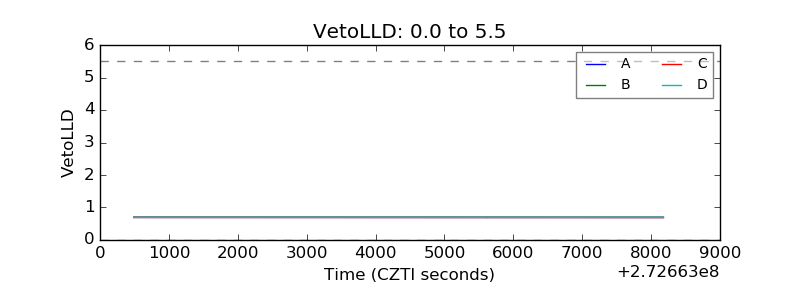 |
| Alpha Counter | 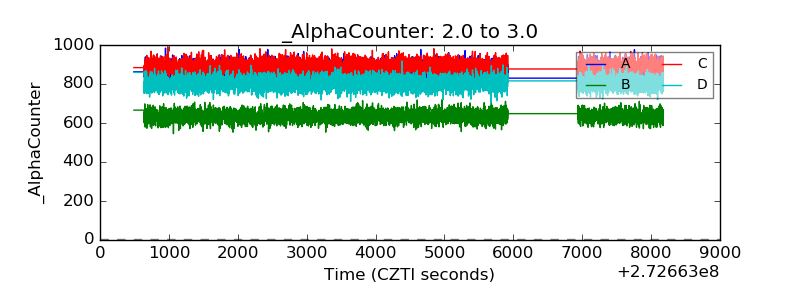 |
| _CPM_Rate | 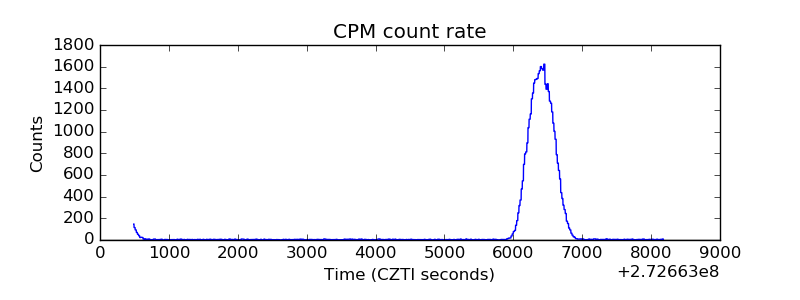 |
| CZT Counter | 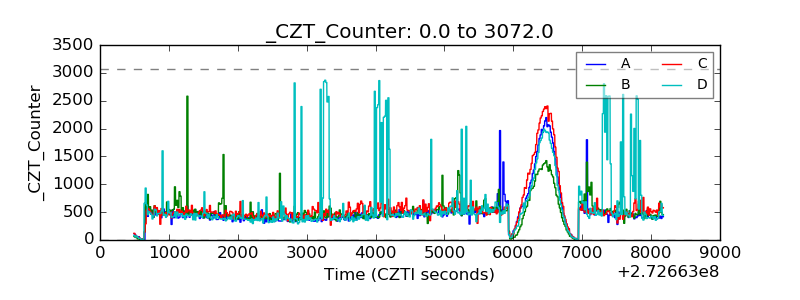 |
| +2.5 Volts monitor |  |
| +5 Volts monitor |  |
| _ROLL_ROT | 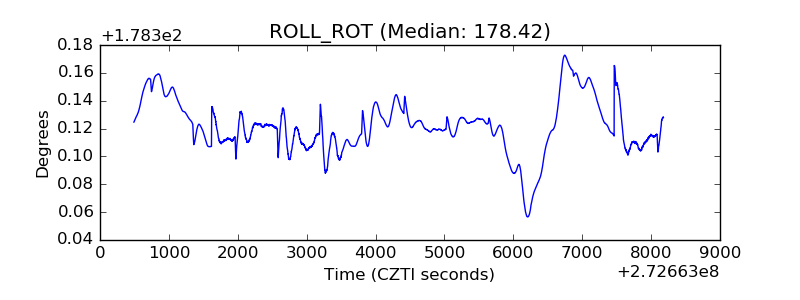 |
| _Roll_DEC | 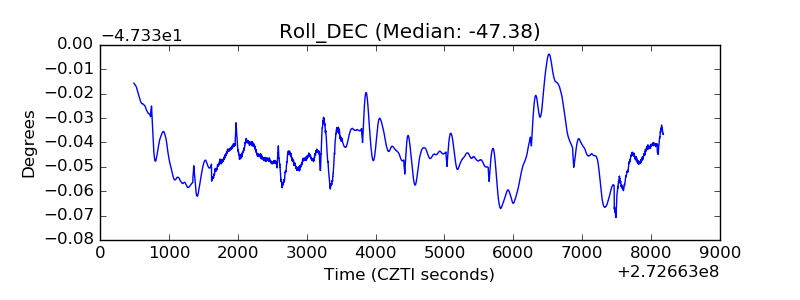 |
| _Roll_RA | 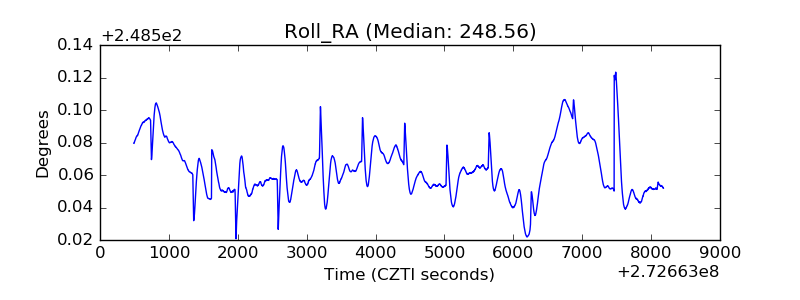 |
| Veto Counter | 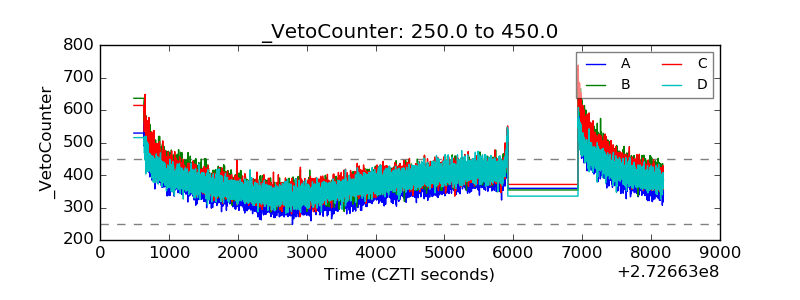 |